. 2015 Jan;17(1):53-63.
doi: 10.1016/j.jmoldx.2014.09.008. Epub 2014 Nov 7.

Assessing copy number alterations in targeted, amplicon-based next-generation sequencing data

Affiliations

Assessing copy number alterations in targeted, amplicon-based next-generation sequencing data

Catherine Grasso et al. J Mol Diagn. 2015 Jan.

Abstract

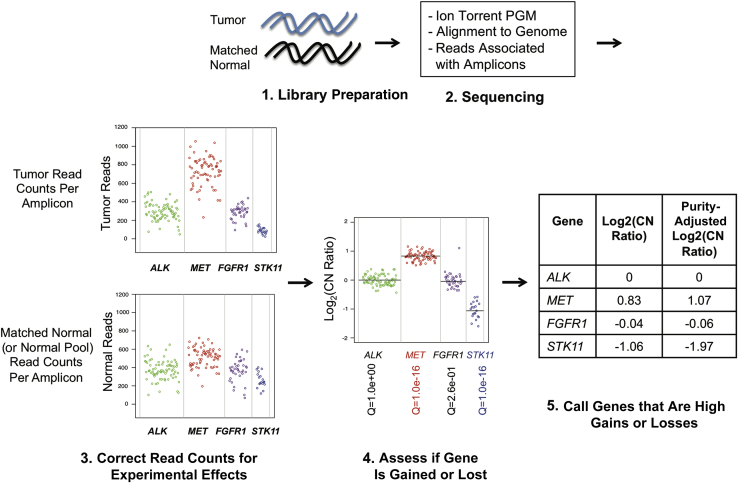
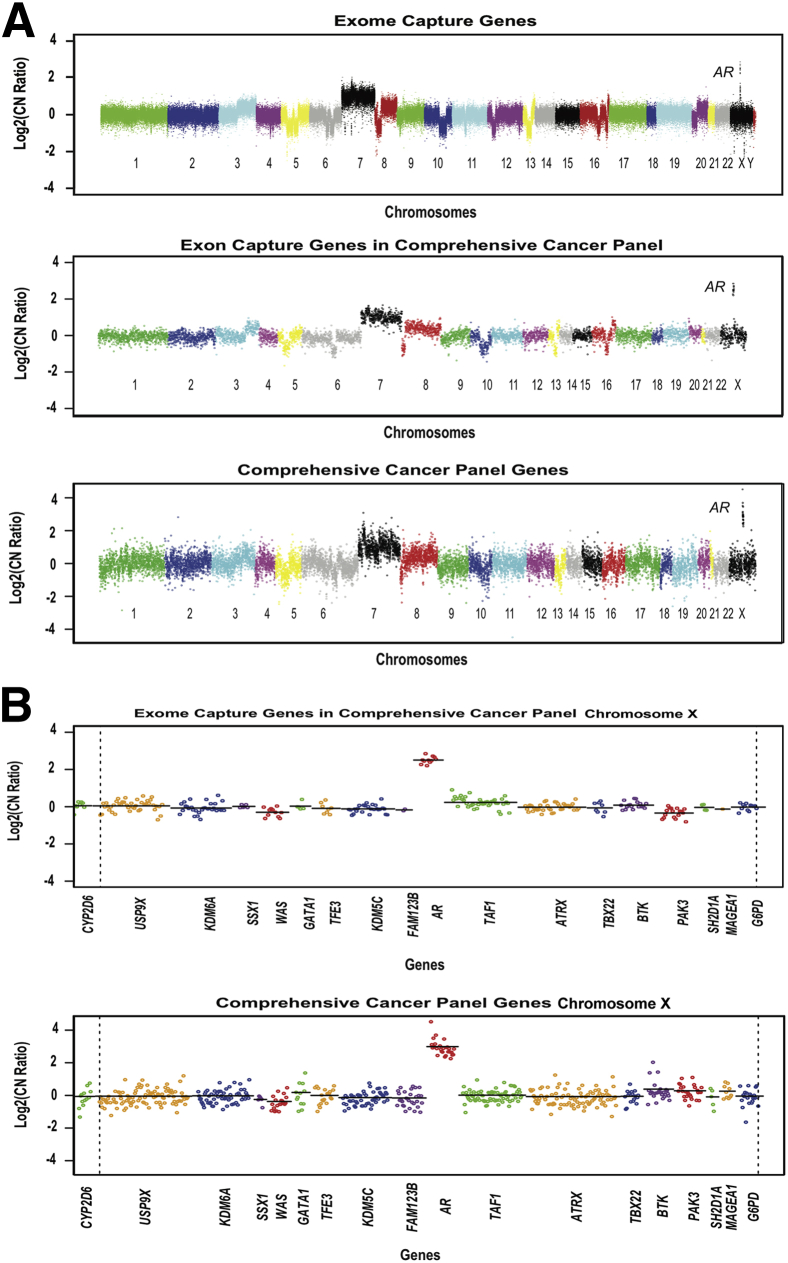
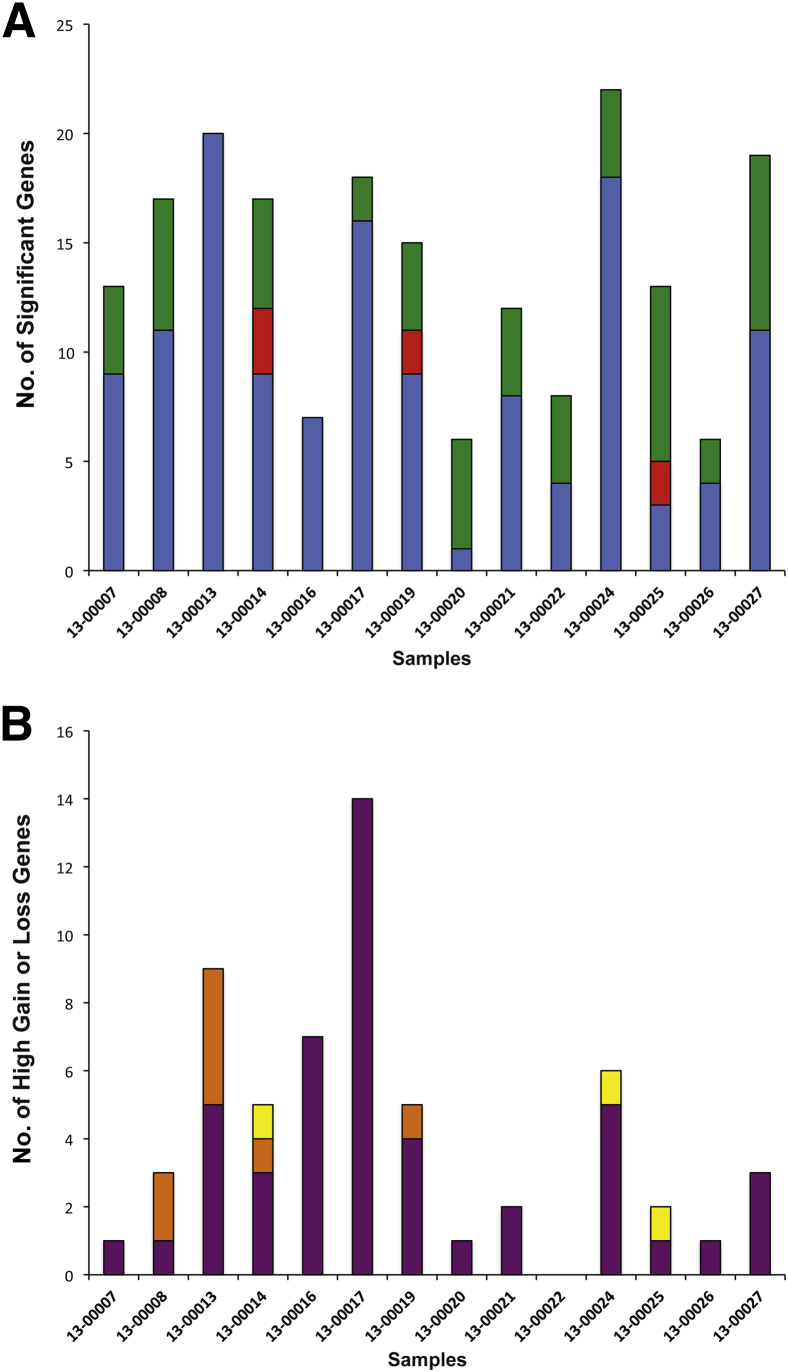
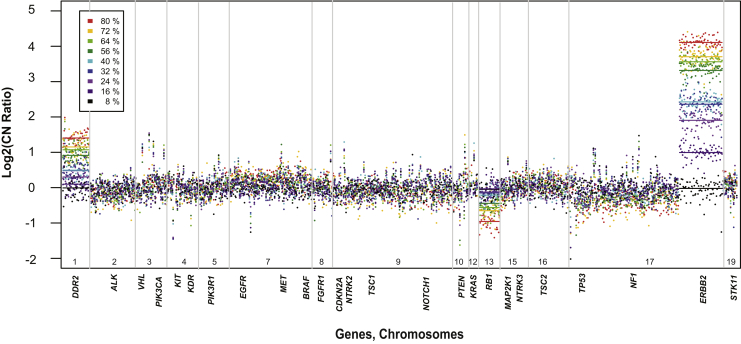
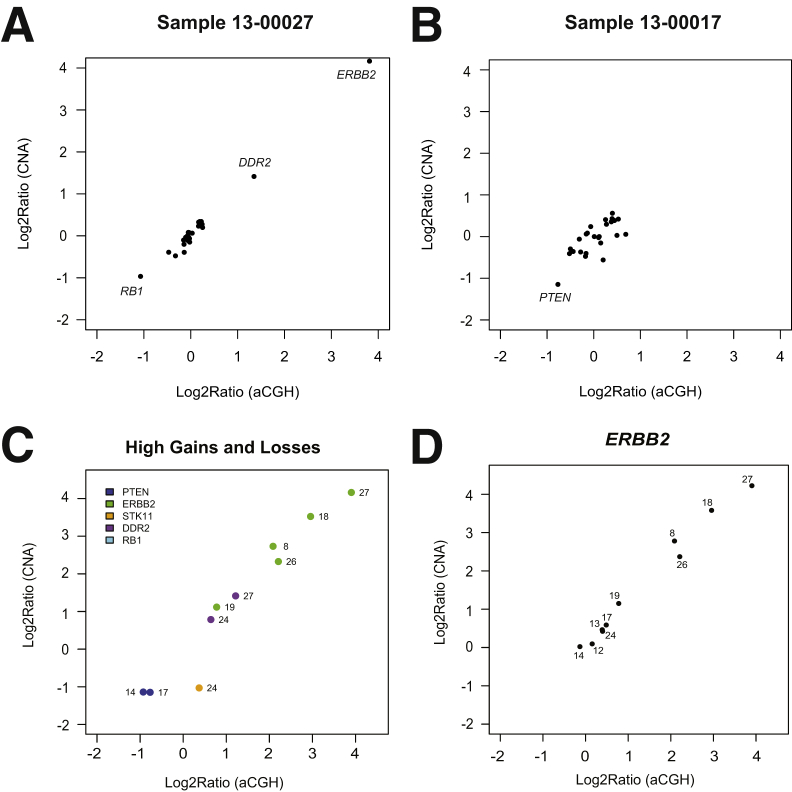
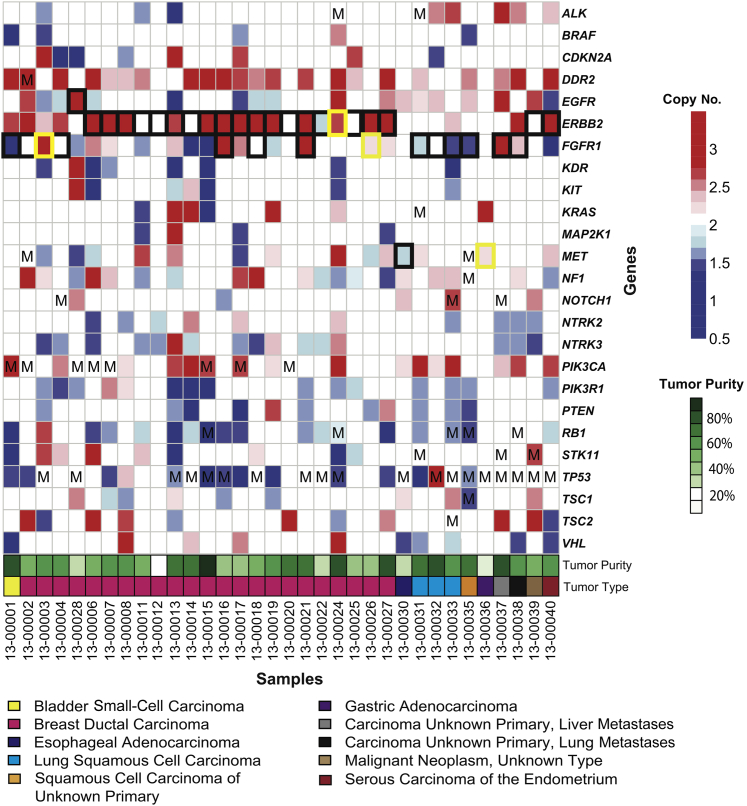
Changes in gene copy number are important in the setting of precision medicine. Recent studies have established that copy number alterations (CNAs) can be detected in sequencing libraries prepared by hybridization-capture, but there has been comparatively little attention given to CNA assessment in amplicon-based libraries prepared by PCR. In this study, we developed an algorithm for detecting CNAs in amplicon-based sequencing data. CNAs determined from the algorithm mirrored those from a hybridization-capture library. In addition, analysis of 14 pairs of matched normal and breast carcinoma tissues revealed that sequence data pooled from normal samples could be substituted for a matched normal tissue without affecting the detection of clinically relevant CNAs (>|2| copies). Comparison of CNAs identified by array comparative genomic hybridization and amplicon-based libraries across 10 breast carcinoma samples showed an excellent correlation. The CNA algorithm also compared favorably with fluorescence in situ hybridization, with agreement in 33 of 38 assessments across four different genes. Factors that influenced the detection of CNAs included the number of amplicons per gene, the average read depth, and, most important, the proportion of tumor within the sample. Our results show that CNAs can be identified in amplicon-based targeted sequencing data, and that their detection can be optimized by ensuring adequate tumor content and read coverage.


Figures

Figure 1
Figure 1
Overview of copy number analysis algorithm. (1) Library Preparation: tumor and matched normal genomic DNA are turned into targeted amplicon-based libraries. (2) Sequencing: the libraries are sequenced on the Ion Torrent PGM, and the reads are aligned to the human genome and associated with the amplicon targets. (3) Correct read counts for experimental effects: the tumor read counts for each amplicon are normalized for the total number of reads in the sample, and then divided by the normalized matched normal (or normal pool) read counts, and then GC content corrected to determine the copy number ratio for each amplicon. (4) Assess if gene is gained or lost: the weighted averages of the amplicon copy number ratios to generate a Log2(copy number ratio) for each gene are taken and then the variability of amplicons within the gene (and comparison with pooled normal samples, when available) is used to determine the q-value for the gene being gained or lost. (5) Call genes that are high gains or losses: the Log2(copy number ratio) for tumor purity is adjusted and then cutoffs of >0.58 for high gains and <−1 for high losses are applied. In this illustration, the amplicons for four genes are shown: ALK (green), MET (red), FGFR1 (purple), and STK11 (blue). The final weighted average for each gene is shown as a black line. A table shows the Log2(copy number ratios), both before and after the tumor purity correction. On the basis of the cutoffs for high gains and losses, MET and ALK are called.
Figure 2
Figure 2
Comparison of targeted sequencing to exome sequencing in detecting CNAs. A: Overall copy number across the genome is shown for metastatic prostate cancer sample WA25. Data from whole-exome sequencing of DNA from fresh-frozen tumor are compared with targeted sequencing of DNA, using the CCP, from FFPE tumor. The Log2(copy number ratio) for all exons in the exome capture and the exome sequencing restricted to the 409 genes present in the CCP targeted sequencing panel to facilitate comparison are shown. There is not necessarily an exact one-to-one match between amplicons and exon capture targets for each gene. Log2(copy number ratio) between tumor and matched normal tissue is shown on the vertical axis; each point represents the GC-content corrected, normalized, log-transformed ratio for targeted exon or amplicon, and ordered by genomic coordinates. B: Overall copy number across chromosome X for metastatic prostate sample WA25 by exome sequencing and targeted sequencing. Log2(copy number ratio) between the tumor and matched normal tissue is shown on the vertical axis; each point represents the GC-content corrected, normalized, log-transformed ratio for targeted exon or amplicon, and ordered by genomic coordinates. A line is drawn for the weighted average of the targeted exons or amplicons for each gene.
Figure 3
Figure 3
Comparison of copy number calls using both pooled and matched normal samples. A: Comparison of significant calls made using the matched normal sample or the normal pool. The bar plot shows the number of CNA calls made across the 14 matched breast tumor samples, indicating the number of significant calls that were made using both the matched normal and the normal pool (blue bars), as compared with those made only when using the matched normal pool (green bars) and those made only when using the normal pool (red bars). B: Comparison of high copy number gain or loss calls made using the matched normal sample or the normal pool. The bar plot shows the number of CNA calls made across the 14 matched breast tumor samples, indicating the number of high copy number gain or loss calls that were made using both the matched normal and the normal pool (purple bars), as compared with those made only when using the matched normal (yellow bars) and those made only when using the normal pool (orange bars).
Figure 4
Figure 4
Serial dilution to test sensitivity of CNA detection in targeted sequencing. Visualization of dilutions of breast tumor 13-00027 with its matched normal DNA. Each dilution has a unique color. Lines represent the weighted average for copy number ratio for each gene.
Figure 5
Figure 5
Comparison of fold change measurement with aCGH data. A and B: Log2(copy number ratios) for all genes from targeted amplicon-based sequencing approach are plotted versus Log2(copy number ratios) assessed using aCGH for sample 13-00027 (A) and sample 13-00017 (B). C: Log2(copy number ratios) from targeted amplicon-based sequencing are plotted versus Log2(copy number ratios) assessed using aCGH for observations that were high gains or losses (copy number ratio, >1.5 or <0.5) on the basis of the targeted sequencing approach among 10 breast tumor samples. D:ERBB2 Log2(copy number ratios) from targeted amplicon-based sequencing of 10 breast tumor samples are plotted versus Log2(copy number ratios) assessed using aCGH. Sample names have been abbreviated (eg, sample 13-00012 is denoted as 12).
Figure 6
Figure 6
Summary of all significant CNAs and somatic mutations across 34 solid tumors. Significant (q < 0.01) gains and losses are indicated by red squares and blue squares, respectively, whereas white squares indicate the gene was not significantly gained or lost. FISH for ERBB2, FGFR1, and/or MET was performed on a subset of tumors and correlated with high gain or loss calls made using the targeted sequencing approach. Agreement is shown by a black border, whereas disagreement is shown by a yellow border. Mutations (Ms) were identified across several genes using the targeted sequencing approach.

References

    1. Frampton G.M., Fichtenholtz A., Otto G.A., Wang K., Downing S.R., He J. Development and validation of a clinical cancer genomic profiling test based on massively parallel DNA sequencing. Nat Biotechnol. 2013;31:1023–1031. - PMC - PubMed
    1. Kerick M., Isau M., Timmermann B., Sultmann H., Herwig R., Krobitsch S., Schaefer G., Verdorfer I., Bartsch G., Klocker H., Lehrach H., Schweiger M.R. Targeted high throughput sequencing in clinical cancer settings: formaldehyde fixed-paraffin embedded (FFPE) tumor tissues, input amount and tumor heterogeneity. BMC Med Genomics. 2011;4:68. - PMC - PubMed
    1. Wagle N., Berger M.F., Davis M.J., Blumenstiel B., Defelice M., Pochanard P., Ducar M., Van H.P., Macconaill L.E., Hahn W.C., Meyerson M., Gabriel S.B., Garraway L.A. High-throughput detection of actionable genomic alterations in clinical tumor samples by targeted, massively parallel sequencing. Cancer Discov. 2012;2:82–93. - PMC - PubMed
    1. Beadling C., Neff T.L., Heinrich M.C., Rhodes K., Thornton M., Leamon J., Andersen M., Corless C.L. Combining highly multiplexed PCR with semiconductor-based sequencing for rapid cancer genotyping. J Mol Diagn. 2013;15:171–176. - PubMed
    1. Won H.H., Scott S.N., Brannon A.R., Shah R.H., Berger M.F. Detecting somatic genetic alterations in tumor specimens by exon capture and massively parallel sequencing. J Vis Exp. 2013;(80):e50710. - PMC - PubMed

Publication types

Substances