

Mathematical modeling of the insulin signal transduction pathway for prediction of insulin sensitivity from expression data
- PMID: 25468647
- PMCID: PMC4319670
- DOI: 10.1016/j.ymgme.2014.11.003
Mathematical modeling of the insulin signal transduction pathway for prediction of insulin sensitivity from expression data
Abstract
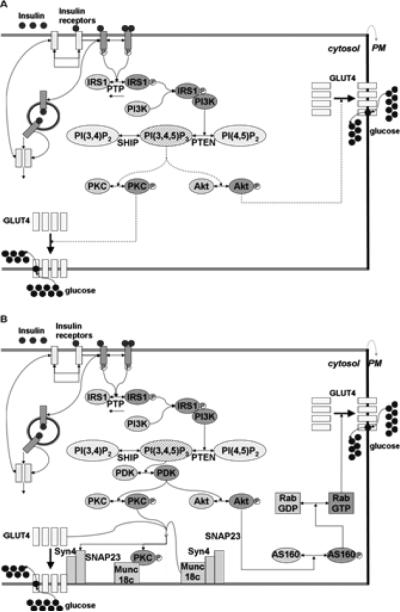
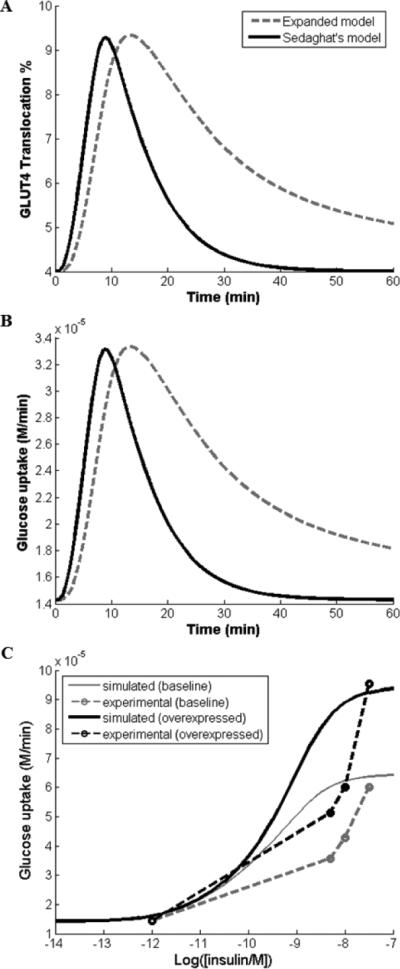
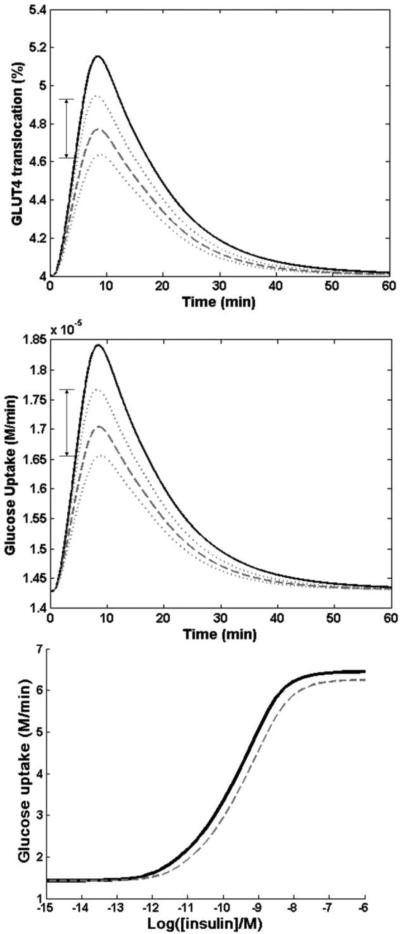
Mathematical models of biological pathways facilitate a systems biology approach to medicine. However, these models need to be updated to reflect the latest available knowledge of the underlying pathways. We developed a mathematical model of the insulin signal transduction pathway by expanding the last major previously reported model and incorporating pathway components elucidated since the original model was reported. Furthermore, we show that inputting gene expression data of key components of the insulin signal transduction pathway leads to sensible predictions of glucose clearance rates in agreement with reported clinical measurements. In one set of simulations, our model predicted that glycerol kinase knockout mice have reduced GLUT4 translocation, and consequently, reduced glucose uptake. Additionally, a comparison of our extended model with the original model showed that the added pathway components improve simulations of glucose clearance rates. We anticipate this expanded model to be a useful tool for predicting insulin sensitivity in mammalian tissues with altered expression protein phosphorylation or mRNA levels of insulin signal transduction pathway components.
Keywords: Insulin sensitivity; Insulin signal transduction pathway; Mathematical modeling.
Copyright © 2014 Elsevier Inc. All rights reserved.
Figures
References
-
- Leto D, Saltiel AR. Regulation of glucose transport by insulin: traffic control of GLUT4. Nat Rev Mol Cell Biol. 2012;13:383–396. - PubMed
-
- Chen L, Magliano DJ, Zimmet PZ. The worldwide epidemiology of type 2 diabetes mellitus--present and future perspectives. Nat Rev Endocrinol. 2012;8:228–236. - PubMed
-
- Sedaghat AR, Sherman A, Quon MJ. A mathematical model of metabolic insulin signaling pathways. Am J Physiol Endocrinol Metab. 2002;283:E1084–1101. - PubMed
-
- Chew YH, Shia YL, Lee CT, Majid FA, Chua LS, Sarmidi MR, Aziz RA. Modeling of glucose regulation and insulin-signaling pathways. Mol Cell Endocrinol. 2009;303:13–24. - PubMed
Publication types
MeSH terms
Substances
Grants and funding
LinkOut - more resources
Full Text Sources
Other Literature Sources
Medical
