. 2015 Jan 16;290(3):1505-21.
doi: 10.1074/jbc.M114.607465. Epub 2014 Dec 2.

Characterization of Cav1.4 complexes (α11.4, β2, and α2δ4) in HEK293T cells and in the retina

Affiliations

Characterization of Cav1.4 complexes (α11.4, β2, and α2δ4) in HEK293T cells and in the retina

Amy Lee et al. J Biol Chem. .

Abstract

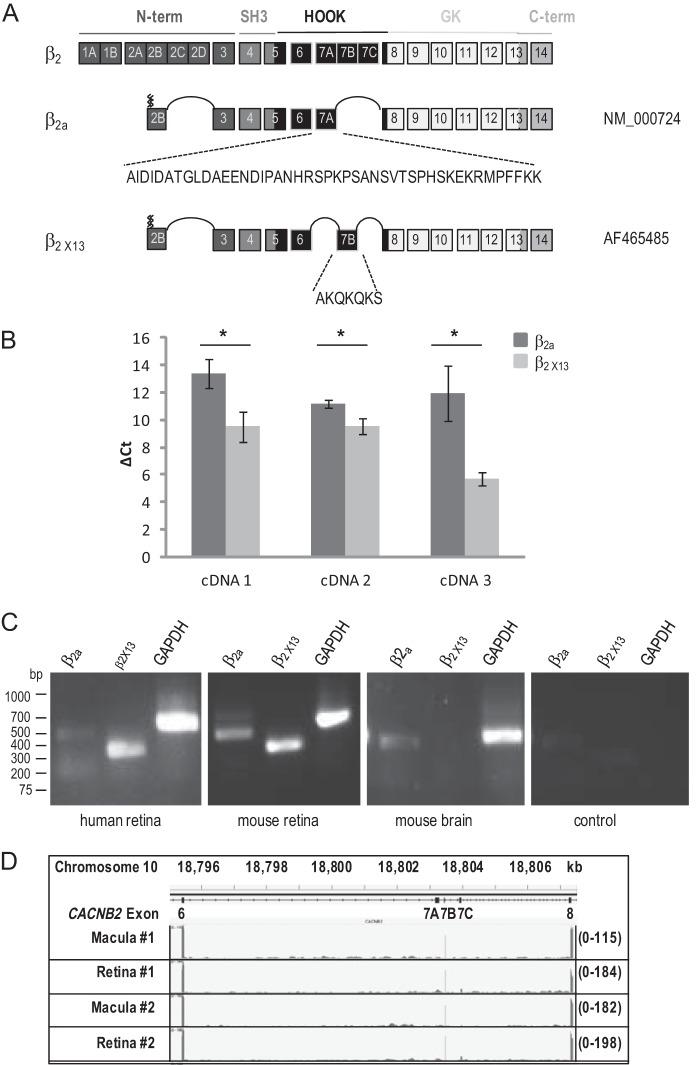
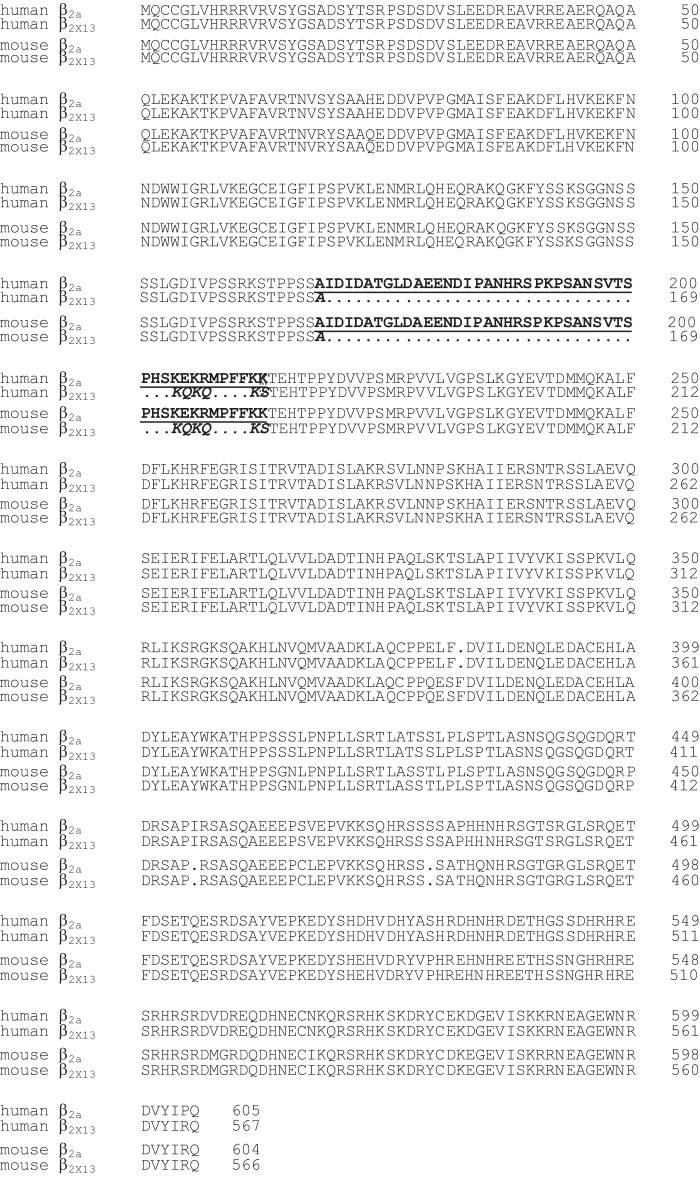
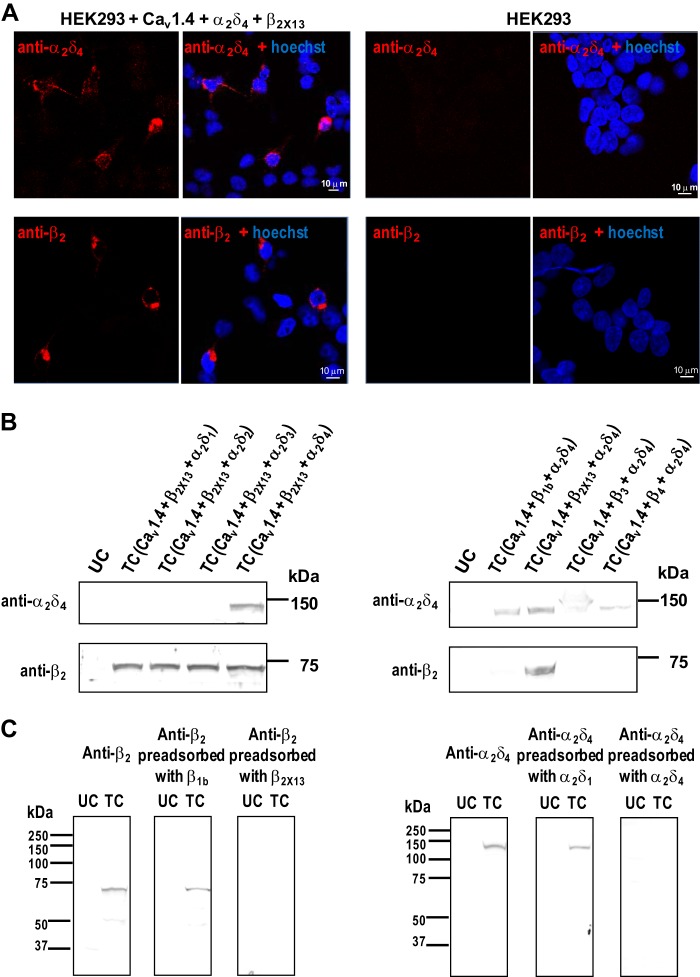
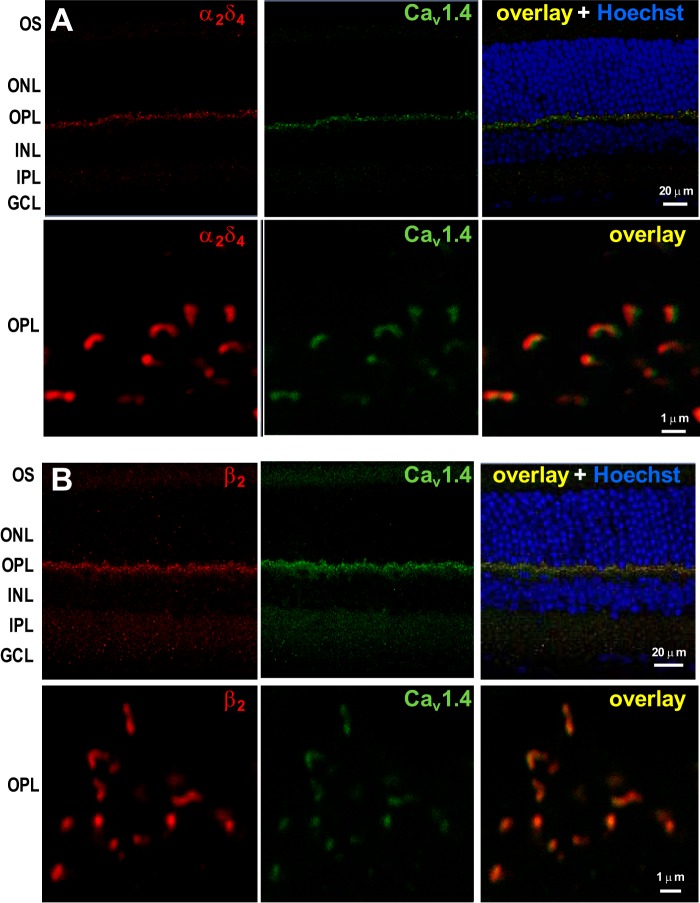
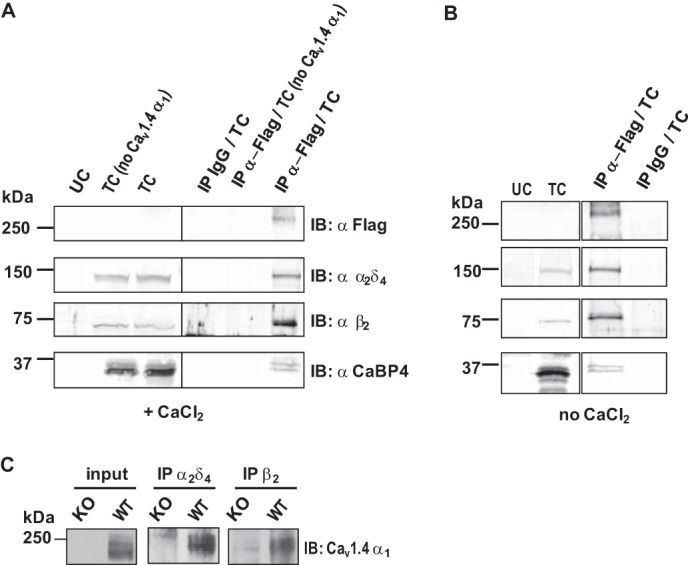
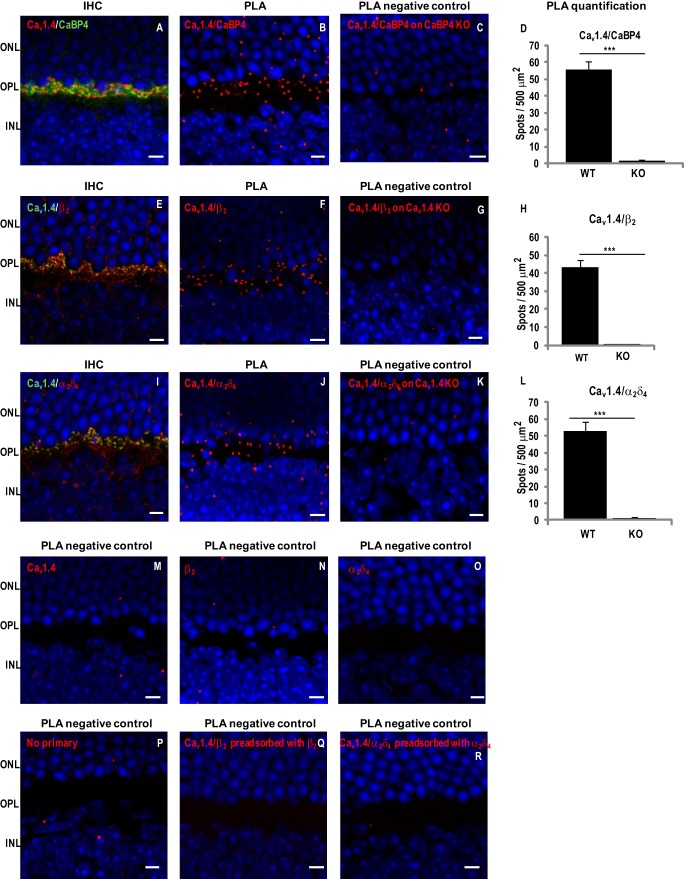
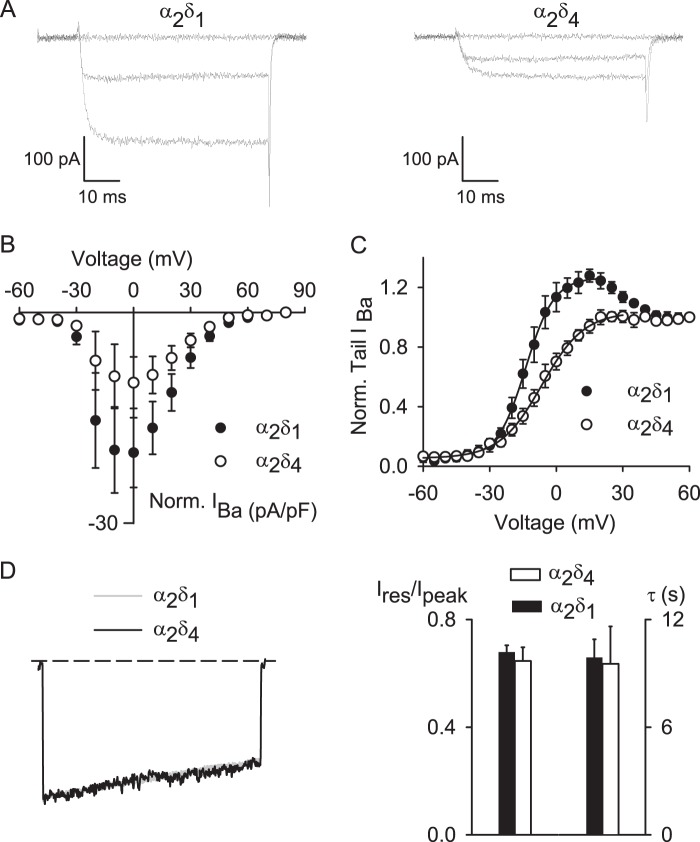
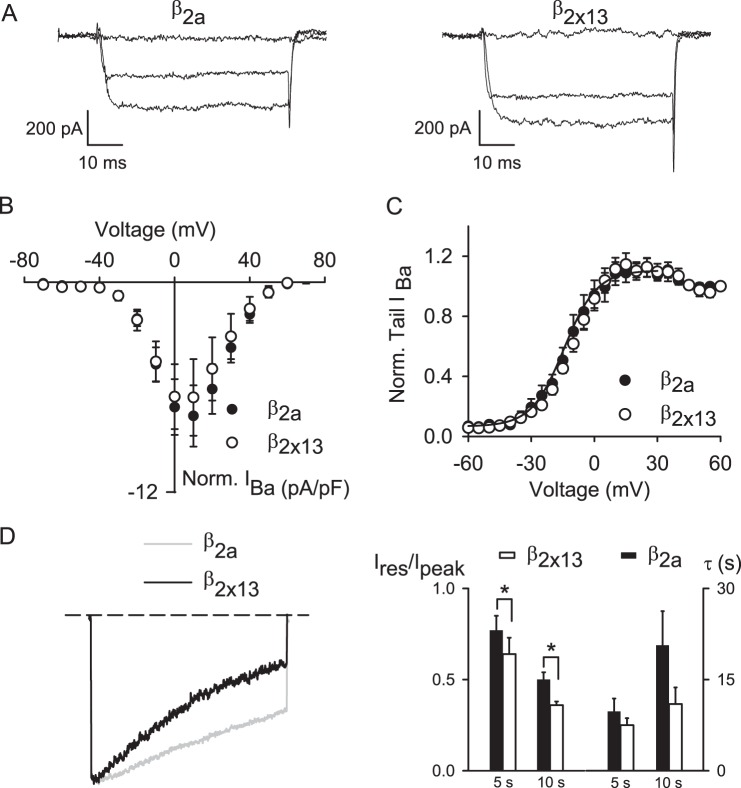
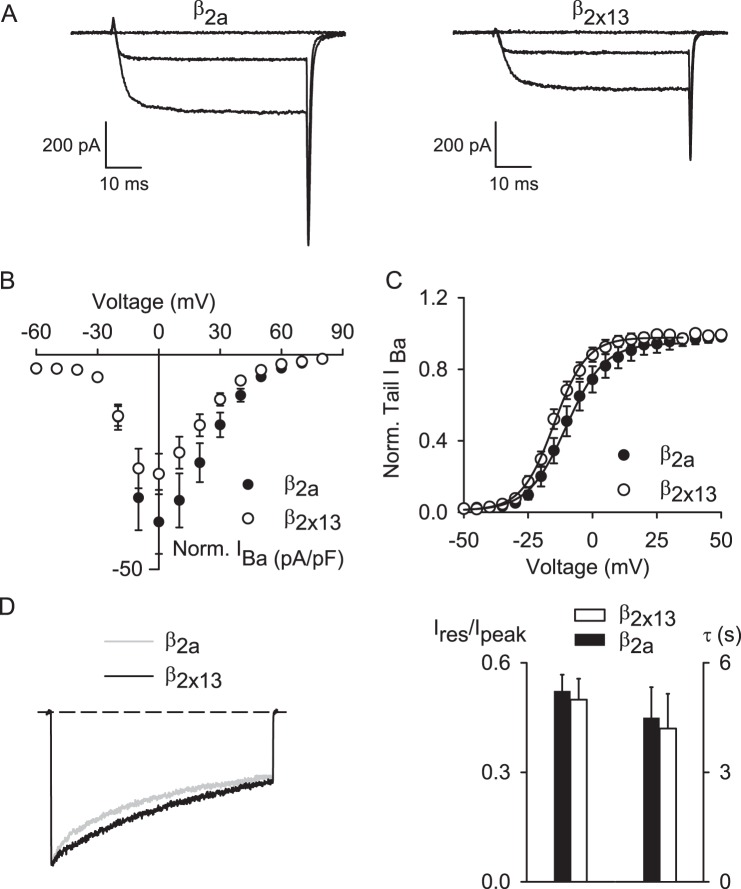
In photoreceptor synaptic terminals, voltage-gated Cav1.4 channels mediate Ca(2+) signals required for transmission of visual stimuli. Like other high voltage-activated Cav channels, Cav1.4 channels are composed of a main pore-forming Cav1.4 α1 subunit and auxiliary β and α2δ subunits. Of the four distinct classes of β and α2δ, β2 and α2δ4 are thought to co-assemble with Cav1.4 α1 subunits in photoreceptors. However, an understanding of the functional properties of this combination of Cav subunits is lacking. Here, we provide evidence that Cav1.4 α1, β2, and α2δ4 contribute to Cav1.4 channel complexes in the retina and describe their properties in electrophysiological recordings. In addition, we identified a variant of β2, named here β2X13, which, along with β2a, is present in photoreceptor terminals. Cav1.4 α1, β2, and α2δ4 were coimmunoprecipitated from lysates of transfected HEK293 cells and mouse retina and were found to interact in the outer plexiform layer of the retina containing the photoreceptor synaptic terminals, by proximity ligation assays. In whole-cell patch clamp recordings of transfected HEK293T cells, channels (Cav1.4 α1 + β2X13) containing α2δ4 exhibited weaker voltage-dependent activation than those with α2δ1. Moreover, compared with channels (Cav1.4 α1 + α2δ4) with β2a, β2X13-containing channels exhibited greater voltage-dependent inactivation. The latter effect was specific to Cav1.4 because it was not seen for Cav1.2 channels. Our results provide the first detailed functional analysis of the Cav1.4 subunits that form native photoreceptor Cav1.4 channels and indicate potential heterogeneity in these channels conferred by β2a and β2X13 variants.

Keywords: Calcium Channel; Calcium-binding Protein; Electrophysiology; Immunohistochemistry; Photoreceptor; Retina.


Figures

FIGURE 1.
FIGURE 1.
Cloning and expression of retinal β2X13 variant. A, schematic of the human CACNB2 gene with exon numbering according to Buraei and Yang (1). Alternatively spliced exons 1, 2, and 7 are linked and denoted by letters. The different domains are indicated: N-terminal (N-term), Src homology 3 (SH3), HOOK, guanylyl kinase (GK), and C-terminal (C-term). GenBankTM accession numbers are indicated on the right. The distinct peptide sequence encoded by exon 7A in β2a and exon 7B in β2X13 is indicated. The zig zag lines indicate the palmitoylation sites at the N terminus. B, qPCR analysis of β2a and β2X13 expression in human retina. Values represent mean ΔCt values (Ct values for β2a and β2X13 normalized to the Ct values for the internal standard GAPDH) for all cDNA preparations (1–3). Error bars, S.D. (*, p ≤ 0.015, unpaired t test, n = 3). C, RT-PCR analysis of β2a and β2X13 expression in human and mouse tissue. For human cDNA, primers were the same as those used in B and Table 1. For mouse cDNA, primers were designed on exon 7A and exon 10 (for β2a) or on exon 7B and exon 10 (for β2X13). D, profile of RNA-seq reads from human macula or peripheral retina mapped to exon 6 to exon 8 of the CACNB2 gene. The numbers between parentheses on the right indicate the scale. The location of exon 6 to exon 8 from 18,795.363 to 18,807.311 kb on chromosome 11 is shown at the top.
FIGURE 2.
FIGURE 2.
Alignment of human β2a and β2X13 amino acid sequences with mouse β2a and mouse β2X13. Cloning of the β2X13 cDNAs is described in the “Experimental Procedures.” The aligned amino acid sequences are derived from GenBankTM accession number AF423189.1 for human β2A, AF465485_1 for human β2X13, XM_006497320.1 for mouse β2a, and KJ789960 for mouse β2X13. Similarly to the human β2X13 retinal subunit, the mouse retinal β2X13 also includes the shorter exon 7B shown in boldface italic letters instead of exon 7A indicated in boldface underlined letters.
FIGURE 3.
FIGURE 3.
Characterization of polyclonal antibodies against β2 and α2δ4. A, immunolabeling of HEK293 cells cotransfected with Cav1.4 α1, β2X13, and α2δ4 (left panels) or untransfected cells (right panels) with rat anti-β2 or rat anti-α2δ4. B, Western blot of lysates of HEK293 cells untransfected (UC) or cotransfected (TC) with Cav1.4 α1, β2X13 and α2δ1, α2δ2, α2δ3, or α2δ4 (left) or cotransfected with Cav1.4 α1, α2δ4, and β1b, β2X13, β3, or β4 (right). Blots were probed with anti-α2δ4 or anti-β2, respectively. C, Western blot of lysates of HEK293 cells untransfected (UC) or cotransfected (TC) with Cav1.4 α1, β2X13, and α2δ4 and probed with anti-β2, anti-β2 preadsorbed with specific β2X13 or nonspecific β1b (left), or anti-α2δ4, or anti-α2δ4 preadsorbed with specific α2δ4 or nonspecific α2δ1 (right). Immunoreactivity was blocked by preadsorption with specific antigen only.
FIGURE 4.
FIGURE 4.
Colocalization of Cav1.4 α1 with β2 or α2δ4 at the photoreceptor synaptic ribbon. Mouse retina sections were double-labeled with anti-Cav1.4 α1 (green) and anti-α2δ4 (red) (A) or anti-β2 (red) (B). The overlay is shown in the right panel together with Hoechst staining. Higher magnification images of the OPL are shown in the bottom panels. Cav1.4 shows a high degree of colocalization with β2 and α2δ4, as indicated by the calculated Pearson's correlation coefficient between the Alexa 488-stained Cav1.4 and the Alexa 555-stained β2 (r ≥ 0.710) or α2δ4 (r ≥ 0.608). OS, outer segment; INL, inner nuclear layer; IPL, inner plexiform layer; GCL, ganglion cell layer.
FIGURE 5.
FIGURE 5.
Isolation of Cav1.4 α11-β22δ4 complexes from cotransfected HEK293 cells and mouse retina. A and B, Cav1.4 α1 interacts with β2X13, α2δ4, and CaBP4 expressed in HEK293 cells. Coimmunoprecipitations were performed with control mouse IgG or anti-FLAG antibody using lysates of HEK293 cells untransfected (UC) or cotransfected (TC) with β2X13, α2δ4, and CaBP4 with or without (no Cav1.4) FLAG-Cav1.4 α1. Experiments were performed in the presence (A) or in the absence of 0.1 mm Ca2+ (B). Western blotting (IB) was with anti-FLAG, anti-β2, anti-α2δ4, or anti-CaBP4. Left panels show input lysates. Right panels show coimmunoprecipitated (IP) proteins. Results shown are representative of three experiments. C, Cav1.4 α1 interacts with β2 and α2δ4 in mouse retina. Coimmunoprecipitations were performed using lysates from WT or KO Cav1.4 α1 mouse retina with anti-α2δ4 or anti-β2 antibodies. Anti-Cav1.4 α1 antibody was used for Western blotting. 8% of lysate was used for input.
FIGURE 6.
FIGURE 6.
Cav1.4 α1 interacts with CaBP4, β2 and α2δ4 in mouse retina. Immunohistochemistry (IHC) or PLAs were performed in sections of WT or knock-out mouse retina using anti-Cav1.4 α1 and anti-CaBP4 (A–D), anti-Cav1.4 α1 and anti-β2 (E–H), anti-Cav1.4 α1 and anti-α2δ4 (I–L), anti-Cav1.4 (M), anti-β2 (N), anti-α2δ4 (O), no primary antibodies (P), anti-β2 preadsorbed with β2a (Q), or anti-α2δ4 preadsorbed with α2δ4 (R). For IHC, WT mouse retina sections were double-labeled with anti-Cav1.4 α1 (red) and in green anti-CaBP4 (A), anti-Cav1.4 α1 (green) and in red anti-β2 (E), or anti-α2δ4 (I). INL, inner nuclear layer. PLA was performed on retina from WT (B, F, J, and M–R), CaBP4 KO (C), or Cav1.4 KO (G and K) mice. Sites of protein interaction are visualized as red spots. Quantification of PLA spots are shown as mean ± S.E. (error bars) for Cav1.4/CaBP4 in WT (n = 7) versus CaBP4 KO mice (n = 3) (p < 0.001; Student's t test) (D), for Cav1.4-β2 in WT (n = 7) versus Cav1.4 KO mice (n = 3) (p < 0.001) (H), and for Cav1.4-α2δ4 in WT (n = 6) versus Cav1.4 KO mice (n = 3) (p < 0.001) (L). For all images, nuclei are labeled with Hoechst. Scale bar, 5 μm.
FIGURE 7.
FIGURE 7.
Differential modulation of Cav1.4 properties by α2δ1 and α2δ4. A and B, Ba2+ currents (IBa) were evoked by 50-ms depolarizations from a holding voltage of −80 mV in HEK293T cells transfected with Cav1.4 containing α2δ1 (n = 8) or α2δ4 (n = 9) and β2X13. A, representative IBa traces during a 50-ms depolarization to −70, 0, and +30 mV. B, current-voltage (I-V) plots for data obtained as in A. C, tail currents were evoked after 20-ms depolarization to various voltages from a holding voltage of −80 mV and repolarization to −60 mV. Tail currents were normalized to that obtained after a +80-mV pulse and plotted against test voltage. D, inactivation of IBa evoked by 5-s pulses from −80 to 0 mV. Left, representative traces. Right, inactivation was measured by dividing residual current amplitude (Ires) by the peak amplitude (Ipeak) in cells transfected with Cav1.4 containing α2δ1 (n = 5) or α2δ4 (n = 6), p = 0.59, by Student's t test. The time constant, τ, was obtained by fitting IBa decay with a single exponential function and was not different for α2δ1 and α2δ4; p = 0.88, Student's t test. Error bars, S.E.
FIGURE 8.
FIGURE 8.
Differential modulation of Cav1.4 properties by β2a and β2X13. A–C, same as in Fig. 7 except for Cav1.4 containing β2a (n = 10) or β2X13 (n = 10) and α2δ4. D, same as in Fig. 7D except for Cav1.4 containing β2a (n = 7) or β2X13 (n = 7), and IBa was evoked by either 5- or 10-s pulses from −80 to +10 mV. Left, representative traces are evoked by 10-s pulses. Right, Ires/Ipeak (*, p = 0.01 for 5-s pulses; p = 0.04 for 10-s pulses, by Student's t test) and τ (p = 0.32 for 5-s pulses, whereas p = 0.16 for 10-s pulses by Student's t test). Error bars, S.E.
FIGURE 9.
FIGURE 9.
Unlike their distinct effects on Cav1.4, β2a and β2X13 do not differentially modulate Cav1.2 inactivation. A–C, same as in Fig. 7 except for Cav1.2 channels containing β2a (n = 10) or β2X13 (n = 10) and α2δ4. D, same as in Fig. 7D except for Cav1.2 containing β2a (n = 9) or β2X13 (n = 9), and IBa was evoked by 5-s pulses from −80 to 0 mV. Left, representative traces are evoked by 5-s pulses. Right, Ires/Ipeak (*, p = 0.75, by Student's t test) and τ (p = 0.81 by Student's t test). Error bars, S.E.

Similar articles

Cited by

References

    1. Buraei Z., Yang J. (2010) The β subunit of voltage-gated Ca2+ channels. Physiol. Rev. 90, 1461–1506 - PMC - PubMed
    1. Dolphin A. C. (2012) Calcium channel auxiliary α2δ and β subunits: trafficking and one step beyond. Nat. Rev. Neurosci. 13, 542–555 - PubMed
    1. Dolphin A. C. (2013) The α2δ subunits of voltage-gated calcium channels. Biochim. Biophys. Acta 1828, 1541–1549 - PubMed
    1. Simms B. A., Zamponi G. W. (2014) Neuronal voltage-gated calcium channels: structure, function, and dysfunction. Neuron 82, 24–45 - PubMed
    1. Catterall W. A. (2000) Structure and regulation of voltage-gated Ca2+ channels. Annu. Rev. Cell Dev. Biol. 16, 521–555 - PubMed

Publication types

Associated data

LinkOut - more resources