

Bulk RNA degradation by nitrogen starvation-induced autophagy in yeast
- PMID: 25468960
- PMCID: PMC4337068
- DOI: 10.15252/embj.201489083
Bulk RNA degradation by nitrogen starvation-induced autophagy in yeast
Abstract
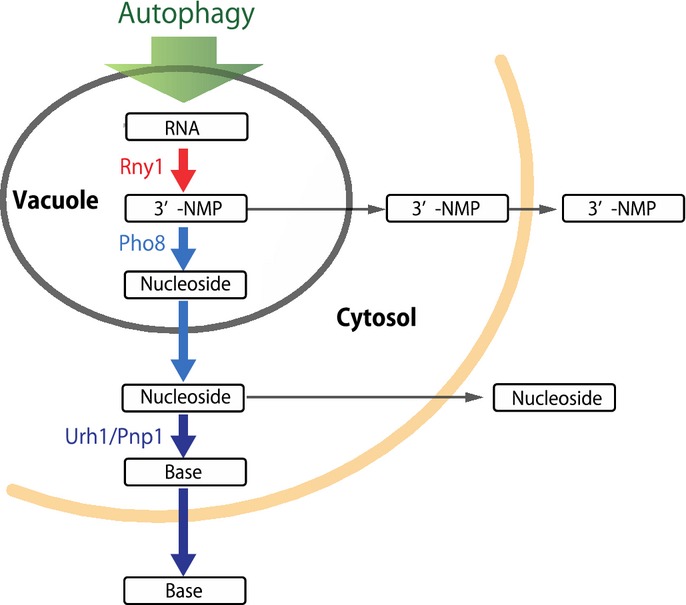
Autophagy is a catabolic process conserved among eukaryotes. Under nutrient starvation, a portion of the cytoplasm is non-selectively sequestered into autophagosomes. Consequently, ribosomes are delivered to the vacuole/lysosome for destruction, but the precise mechanism of autophagic RNA degradation and its physiological implications for cellular metabolism remain unknown. We characterized autophagy-dependent RNA catabolism using a combination of metabolome and molecular biological analyses in yeast. RNA delivered to the vacuole was processed by Rny1, a T2-type ribonuclease, generating 3'-NMPs that were immediately converted to nucleosides by the vacuolar non-specific phosphatase Pho8. In the cytoplasm, these nucleosides were broken down by the nucleosidases Pnp1 and Urh1. Most of the resultant bases were not re-assimilated, but excreted from the cell. Bulk non-selective autophagy causes drastic perturbation of metabolism, which must be minimized to maintain intracellular homeostasis.
Keywords: RNA degradation; autophagy; metabolome analysis; ribosome; vacuole.
© 2014 The Authors.
Figures
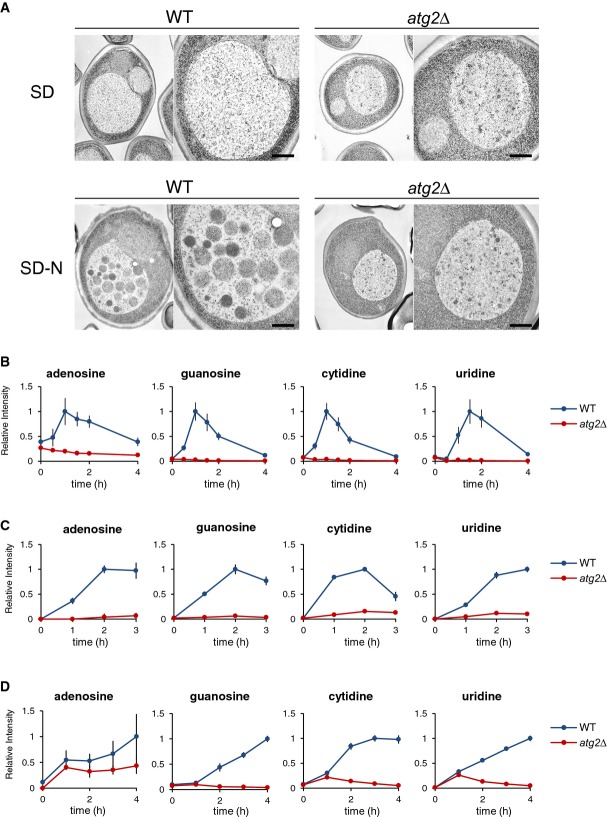
A Electron microscopic analyses to see autophagic bodies in the vacuoles under both growth and nitrogen starvation conditions. Autophagic bodies typically contain cytosolic ribosomes. pep4Δprb1Δ and pep4Δprb1Δatg2Δ cells were grown in SD to mid-log phase (OD600 = 1) and transferred to SD(-N) for 5 h. The cells were examined by transmission electron microscopy as described in Materials and Methods. Scale bar, 500 nm.
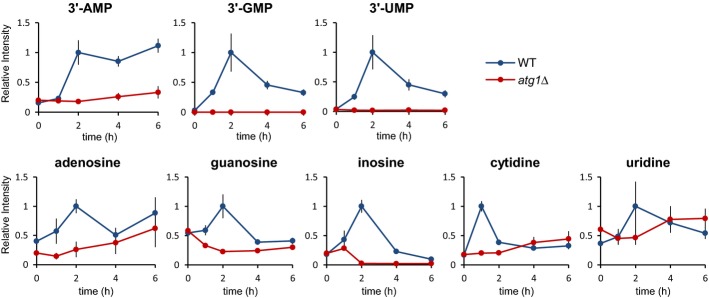
B–D Time-dependent changes in nucleoside contents under nitrogen starvation (B), rapamycin treatment (C), and carbon starvation (D) conditions. Wild-type and atg2Δ cells were grown in SD and transferred to SD(-N), SD medium with 0.2 μM rapamycin, or SD(-C) at time 0. At the indicated time points, nucleosides were analyzed by LC/MS as described in Materials and Methods. Results are presented as normalized intensities on the basis of peak height of each metabolite in wild-type cells. All data are means of triplicate samples. The error bars represent the standard deviation.
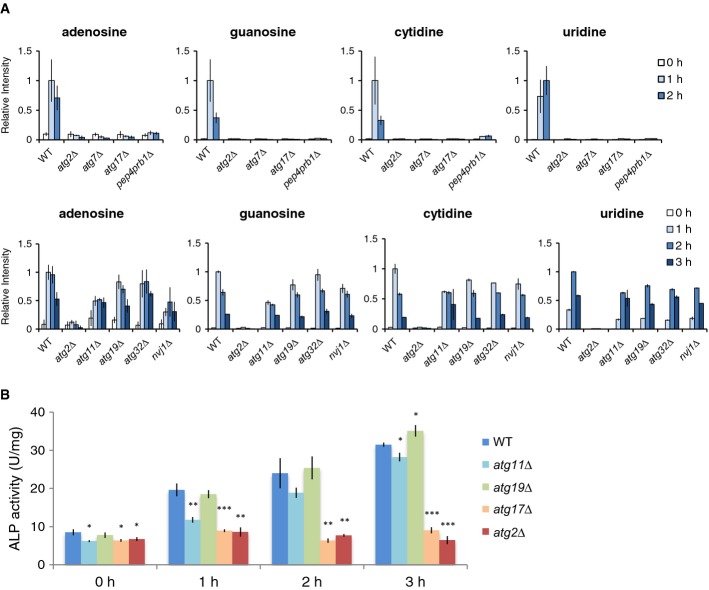
Time-dependent changes in nucleoside contents under nitrogen starvation. Nucleosides in wild-type, atg2Δ, atg7Δ, atg11Δ, atg17Δ, atg19Δ, atg32Δ, nvj1Δ, and pep4prb1Δ cells under nitrogen starvation. All data are means of triplicates. The error bars represent the standard deviation.
Alkaline phosphatase (ALP) assay (Pho8Δ60). Wild-type, atg2Δ,atg11Δ, atg17Δ, and atg19Δ cells expressing Pho8Δ60 were grown in SD to mid-log phase and transferred to SD(-N) at time 0. At the indicated time points, lysates were prepared and subjected to the ALP assay. The bars represent the standard deviation of three independent experiments. *P < 0.05; **P < 0.005; ***P < 0.0005 (paired t-test, two-tailed)
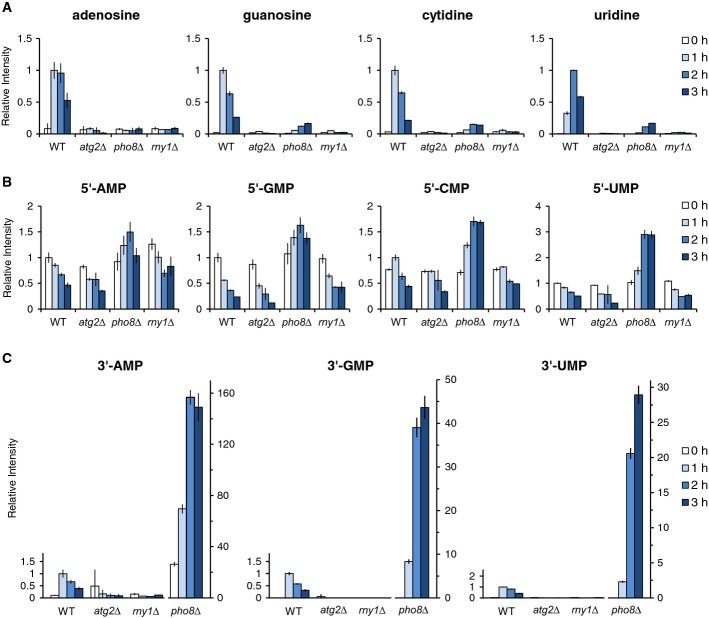
A–C Wild-type, atg2Δ, pho8Δ, and rny1Δ cells were grown in SD to mid-log phase and transferred to SD(-N) at time 0. At the indicated time points, nucleosides (A), 5′-NMPs (B), and 3′-NMPs (C) were analyzed by LC/MS as described in Materials and Methods. The results are presented as normalized intensities on the basis of the peak height of each metabolite in wild-type cells. Note that 3′-NMPs in pho8Δ are presented in a different scale. All data are means of triplicates. The error bars represent the standard deviation.
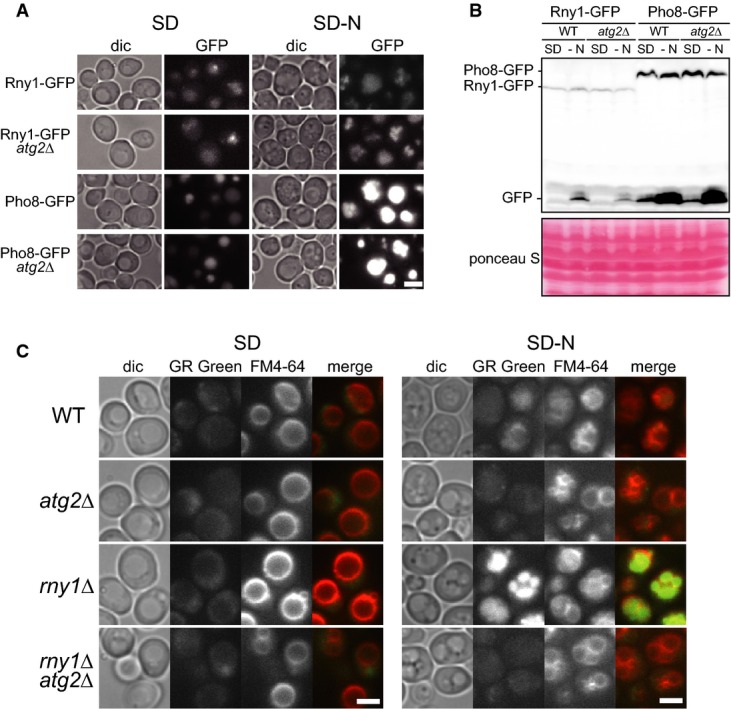
A, B Expression and localization of Rny1 and Pho8. Wild-type cells and atg2Δ cells expressing Rny1-GFP or Pho8-GFP were grown in SD to mid-log phase and transferred to SD(-N). After 2 h of starvation, GFP-tagged proteins were observed by fluorescence microscopy (A) or analyzed by Western blot with anti-GFP antibody (B). Scale bar, 5 μm.
C Detection of free RNA. Wild-type, atg2Δ, rny1Δ, and rny1Δatg2Δ cells grown in SD (left) or SD(-N) for 2 h (right) were stained with FM4-64 and GR Green and observed under a fluorescence microscope. Scale bar, 5 μm.
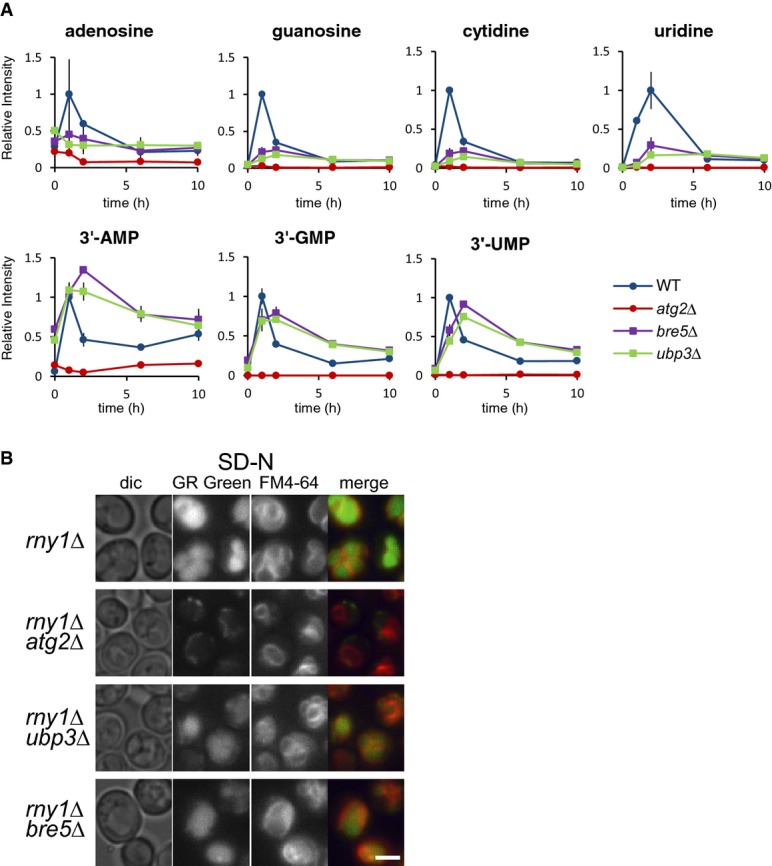
Time-dependent change in nucleoside levels after nitrogen starvation. Wild-type, atg2Δ, ubp3Δ, and bre5Δ cells were grown in SD to mid-log phase and transferred to SD(-N) at time 0. Metabolites were analyzed by LC/MS as described in Materials and Methods. The results are presented as normalized intensities on the basis of the peak height of each metabolite in wild-type cells. All data are means of triplicates. The error bars represent the standard deviation.
Detection of free RNA within cells. rny1Δ, rny1Δatg2Δ, rny1Δubp3Δ, and rny1Δbre5Δ cells grown in SD(-N) for 2 h were stained with FM4-64 and GR Green and observed under a fluorescence microscope. Scale bar, 5 μm.
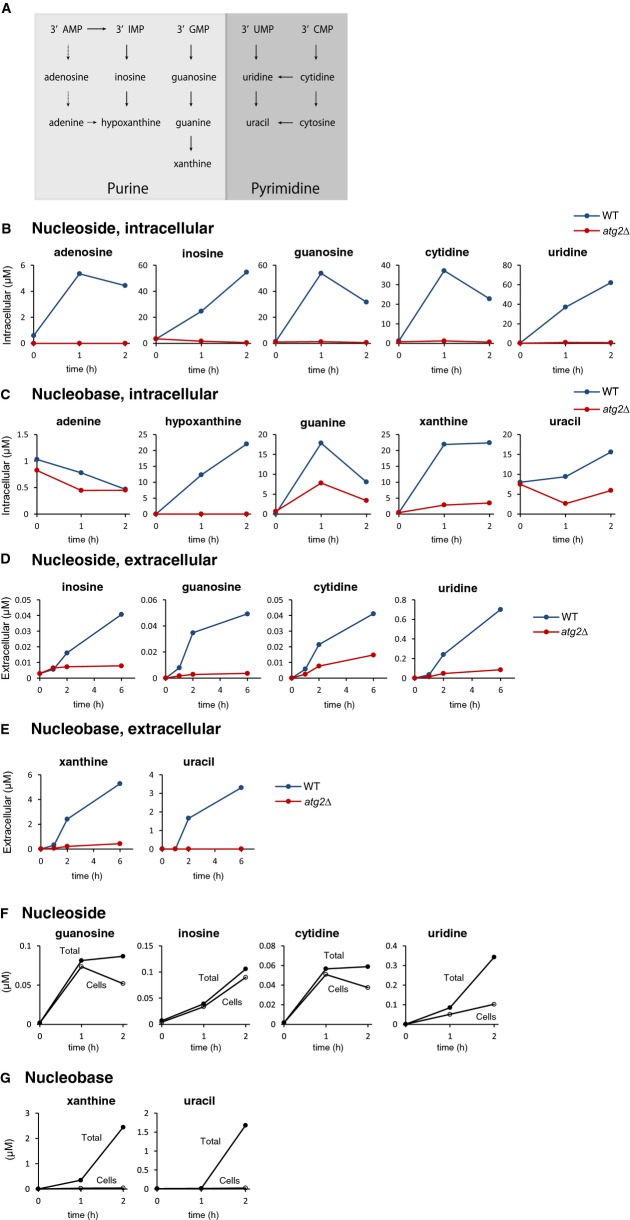
A Schematic representation of reactions of the nucleotide degradation pathway.
B, C Nucleosides (B) and nucleobases (C) within the cells. Wild-type and atg2Δ were grown in SD to mid-log phase and transferred to SD(-N) at time 0. At the indicated time points, the cells were collected; their metabolites were extracted, and the nucleosides and nucleobases were analyzed by LC/MS. The level of each nucleoside and base is presented as its absolute concentration, as described in Materials and Methods and Supplementary Methods. All data are means of duplicates except the wild-type strain at 1 h.
D, E Nucleosides (D) and nucleobases (E) in the medium. The culture medium of the above cultures was filtered, and nucleosides and nucleobases were directly analyzed by LC/MS as described in Materials and Methods and Supplementary Methods. All data are means of duplicates.
F, G Destinations of nucleosides and bases. Based on the data from (B–E), the level of each nucleoside and base in cells (open circle) and in cells and medium (closed circle) of wild-type strain were estimated. See Supplementary Methods in detail (flow chart of the calculation procedure).
Comment in
-
Autophagy mediates nonselective RNA degradation in starving yeast.EMBO J. 2015 Jan 13;34(2):131-3. doi: 10.15252/embj.201490621. Epub 2014 Dec 9. EMBO J. 2015. PMID: 25492883 Free PMC article.
References
-
- Bligh EG, Dyer WJ. A rapid method of total lipid extraction and purification. Can J Biochem Physiol. 1959;37:911–917. - PubMed
-
- Campomenosi P, Salis S, Lindqvist C, Mariani D, Nordstrom T, Acquati F, Taramelli R. Characterization of RNASET2, the first human member of the Rh/T2/S family of glycoproteins. Arch Biochem Biophys. 2006;449:17–26. - PubMed
-
- Cohen M, Stutz F, Belgareh N, Haguenauer-Tsapis R, Dargemont C. Ubp3 requires a cofactor, Bre5, to specifically de-ubiquitinate the COPII protein, Sec23. Nat Cell Biol. 2003;5:661–667. - PubMed
-
- Donella-Deana A, Ostojic S, Pinna LA, Barbaric S. Specific dephosphorylation of phosphopeptides by the yeast alkaline phosphatase encoded by PHO8 gene. Biochim Biophys Acta. 1993;1177:221–228. - PubMed
Publication types
MeSH terms
Substances
LinkOut - more resources
Full Text Sources
Other Literature Sources
Molecular Biology Databases
