. 2014 Sep;24(5):459-74.
doi: 10.1111/bpa.12129. Epub 2014 Feb 28.

A reproducible and translatable model of focal ischemia in the visual cortex of infant and adult marmoset monkeys

Affiliations

A reproducible and translatable model of focal ischemia in the visual cortex of infant and adult marmoset monkeys

Leon Teo et al. Brain Pathol. 2014 Sep.

Abstract

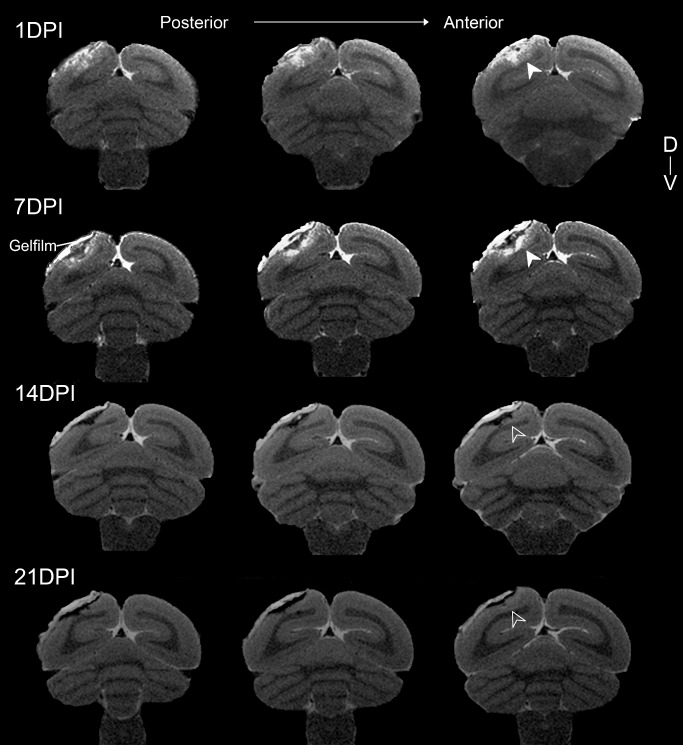
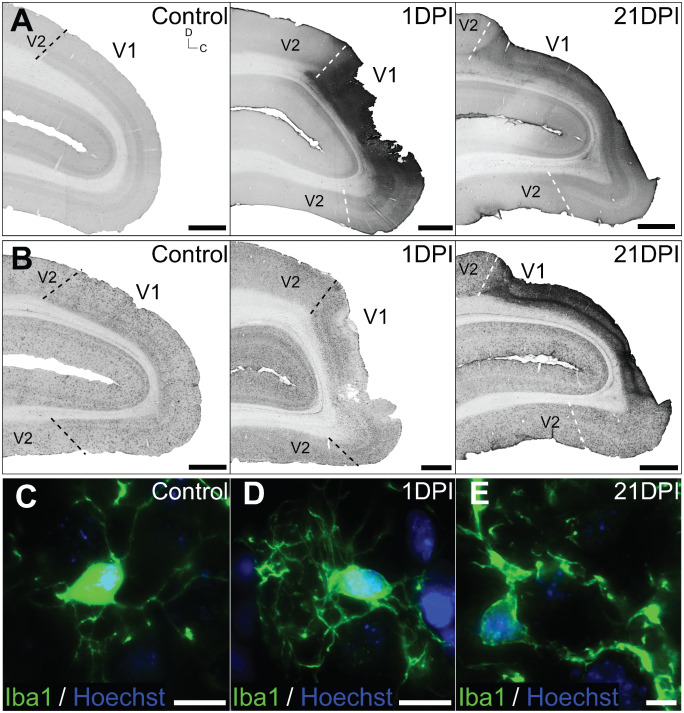
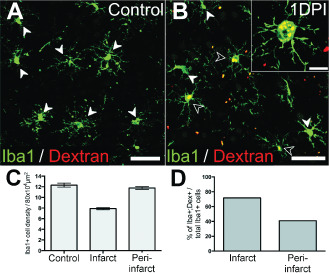
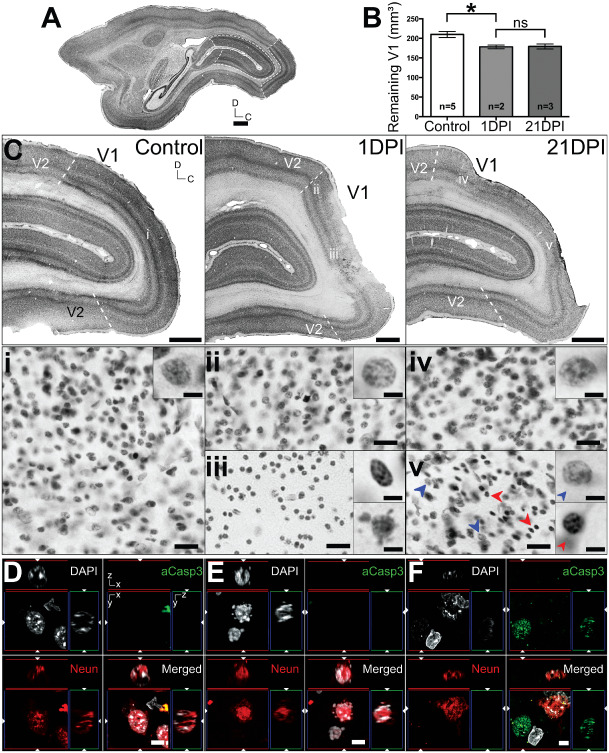
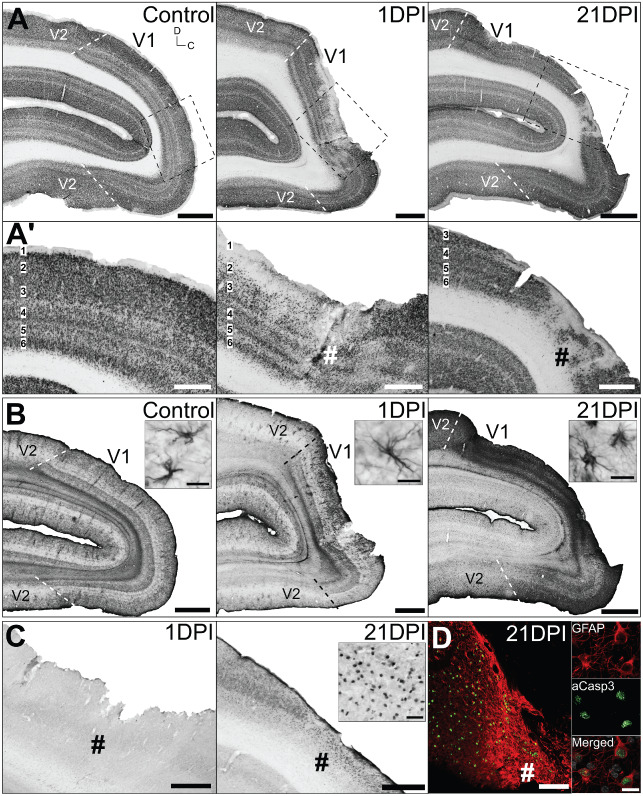
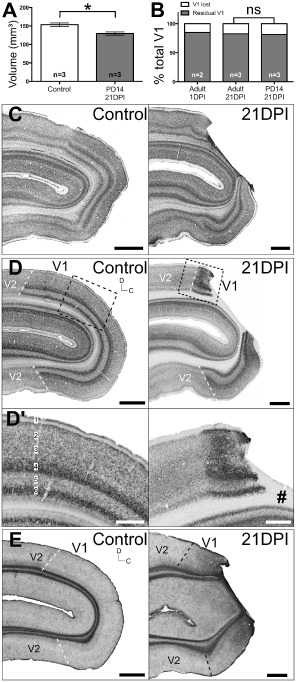
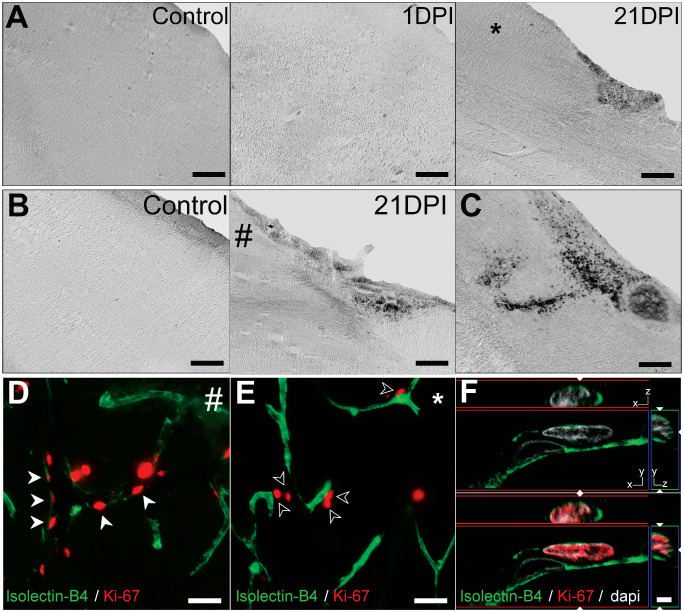
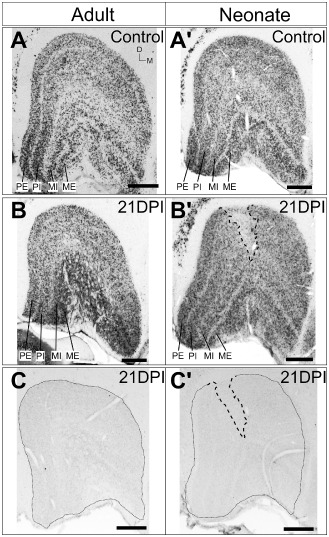
Models of ischemic brain injury in the nonhuman primate (NHP) are advantageous for investigating mechanisms of central nervous system (CNS) injuries and testing of new therapeutic strategies. However, issues of reproducibility and survivability persist in NHP models of CNS injuries. Furthermore, there are currently no pediatric NHP models of ischemic brain injury. Therefore, we have developed a NHP model of cortical focal ischemia that is highly reproducible throughout life to enable better understanding of downstream consequences of injury. Posterior cerebral arterial occlusion was induced through intracortical injections of endothelin-1 in adult (n = 5) and neonatal (n = 3) marmosets, followed by magnetic resonance imaging (MRI), histology and immunohistochemistry. MRI revealed tissue hyperintensity at the lesion site at 1-7 days followed by isointensity at 14-21 days. Peripheral macrophage and serum albumin infiltration was detected at 1 day, persisting at 21 days. The proportional loss of total V1 as a result of infarction was consistent in adults and neonates. Minor hemorrhagic transformation was detected at 21 days at the lesion core, while neovascularization was detected in neonates, but not in adults. We have developed a highly reproducible and survivable model of focal ischemia in the adult and neonatal marmoset primary visual cortex, demonstrating similar downstream anatomical and cellular pathology to those observed in post-ischemic humans.

Keywords: MRI; cerebral ischemia; endothelin‐1; neural degeneration; primary visual cortex; primate.


Conflict of interest statement

None.

Figures

Figure 1
Figure 1
Intracortical injection of endothelin‐1 ( ET ‐1) proximal to the calcarine artery results in transient arterial occlusion. (A) Schematic illustration of the marmoset visual system. Visual representation in operculum V1 (red) corresponds to 0–3° (foveal) of the contralateral visual hemifield. (B) Schematic representation of the adult marmoset cranium in lateral and dorsal views. Craniotomies were created on the occipital pole of the cranium (shaded grey). The base of the craniotomy extends parallel and ∼2 mm lateral to the midline, from interaural −7 mm to −12 mm. The apex lies ∼7 mm lateral to the midline. (C) Red arrow denotes the calcarine artery (P4 branch of the posterior cerebral artery, PCAca) on the occipital pole of the marmoset brain. Dashed line outlines approximate operculum V1 area. (DF). Time‐lapsed images demonstrating the PCAca before ET‐1 injections (D), ongoing arterial occlusion (E) and subsequent reperfusion (F). *Denotes injection sites. Empty arrows denote sites of occlusion and black arrows denote corresponding regions during reperfusion. (G) Anatomical overview of the occipital pole at 21 days post ischemia (DPI) after focal ischemia revealed a discrete lesion site localized to the occipital pole of the marmoset brain (outlined by dotted line) consistent with operculum V1. Orientation markers: D = dorsal; V = ventral; R = rostral; C = caudal; L = lateral; M = medial. Scale: (B) 5 mm, (C, G) 2.5 mm.
Figure 2
Figure 2
Establishing pathological time‐course of infarct development after focal ischemia throughin vivomagnetic resonance imaging. Series of adjacent T2‐weighted images of the post‐ischemic marmoset brain proximal to the infarct site. Slices are 6 mm apart and obtained at 1, 7, 14 and 21 days post ischemia (DPI). T2 hyperintensity was observed at 1, 7 DPI (white arrowheads) indicating the location and extent of injury caused by arterial occlusion. Demarcation of the lesion core was most pronounced at 7 DPI, characterized by T2 hyperintensity, indicative of infarction and localized edema, and a clearly defined void most likely the result of necrotic tissue loss. T2 normalization in previously hyperintense regions was observed at 14 and 21 DPI (empty arrowheads).
Figure 3
Figure 3
Inflammatory responses and blood–brain barrier ( BBB ) permeability after focal ischemia. Parasagittal sections of control, 1 and 21 days post ischemia (DPI) marmoset V1 immunolabeled for (A) serum albumin and (B) macrophage‐specific Iba1. (A) Serum albumin levels was markedly increased at 1 DPI, compared with controls, and remained elevated at 21 DPI. (B) No obvious difference in Iba1+ macrophage expression intensity or cellular distribution was detected at 1 DPI. However the density of Iba1+ immunolabeling was markedly more intense at 21 DPI, indicating ongoing microgliotic activity. Iba1+ macrophage morphology remained at resting state (C, D; ramified, long and thin processes) at 1 DPI, but was observed to be phagocytic (E; hypertrophic, thick processes) at 21 DPI. Dashed lines denote V1–V2 boundaries demarcated using adjacent Nissl‐stained sections. Scale: (A, B) 2 mm, (CE) 20 μm.
Figure 4
Figure 4
Infiltration of peripheral macrophages in the acute post‐ischemic period.Iba1+/dextran+ peripheral macrophages were detected in brain tissues proximal to lesion site at 1 days post ischemia (DPI) (B; enlarged in insert), but not in controls (A). White arrowheads denote Iba1+/dextran− macrophages. Empty arrowheads denote Iba1+/dextran+ macrophages. (CD). Quantitative analysis of local and infiltrating macrophages at the infarct and peri‐infarct areas at 1 DPI. Total macrophage populations (Iba1+) was lower at the infarct site compared with peri‐infarct area (600–800 μm distal to core), which remained close to control levels. The percentage of infiltrating (Iba1+/dextran+) over total macrophage (Iba1+) population was greater in the infarct core compared with the peri‐infarct area. Scale: (A, B) 50 μm, (B insert) 20 μm.
Figure 5
Figure 5
Analysis of lesion extent and neuronal injury after endothelin‐1 ( ET ‐1) inducedPCA ca occlusion. (A) Parasagittal Nissl–substance‐stained section of adult marmoset brain. Dashed lines denote the borders of operculum and calcarine V1 used in volume measurement analysis. (B) Volume analysis ± standard error of the mean (SEM) of remaining V1 at 1 and 21 days post ischemia (DPI) compared with controls. *P = 0.038; not significant P > 0.05. (C). Enlarged parasagittal Nissl‐stained sections of control, 1 and 21 DPI adult V1 demonstrating the focal extent of the ischemic injury. Dashed lines in (C) denote the V1–V2 boundary. (i–v) denotes areas on accompanying enlarged regions (adjacent sections; 40 μm apart) visualized using methyl green nuclei histology. Pathological nuclei morphologies were observed in (iii) and (v), characterized by chromatin compaction or nuclear blebbing, compared with normal nuclei observed in (i, ii, iv). (DF). Immunofluorescent detection of activated caspase‐3 (aCasp3) expression and neuronal nuclei (NeuN)+ neurons in control (D), at 1 DPI (E) and 21 DPI (F). Cellular nuclei visualized using DAPI. Scale: (A) 5 mm, (C) 2 mm, (i–v) 20 μm, (DF) 5 μm.
Figure 6
Figure 6
Neuronal and astroglial pathology after focal ischemia was localized to operculumV 1 only. Adjacent parasagittal sections of control, 1 and 21 days post ischemia (DPI) adult V1 immunolabelled for (A, A′) neuronal nuclei (NeuN), (B) astrocyte‐specific glial fibrillary acidic proteins (GFAP) and (C) activated caspase‐3 (aCasp3). Sections were selected where the lesion core was most apparent. Bounding boxes in (A) denotes areas enlarged in (A′, C, D). #denotes lesion core. (B inserts) Demonstrates astrocyte morphologies. (C insert) obtained from lesion core. (D) Co‐immunofluorescent labeling revealed that the majority of aCasp3+ cells detected were GFAP+ reactive astrocytes. Cellular nuclei (white) visualized using Hoechst stain. Scale: (A, B) 2 mm; (A′, C, D) 1 mm; (B insert, D insert) 20 μm.
Figure 7
Figure 7
Reproducibility ofV 1‐specific focal ischemia in the neonatal marmoset's visual cortex. (A) Volume analysis ± standard error of measurement (SEM) of neonatal V1 at 21 days post ischemia (DPI) compared with controls *P = 0.0152. (B) Proportion of V1 loss as a result of focal ischemia in adults compared with neonates (not significant, P > 0.05). Parasagittal Nissl‐stained sections (C) revealed a similar operculum V1‐specific localization of the lesion at 21 DPI, compared with adults, confirmed using adjacent sections immunolabelled for neuronal nuclei (NeuN) (D). Extent of neuronal degeneration was notably more severe in neonates compared with adults, affecting all six cortical layers indiscriminately (D′). Glial fibrillary acidic proteins (GFAP) immunohistochemistry revealed similar upregulation and cellular morphology at 21 DPI previously observed in adults. #denotes lesion core. Scale: (C, D, E) 2 mm, (D′) 1 mm.
Figure 8
Figure 8
Hemorrhagic transformation and neovascularization after neonatal and adult focal ischemia. (A, B) Differential interference contrast (DIC) photomicrographs of Perls' Prussian blue stained sections corresponding the lesion core shown in Figures 5A′ and 6D′. No ferric iron staining was apparent in adult and neonatal control or at 1 days post ischemia (DPI). At 21 DPI, small punctate‐like regions of ferric iron staining was detected, localized to the central lesion core in both neonates and adults. (C) Positive control of a rat stab wound lesion demonstrating large region of intracerebral hemorrhage. # and * denotes regions in (D) and (E), respectively. Isolectin‐B4 immunolabeled vascular endothelial cells positive for the proliferation marker Ki‐67 were observed 21 days after neonatal (D; red arrowheads) but not adult (E; empty arrowheads) focal ischemia. Enlarged example of IB4+/Ki‐67 cells with orthogonal views shown in (F). Scale: (A, B) 0.5 mm, (D, E) 25 μm, (F) 2.5 μm.
Figure 9
Figure 9
Transneuronal retrograde degeneration in the adult and neonatalLGN at 21 days post ischemia ( DPI ) after focal ischemia. Coronal sections of control adult (A) and neonatal (A′) LGN and after focal ischemia at 21 DPI (B, B′) immunolabaled for neuronal nuclei (NeuN). No obvious neuronal degeneration was detected in the adult LGN at 21 DPI but the neonatal LGN revealed a clear zone devoid of neurones. Dashed lines denote neuronal degeneration zone. PE = parvocellular external; PI = parvocellular internal; MI = magnocellular internal; ME = magnocellular external. (C, C′) no cellular aCasp3 expression was detected in both adult and neonatal LGN at 21 DPI. Scale: 500 μm.

References

    1. Aldrich MS, Alessi AG, Beck RW, Gilman S (1987) Cortical blindness: etiology, diagnosis, and prognosis. Ann Neurol 21:149–158. - PubMed
    1. Allen LM, Hasso AN, Handwerker J, Farid H (2012) Sequence‐specific MR imaging findings that are useful in dating ischemic stroke. Radiographics 32:1285–1297, discussion 97–9. - PubMed
    1. Anderson V, Spencer‐Smith M, Wood A (2011) Do children really recover better? Neurobehavioural plasticity after early brain insult. Brain 134(Pt 8):2197–2221. - PubMed
    1. Ang LC, Munoz DG, Shul D, George DH (1991) SMI‐32 immunoreactivity in human striate cortex during postnatal development. Brain Res Dev Brain Res 61:103–109. - PubMed
    1. Belcher AM, Yen CC, Stepp H, Gu H, Lu H, Yang Y et al (2013) Large‐scale brain networks in the awake, truly resting marmoset monkey. J Neurosci 33:16796–16804. - PMC - PubMed

Publication types

MeSH terms

LinkOut - more resources