

Stool phospholipid signature is altered by diet and tumors
- PMID: 25469718
- PMCID: PMC4254978
- DOI: 10.1371/journal.pone.0114352
Stool phospholipid signature is altered by diet and tumors
Abstract
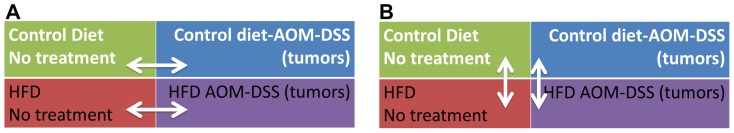
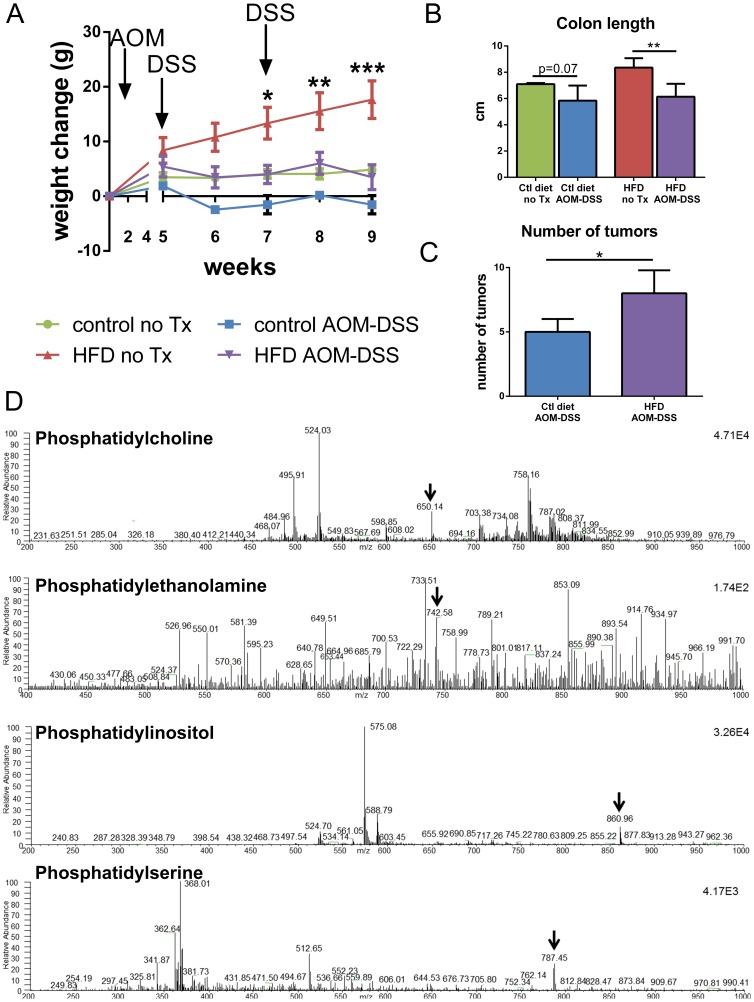
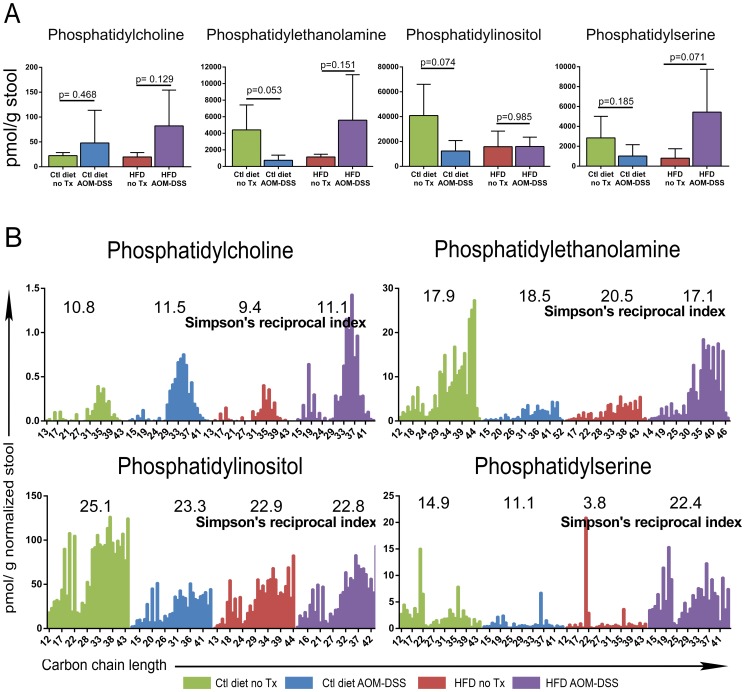
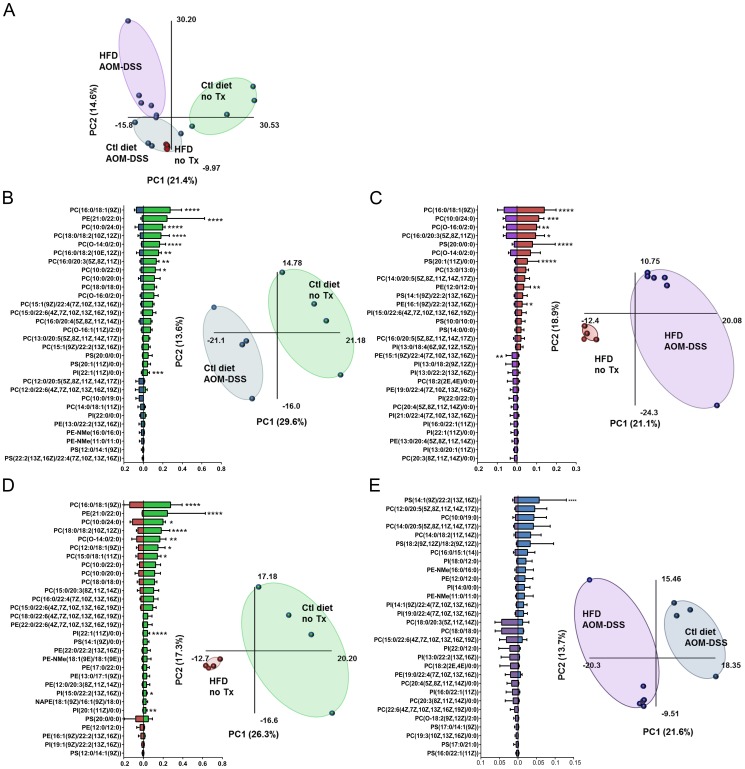
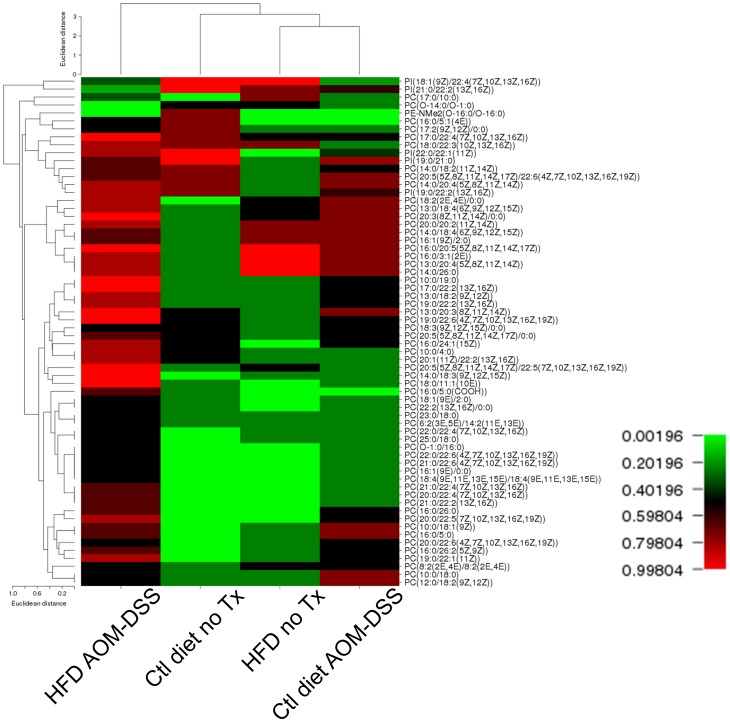
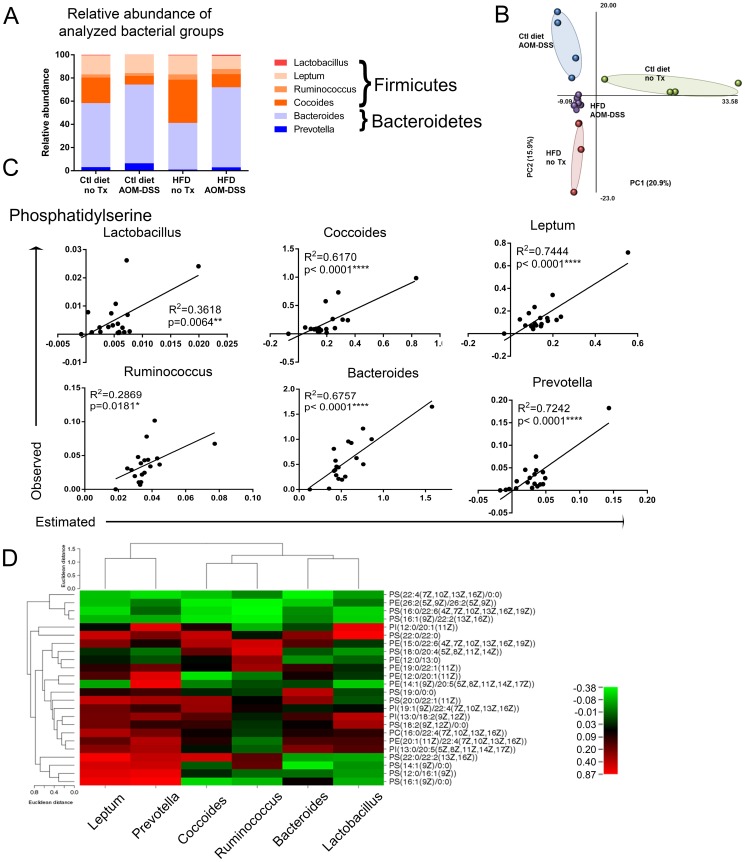
Intake of saturated fat is a risk factor for ulcerative colitis (UC) and colon cancer. Changes in the microbiota have been implicated in the development of UC and colon cancer. The host and the microbiota generate metabolites that may contribute to or reflect disease pathogenesis. We used lipid class specific quantitative mass spectrometry to assess the phospholipid (PL) profile (phosphatidylcholine [PC], phosphatidylethanolamine [PE], phosphatidylinositol [PI], phosphatidylserine [PS]) of stool from mice fed a high fat (HFD) or control diet with or without induction of colitis-associated tumors using azoxymethane and dextran sodium sulfate. The microbiota was assessed using qPCR for several bacterial groups. Colitis-associated tumors were associated with reduced bulk PI and PE levels in control diet fed mice compared to untreated mice. Significant decreases in the relative quantities of several PC species were found in colitis-associated tumor bearing mice fed either diet. Statistical analysis of the PL profile revealed distinct clustering by treatment group. Partial least squares regression analysis found that the relative quantities of the PS class profile best predicted bacterial abundance of Clostridium leptum and Prevotella groups. Abundance of selected PL species correlated with bacterial group quantities. Thus, we have described that a HFD and colitis-associated tumors are associated with changes in phospholipids and may reflect host-microbial interactions and disease states.
Conflict of interest statement
Figures
Similar articles
-
Saccharomyces boulardii alleviates ulcerative colitis carcinogenesis in mice by reducing TNF-α and IL-6 levels and functions and by rebalancing intestinal microbiota.BMC Microbiol. 2019 Nov 6;19(1):246. doi: 10.1186/s12866-019-1610-8. BMC Microbiol. 2019. PMID: 31694526 Free PMC article.
-
Protective effect of agaro-oligosaccharides on gut dysbiosis and colon tumorigenesis in high-fat diet-fed mice.Am J Physiol Gastrointest Liver Physiol. 2016 Mar 15;310(6):G367-75. doi: 10.1152/ajpgi.00324.2015. Epub 2016 Jan 14. Am J Physiol Gastrointest Liver Physiol. 2016. PMID: 26767984
-
MicroRNA214 Is Associated With Progression of Ulcerative Colitis, and Inhibition Reduces Development of Colitis and Colitis-Associated Cancer in Mice.Gastroenterology. 2015 Oct;149(4):981-92.e11. doi: 10.1053/j.gastro.2015.05.057. Epub 2015 Jun 6. Gastroenterology. 2015. PMID: 26055138 Free PMC article.
-
Daily Intake of High-Fat Diet with Lysophosphatidic Acid-Rich Soybean Phospholipids Augments Colon Tumorigenesis in Kyoto Apc Delta Rats.Dig Dis Sci. 2017 Mar;62(3):669-677. doi: 10.1007/s10620-016-4434-5. Epub 2017 Jan 3. Dig Dis Sci. 2017. PMID: 28050783
-
Colonic inflammation accompanies an increase of β-catenin signaling and Lachnospiraceae/Streptococcaceae bacteria in the hind gut of high-fat diet-fed mice.J Nutr Biochem. 2016 Sep;35:30-36. doi: 10.1016/j.jnutbio.2016.05.015. Epub 2016 Jun 19. J Nutr Biochem. 2016. PMID: 27362974
Cited by
-
Development of suspension cell culture model to mimic circulating tumor cells.Oncotarget. 2017 Dec 7;9(1):622-640. doi: 10.18632/oncotarget.23079. eCollection 2018 Jan 2. Oncotarget. 2017. PMID: 29416640 Free PMC article.
-
Unique inducible filamentous motility identified in pathogenic Bacillus cereus group species.ISME J. 2020 Dec;14(12):2997-3010. doi: 10.1038/s41396-020-0728-x. Epub 2020 Aug 7. ISME J. 2020. PMID: 32770116 Free PMC article.
-
Intestinal Epithelial Toll-Like Receptor 4 Signaling Affects Epithelial Function and Colonic Microbiota and Promotes a Risk for Transmissible Colitis.Infect Immun. 2016 Jan 11;84(3):798-810. doi: 10.1128/IAI.01374-15. Infect Immun. 2016. PMID: 26755160 Free PMC article.
-
Cross sectional evaluation of the gut-microbiome metabolome axis in an Italian cohort of IBD patients.Sci Rep. 2017 Aug 25;7(1):9523. doi: 10.1038/s41598-017-10034-5. Sci Rep. 2017. PMID: 28842640 Free PMC article.
-
Complex Network of NKT Cell Subsets Controls Immune Homeostasis in Liver and Gut.Front Immunol. 2018 Sep 11;9:2082. doi: 10.3389/fimmu.2018.02082. eCollection 2018. Front Immunol. 2018. PMID: 30254647 Free PMC article. Review.
References
-
- Murphy TK, Calle EE, Rodriguez C, Kahn HS, Thun MJ (2000) Body mass index and colon cancer mortality in a large prospective study. American journal of epidemiology 152:847–854. - PubMed
-
- Calle EE, Rodriguez C, Walker-Thurmond K, Thun MJ (2003) Overweight, obesity, and mortality from cancer in a prospectively studied cohort of U.S. adults. N Engl J Med 348:1625–1638. - PubMed
-
- Hass DJ, Brensinger CM, Lewis JD, Lichtenstein GR (2006) The impact of increased body mass index on the clinical course of Crohn's disease. Clin Gastroenterol Hepatol 4:482–488. - PubMed
-
- Hou JK, Abraham B, El-Serag H (2011) Dietary intake and risk of developing inflammatory bowel disease: a systematic review of the literature. Am J Gastroenterol 106:563–573. - PubMed
Publication types
MeSH terms
Substances
Grants and funding
LinkOut - more resources
Full Text Sources
Other Literature Sources
Medical
Research Materials
Miscellaneous
