. 2014 Dec 3;9(12):e114015.
doi: 10.1371/journal.pone.0114015. eCollection 2014.

The importance of microhabitat for biodiversity sampling

Affiliations

The importance of microhabitat for biodiversity sampling

Zia Mehrabi et al. PLoS One. .

Abstract

Responses to microhabitat are often neglected when ecologists sample animal indicator groups. Microhabitats may be particularly influential in non-passive biodiversity sampling methods, such as baited traps or light traps, and for certain taxonomic groups which respond to fine scale environmental variation, such as insects. Here we test the effects of microhabitat on measures of species diversity, guild structure and biomass of dung beetles, a widely used ecological indicator taxon. We demonstrate that choice of trap placement influences dung beetle functional guild structure and species diversity. We found that locally measured environmental variables were unable to fully explain trap-based differences in species diversity metrics or microhabitat specialism of functional guilds. To compare the effects of habitat degradation on biodiversity across multiple sites, sampling protocols must be standardized and scale-relevant. Our work highlights the importance of considering microhabitat scale responses of indicator taxa and designing robust sampling protocols which account for variation in microhabitats during trap placement. We suggest that this can be achieved either through standardization of microhabitat or through better efforts to record relevant environmental variables that can be incorporated into analyses to account for microhabitat effects. This is especially important when rapidly assessing the consequences of human activity on biodiversity loss and associated ecosystem function and services.


Conflict of interest statement

Competing Interests: The authors have declared that no competing interests exist.

Figures

Figure 1
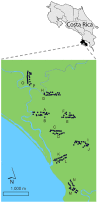
Figure 1. Study site.
Sampling sites comprised of 8 pairs of transects (AB-OP). Each transect pair consisted of one transect with traps placed in a standardized microhabitat (“treatment” traps), and one transect with traps placed randomly at 50 m intervals as per methods usually employed in comparative studies of dung beetles (“control” traps) (see methods for further details). Dark blue dots represent sampling stations which are set locations along transects where single traps were serviced over a 72 hr period.
Figure 2
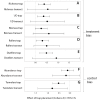
Figure 2. Effect of trap microhabitat on dung beetle biotic responses.
The magnitude of the effect of trap placement (treatment = microhabitat standardized vs. control = non-standardized) on various biotic responses, where 0.2, 0.5 and 0.8 represent small, medium and large effects, respectively. Transect level metrics were calculated on cumulated trap species abundances of the 10 sample stations on each transect. Trap level metrics are calculated from cumulative species abundances collected over 72hours for each sample station (see Methods for details). Effect sizes are calculated from t-values generated in a linear mixed models framework with biotic variables as responses, site as a random effect, microhabitat treatment as a fixed effect. Total traps days = 332, Total number of individuals = 17,744.
Figure 3
Figure 3. Distributions of dung beetle biotic responses to microhabitat treatments.
Treatment = microhabitat standardized traps, control = non-standardized traps. Transect level metrics were calculated on cumulated trap species abundances of the 10 sample stations on each transect. Trap level metrics are calculated from cumulative species abundances over 72hours for each sample station (see Methods for details). The box represents the interquartile range, the line is the median, upper whisker is the 75th percentile and lower whisker the 25th percentile. All graphs are drawn from untransformed data. Total traps days = 332, Total number of individuals = 17,744.
Figure 4
Figure 4. Distributions of dung beetle guild responses to microhabitat treatments.
Treatment = microhabitat standardized traps, control = non-standardized traps. Transect level metrics were calculated on cumulated trap species abundances of the 10 sample stations on each transect. Trap level metrics are calculated from cumulative species abundances over 72hours for each sample station (see Methods for details). The box represents the interquartile range, the line is the median, upper whisker is the 75th percentile and lower whisker the 25th percentile. All graphs are drawn from untransformed data. Total traps days = 332, Total number of individuals = 17,744.

References

    1. Cardoso P, Erwin TL, Borges PAV, New TR (2011) The seven impediments in invertebrate conservation and how to overcome them. Biol Conserv 144:2647–2655.
    1. May RM, Harvey PH (2009) Species Uncertainties. Science 323:2009. - PubMed
    1. Mora C, Tittensor DP, Adl S, Simpson AGB, Worm B (2011) How many species are there on Earth and in the ocean? PLoS Biol 9:e1001127. - PMC - PubMed
    1. Willis KJ, Whittaker RJ (2002) Ecology. Species diversity–scale matters. Science 295:1245–1248. - PubMed
    1. González-Megías A, María Gómez J, Sánchez-Piñero F (2007) Diversity-habitat heterogeneity relationship at different spatial and temporal scales. Ecography (Cop) 30:31–41.

Publication types