. 2014 Dec 11;516(7530):259-262.
doi: 10.1038/nature13966. Epub 2014 Nov 26.

MapZ marks the division sites and positions FtsZ rings in Streptococcus pneumoniae

Affiliations

MapZ marks the division sites and positions FtsZ rings in Streptococcus pneumoniae

Aurore Fleurie et al. Nature. .

Abstract

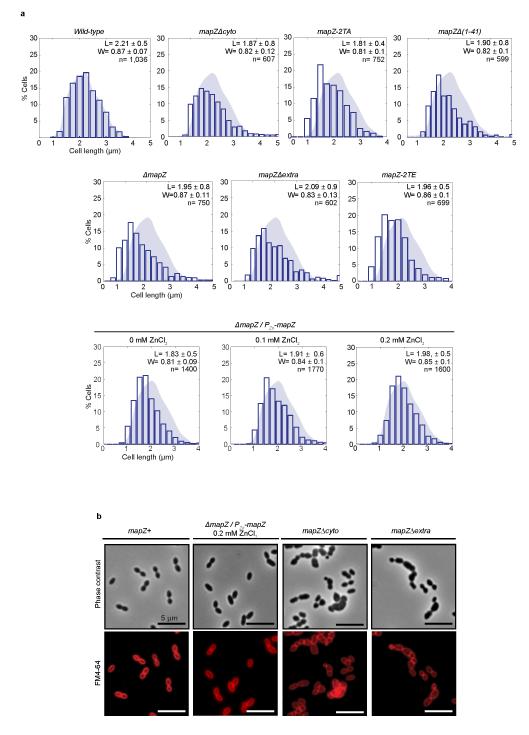
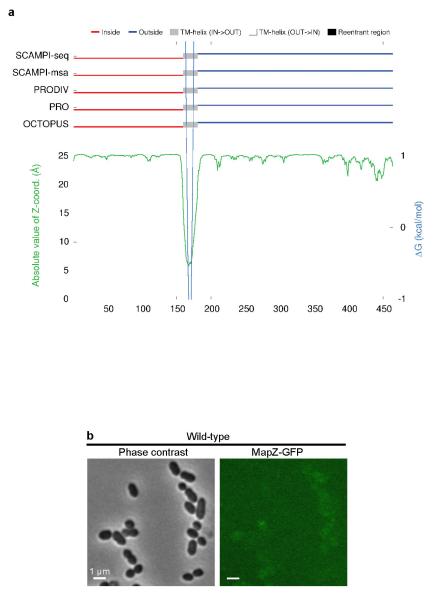
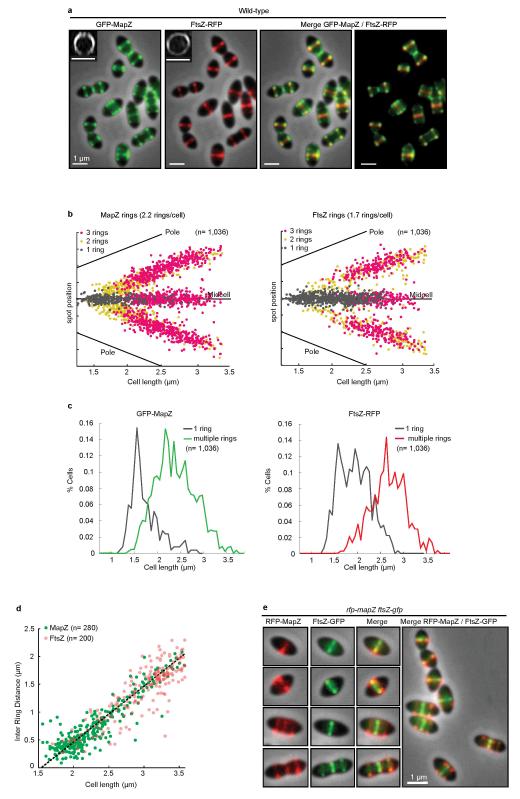
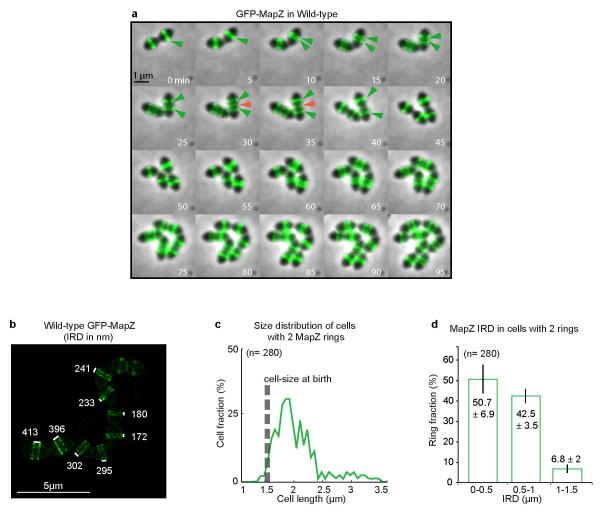
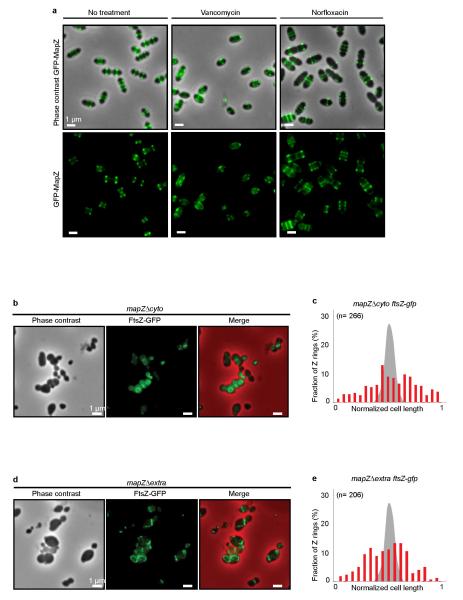
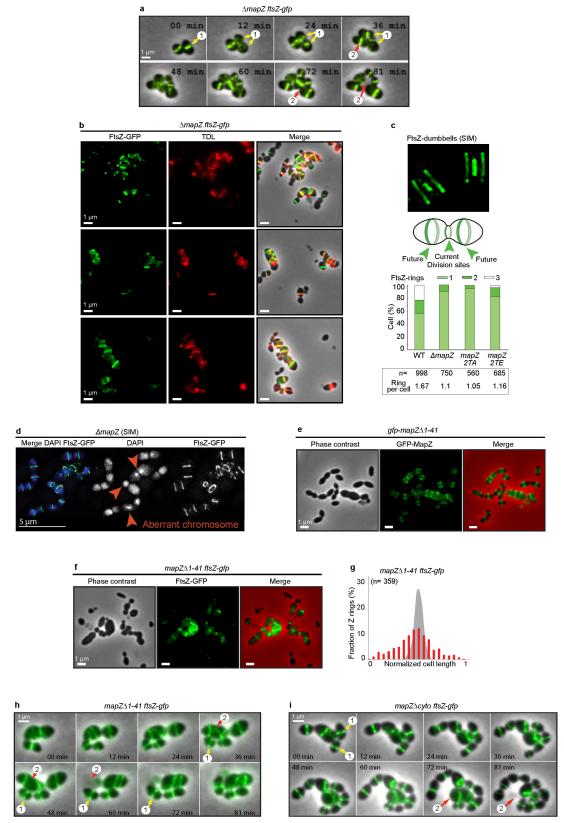
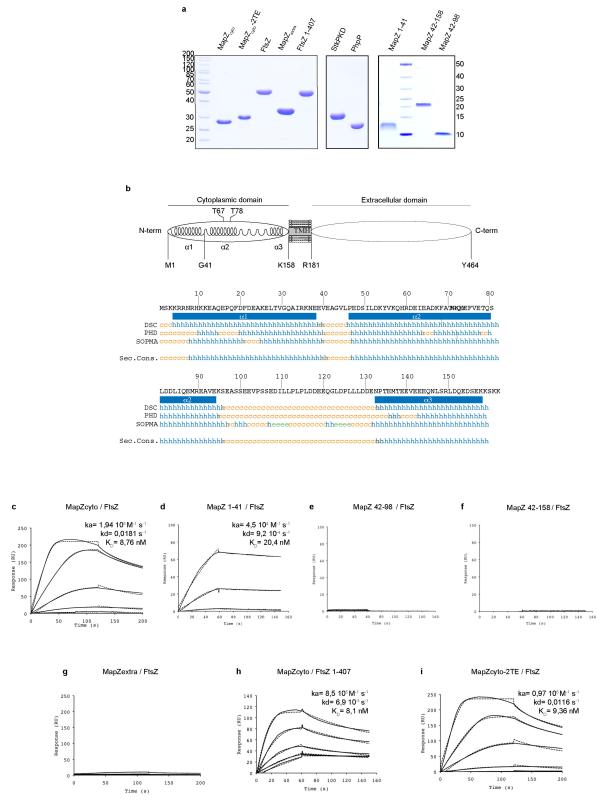
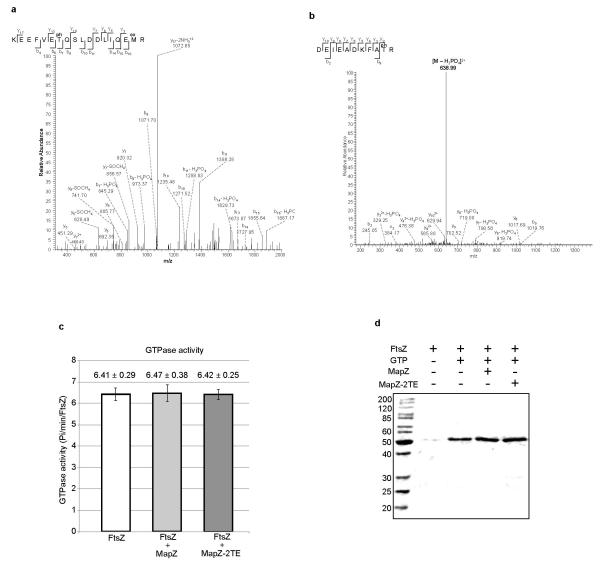
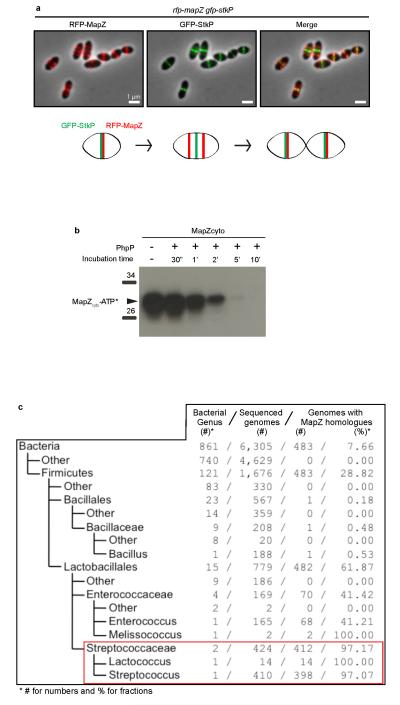
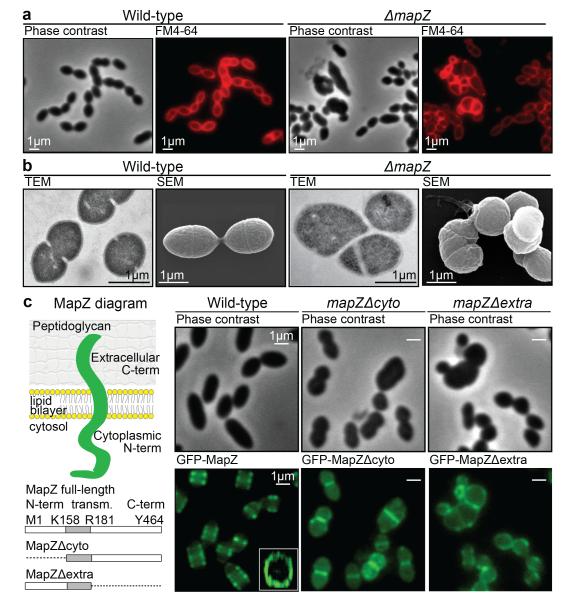
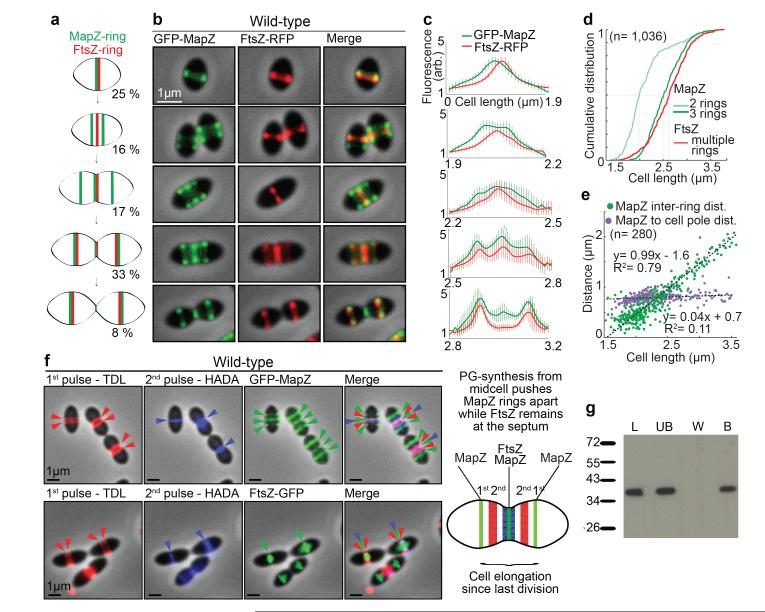
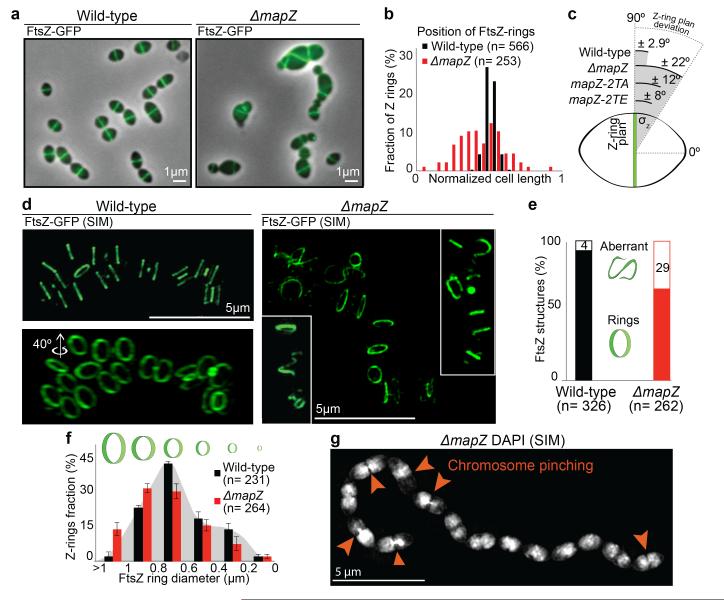
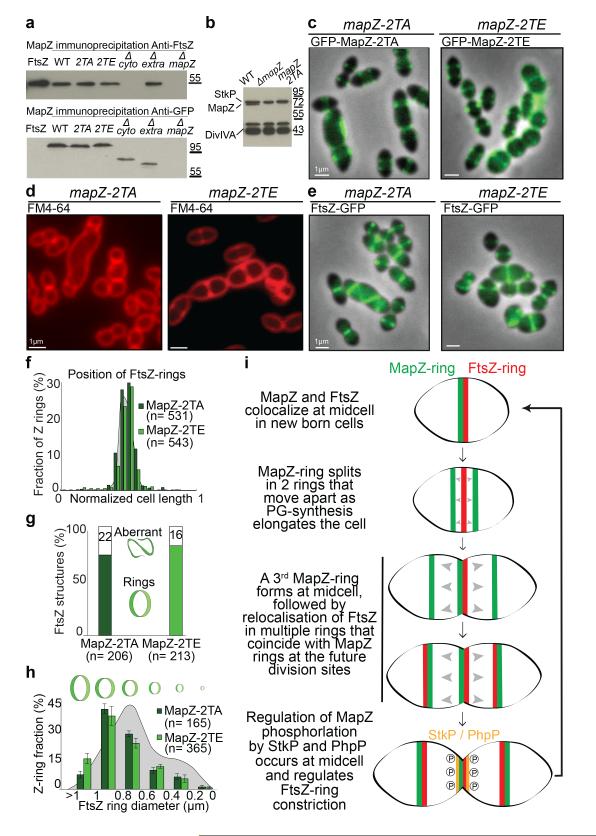
In every living organism, cell division requires accurate identification of the division site and placement of the division machinery. In bacteria, this process is traditionally considered to begin with the polymerization of the highly conserved tubulin-like protein FtsZ into a ring that locates precisely at mid-cell. Over the past decades, several systems have been reported to regulate the spatiotemporal assembly and placement of the FtsZ ring. However, the human pathogen Streptococcus pneumoniae, in common with many other organisms, is devoid of these canonical systems and the mechanisms of positioning the division machinery remain unknown. Here we characterize a novel factor that locates at the division site before FtsZ and guides septum positioning in pneumococcus. Mid-cell-anchored protein Z (MapZ) forms ring structures at the cell equator and moves apart as the cell elongates, therefore behaving as a permanent beacon of division sites. MapZ then positions the FtsZ ring through direct protein-protein interactions. MapZ-mediated control differs from previously described systems mostly on the basis of negative regulation of FtsZ assembly. Furthermore, MapZ is an endogenous target of the Ser/Thr kinase StkP, which was recently shown to have a central role in cytokinesis and morphogenesis of S. pneumoniae. We show that both phosphorylated and non-phosphorylated forms of MapZ are required for proper Z-ring formation and dynamics. Altogether, this work uncovers a new mechanism for bacterial cell division that is regulated by phosphorylation and illustrates that nature has evolved a diversity of cell division mechanisms adapted to the different bacterial clades.


Figures

Extended Data Figure 1
Extended Data Figure 1. Cell-shape analysis of wild-type and mapZ mutants strains
a. Cell length distribution of wild-type, ΔmapZ, mapZ-2TA, mapZ-2TE, mapZΔcyto, mapZΔextra and mapZΔ(1-41) strains, as well as for ΔmapZ/PZn-mapZ in presence of 0, 0.1 or 0.2 mM of ZnCl2 inducer. Average cell length (L) and width (W) are given with standard deviations for a total of n cells analysed from three independent experiments. For these samples, the two-tailed t distribution P-value determined using non-parametric statistical test was <1.59 10−2, for a critical value of 0.05. b. Phase contrast microscopy and FM4-64 membrane staining imaging of mapZ+ cells (mapZ is restored at the chromosomal locus in ΔmapZ), ΔmapZ/PZn-mapZmapZ cells complemented ectopically with PZn-mapZ), mapZΔcyto and mapZΔextra cells. Images are representative of experiments made in triplicate.
Extended Data Figure 2
Extended Data Figure 2. Prediction of MapZ topology
a. MapZ topology (i.e. specification of the membrane spanning segments and their IN/OUT orientation relative to the membrane) was predicted by five different topology algorithms (SCAMPI-seq, SACAMPI-msa, PRODIV-TMHMM, PRO-TMHMM and OCTOPUS) using TOPCONS (http://topcons.net). ZPRED (green line) predicts the distance to the membrane centre of each amino acid and ΔG-scale (light blue) shows the predicted free energy of membrane insertion for a window of 21 amino acids centred around each position in the sequence. The trans-membrane span is indicated in grey. Prediction of cytoplasmic and extracellular localizations are shown in red and dark blue, respectively. b. Wide-field microscopy images of cells producing the C-terminal fusion of MapZ with GFP. GFP fluorescence (right panel) and Phase contrast images (left panel). Images are representative of experiments made in triplicate.
Extended Data Figure 3
Extended Data Figure 3. Localization of MapZ and FtsZ in wild-type cells
a. Microscopy images of GFP-MapZ and FtsZ-RFP in wild-type cells. Inserts images show 3D-SIM orthogonal views of MapZ and FtsZ rings. b. Localization dotplots of MapZ-rings and FtsZ-rings position along the cell length in wild-type cells. c. Ratio of cells with single or multiple MapZ-rings and FtsZ-rings as a function of cell length. Panel b and c show data derived from analysis of 1,036 cells (n indicates the number of cells analysed in each panel). d. Distance between MapZ outer rings compared to distance between FtsZ outer rings as a function of cell length. e. Same as Fig. 2b but after swapping the GFP and RFP fluorescent protein labels. Indicative images showing MapZ, FtsZ, or both MapZ and FtsZ signal are shown for rfp-mapZ ftsZ-gfp cells at four different cell cycle stages. A wide-field view is also shown. Images are representative of experiments made in triplicate.
Extended Data Figure 4
Extended Data Figure 4. Early splitting of MapZ rings during elongation of wild-type cells
a. Time-lapse images of GFP-MapZ dynamics during cell growth and division showing progressive separation of the outer rings (green arrow) and appearance of a 3rd midcell ring (red arrow) (similar to Supplementary Video 1). Time is given in minutes. b. 3D-SIM images showing the very early stages of MapZ separation in the first stages of cell elongation. The numbers correspond to the inter-ring distance (IRD) in nm. c. Cell size distribution of cells with two MapZ rings reveals splitting of MapZ in the early stages of cells elongation. d. Distribution of IRD in cells with two MapZ rings (error bars show standard deviations from three experiments). Panel c and d show data derived from analysis of 280 cells (n indicates the number of cells analysed in each panel). Images are representative of experiments made in triplicate.
Extended Data Figure 5
Extended Data Figure 5. MapZ position depends on PG-synthesis and FtsZ position depends on MapZ functionality
a. Localization of MapZ after inhibition of PG-synthesis in Wild-type pneumococcus. Microscopy images of GFP-MapZ in wild-type cells before (top), and 15 minutes after addition of vancomycin (middle) or norfloxacin (bottom). Vancomycin, which inhibits PG-synthesis impairs localization of GFP-MapZ, while norfloxacin, which inhibits topoisomerases, has no effect on MapZ septal localization. b. Localization of FtsZ-GFP in mapZΔcyto and c. corresponding FtsZ-GFP rings positioning along the cell length normalized to 1. d. Localization of FtsZ-GFP in mapZΔextra and e. corresponding FtsZ-GFP rings positioning along the cell length normalized to 1. Images are representative of experiments made in triplicate.
Extended Data Figure 6
Extended Data Figure 6. FtsZ is mispositioned in ΔmapZ cells and colocalizes with PG-synthesis
a. Time-lapse images of FtsZ-GFP (green) dynamics in ΔmapZ cells. FtsZ polymers fail positioning correctly even in cells with normal shape (arrow 1), resulting in asymmetric cell division or cell lysis (arrow 2) (stills correspond to Supplementary Video 5). b. Microscopy images showing colocalization of PG-synthesis revealed by pulse labelling with TDL (red) and mispositioned FtsZ-GFP structures (green) in ΔmapZ cells. Three fields of view from three independent experiments are shown. c. 3D-SIM and schematic of FtsZ-dumbbells with histograms of the cell ratios with 1, 2 or 3 rings. The average number of rings per cell is shown. d. 3D-SIM image of DAPI-stained DNA and FtsZ-GFP in ΔmapZ cells. e. Localization of GFP-MapZΔ(1-41) in gfp-mapZΔ(1-41). f. Localization of FtsZ-GFP in mapZΔ(1-41). g. corresponding FtsZ-GFP rings positioning along the cell length normalized to 1. h and i. Time-lapse images of FtsZ-GFP (green) dynamics in mapZΔ(1-41) cells (h) and mapZΔcyto (i). FtsZ mispositioning, even in cells with normal shape leads to asymmetric cell division (arrow 1) or cell lysis (arrow 2). Images are representative of experiments made in triplicate.
Extended Data Figure 7
Extended Data Figure 7. Purification of FtsZ and MapZ and analysis of the interactions
a. Purification of proteins used in SPR experiments. MapZ cytoplasmic domain, MapZ-2TE cytoplasmic domain, FtsZ, MapZ extracellular domain, FtsZ1-407 fragment (FtsZ deleted from the C-terminal α-helix), StkP cytoplasmic domain, PhpP, MapZ N-terminal peptide from Met-1 to Gly-41, MapZ peptide from Val-42 to Ser-98 and MapZ peptide from Val-42 to Lys-158 were overproduced in E. coli BL21 and analysed by SDS-PAGE. b. Schematic model of MapZ and secondary structure prediction of the cytoplasmic domain of MapZ. Secondary structure codes e, c and h indicate predicted alpha helices (blue), random coils (orange) and extended strands (green), respectively. c-e. Surface Plasmon Resonance (SPR) analyses of interaction between FtsZ and MapZ. Full length FtsZ (c, d, e, f, g and i) or FtsZ1-407 (h) was covalently coupled to the surface of a CM5 sensorchip. Increasing amounts of either MapZ cytoplasmic domain (c and h), MapZ extracellular domain (g), MapZ-2TE (i) cytoplasmic domain, MapZ(1-41) (d), MapZ(42-98) (e) and MapZ(42-158) (f) peptides were injected onto the FtsZ- or FtsZ1-407-coupled sensorship. RU: resonance units. The measurements were made in triplicate. The affinity (KD), association (ka) and dissociation constants (kd) are indicated. Images are representative of experiments made in triplicate.
Extended Data Figure 8
Extended Data Figure 8. Analysis of MapZ in vivo phosphorylation and impact on FtsZ GTPase activity and polymerization
MapZ is phosphorylated on threonine 67 (a) and threonine 78 (b). The spectra shows the fragmentation pattern of the phosphopeptides DEIEADKFAT(ph)R corresponding to amino acids 58-68 and KEEFVET(ph)QSLDDLIQEM(ox)R corresponding to amino acids 72-89. c. Influence of MapZ and MapZ-2TE cytoplasmic domains on FtsZ GTPase activity. Purified FtsZ was incubated with GTP either alone or in the presence of MapZ or MapZ-2TE cytoplasmic domains and free phosphate was revealed using malachite green colour development. Standard deviations are shown for 3 independent experiments. d. FtsZ polymerization in the presence of MapZcyto, wild-type or mutated, cytoplasmic domains. FtsZ was incubated in the presence or absence of GTP and either MapZ or MapZ-2TE. The samples were then processed as described in the Materials and Methods section. Images are representative of experiments made in triplicate.
Extended Data Figure 9
Extended Data Figure 9. Interplay between MapZ and StkP and PhpP and conservation of MaZ in bacterial genomes
a. Simultaneous localization of GFP-StkP and RFP-MapZ in wild-type cells. Overlays between GFP (green), RFP (red) and phase contrast shows that StkP locates at midcell while MapZ rings separation proceeds, as depicted in the summary diagram below. b. Dephosphorylation of MapZ by PhpP. MapZ cytoplasmic domain was phosphorylated by StkPKD and then incubated for various times (30 sec to 10 min) with the protein phosphatase PhpP. MapZ dephosphorylation was analysed by autoradiography. c. Conservation analysis of mapZ homologues in 6,305 bacterial genomes. The left panel shows the taxonomy of the bacterial superkingdom. The right panel indicates the number of genus, the number of sequenced genomes, the number of genomes coding for MapZ homologous proteins and the percentage of genomes coding for MapZ homologous proteins respectively. Images are representative of experiments made in triplicate.
Figure 1
Figure 1. Characterization of MapZ
a. Cell shape observed by phase contrast microscopy and after membranes staining with FM4-64. b. Transmission electron microscopy (TEM) and scanning electron microscopy (SEM). c. Diagram of MapZ domains prediction using TOPCONS (http://topcons.net, see methods), with an intracellular N-terminal domain, a transmembrane domain and an extracellular C-terminal domain. Wide-field microscopy images show the localization of GFP-MapZ full-length, GFP-MapZΔcyto and GFP-MapZΔextra deleted for the N-terminal or the C-terminal domain, respectively. Images are representative of experiments made in triplicate.
Figure 2
Figure 2. Localization of MapZ and FtsZ in wild-type cells
a. MapZ and FtsZ-rings positions during growth (with corresponding cell ratios) b. Microscopy of GFP-MapZ and FtsZ-RFP. c. Fluorescence intensities for different cell size categories (error bars show s.d. for 10 cells analysed). d. Cumulative distribution of cells with MapZ or FtsZ-rings. Dash lines show cumulative distribution of 0.5. e. Distance between outer MapZ-rings and between MapZ-rings and the closest pole. Linear fitting curve with equation and R value are shown. f. Localization of consecutive peptidoglycan incorporation, TDL first (red) and HADA second (blue), together with GFP-MapZ or FtsZ-GFP. Summary diagram is presented. g. Interaction of MapZ extracellular domain with the cell wall. UB, unbound; W, wash fraction; B, MapZ bound and P, purified MapZ alone. (Sample of n cells analysed). Images are representative of experiments made in triplicate.
Figure 3
Figure 3. FtsZ localization in wild-type and ΔmapZ cells
a. Localization of FtsZ-GFP. b. Positioning of single FtsZ-rings. c. Deviation of FtsZ-rings angle (θz) (60 cells analysed for each strain; P-value < 2.9e10−2). d. 3D-SIM of FtsZ-rings. e. Fraction of FtsZ-rings or aberrant structures (two-tailed P-value from student t-test was 1.4e10−10). f. FtsZ-rings diameter distribution (error bars show s.d. from three independent experiments; P-value= 1.1e10−3). g. 3D-SIM of ΔmapZ cells after DNA-staining with DAPI. (Sample of n cells analysed). Images are representative of experiments made in triplicate.
Figure 4
Figure 4. Characterization of MapZ phosphorylation
a. Immunoprecipitation of GFP-MapZ with FtsZ. Anti-FtsZ (top) or anti-GFP (bottom). b. Westernblot of cell lysates probed with anti-phosphothreonine antibodies show phosphorylation signal for MapZ, DivIVA and StkP. c. Localization of GFP-MapZ-2TA and GFP-MapZ-2TE. d. mapZ-2TA and mapZ-2TE cells after membrane-staining. e. Localization of FtsZ-GFP. f. Positioning of single FtsZ-rings. g. Fraction of cells with FtsZ-rings or aberrant structures (two-tailed P-value from student t-test < 1.54e10−10 for MapZ-2TA and 1.14e10−10 for MapZ-2TE). h. Distribution of FtsZ-rings diameter (two-tailed P-value from student t-test were 2.9e10−4 for MapZ-2TA and 9.9e10−3 for MapZ-2TE). i. Model for MapZ-mediated control of FtsZ positioning. (Sample of n cells analysed). Images are representative of experiments made in triplicate.

Comment in

References

    1. Adams DW, Errington J. Bacterial cell division: assembly, maintenance and disassembly of the Z ring. Nat Rev Microbiol. 2009;7:642–653. doi:10.1038/nrmicro2198. - PubMed
    1. Bramkamp M, van Baarle S. Division site selection in rod-shaped bacteria. Curr Opin Microbiol. 2009;12:683–688. doi:10.1016/j.mib.2009.10.002. - PubMed
    1. Wu LJ, Errington J. Nucleoid occlusion and bacterial cell division. Nat Rev Microbiol. 2012;10:8–12. doi:10.1038/nrmicro2671. - PubMed
    1. Pinho MG, Kjos M, Veening JW. How to get (a)round: mechanisms controlling growth and division of coccoid bacteria. Nat Rev Microbiol. 2013;11:601–614. doi:10.1038/nrmicro3088. - PubMed
    1. Monahan LG, Harry EJ. Identifying how bacterial cells find their middle: a new perspective. Mol Microbiol. 2013;87:231–234. doi:10.1111/mmi.12114. - PubMed

Publication types

MeSH terms