. 2015 Jan 15;517(7534):327-32.
doi: 10.1038/nature13997. Epub 2014 Dec 3.

The African Genome Variation Project shapes medical genetics in Africa

Affiliations

The African Genome Variation Project shapes medical genetics in Africa

Deepti Gurdasani et al. Nature. .

Abstract

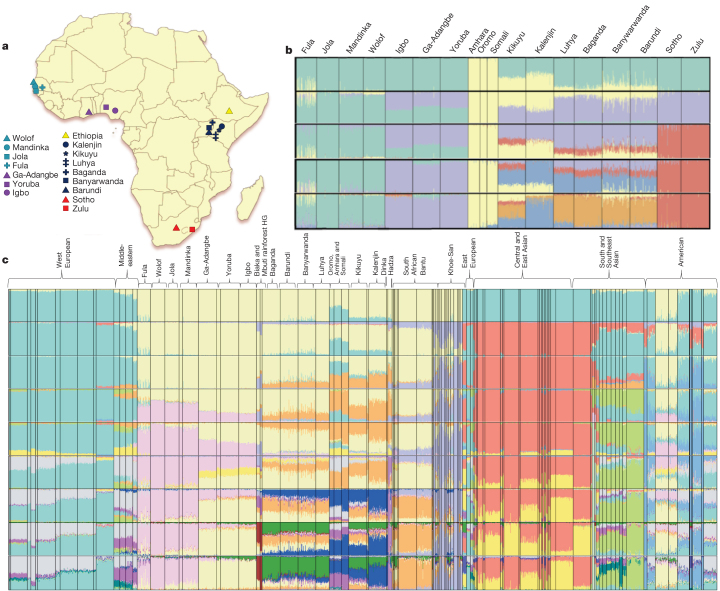
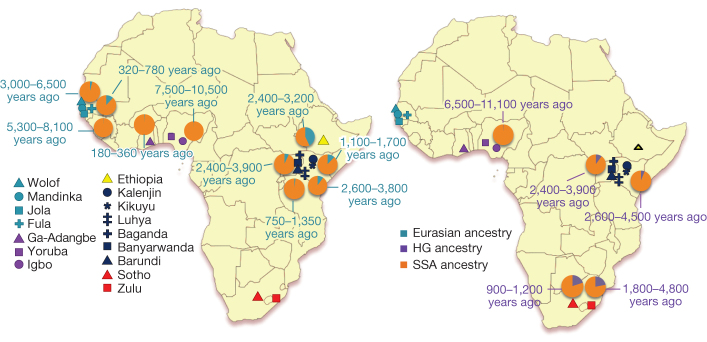
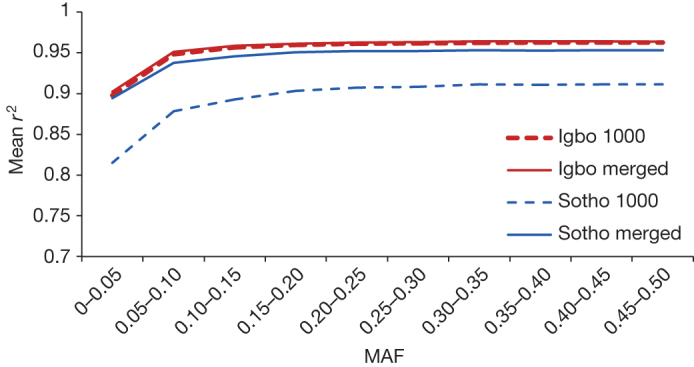
Given the importance of Africa to studies of human origins and disease susceptibility, detailed characterization of African genetic diversity is needed. The African Genome Variation Project provides a resource with which to design, implement and interpret genomic studies in sub-Saharan Africa and worldwide. The African Genome Variation Project represents dense genotypes from 1,481 individuals and whole-genome sequences from 320 individuals across sub-Saharan Africa. Using this resource, we find novel evidence of complex, regionally distinct hunter-gatherer and Eurasian admixture across sub-Saharan Africa. We identify new loci under selection, including loci related to malaria susceptibility and hypertension. We show that modern imputation panels (sets of reference genotypes from which unobserved or missing genotypes in study sets can be inferred) can identify association signals at highly differentiated loci across populations in sub-Saharan Africa. Using whole-genome sequencing, we demonstrate further improvements in imputation accuracy, strengthening the case for large-scale sequencing efforts of diverse African haplotypes. Finally, we present an efficient genotype array design capturing common genetic variation in Africa.


Conflict of interest statement

The authors declare no competing financial interests.

Figures

Figure 1
Figure 1. Populations studied in the AGVP.
a, 18 African populations studied in the AGVP including 2 populations from the 1000 Genomes Project. (The term ‘Ethiopia’ encompasses the Oromo, Amhara and Somali ethno-linguistic groups.) b, c, ADMIXTURE analysis of these 18 populations alone (n = 1,481) (b) and in a global context (n = 3,904) (c). Each colour represents a different ancestral cluster, with clusters 2–6 represented along the y-axis in b and clusters 2–18 represented in c. K = 6 and K = 18 were the most likely clusters on ADMIXTURE analysis. ADMIXTURE analysis suggests substructure between North, East, West and South Africa. Studying these populations in the context of Eurasian and African HG populations suggest extensive Eurasian and HG admixture across Africa. PowerPoint slide
Figure 2
Figure 2. Dating and proportion of Eurasian and HG admixture among African populations.
The proportion and distribution of Eurasian and HG admixture among different populations across Africa, with approximate dating of admixture using MALDER (code was provided by J. Pickrell; see Supplementary Information). PowerPoint slide
Figure 3
Figure 3. Improvement in imputation accuracy with the AGVP WGS panel.
The substantial improvement in imputation accuracy in some populations (Sotho), compared to minimal improvement in others (Igbo) with the addition of the AGVP WGS reference panel to the 1000 Genomes Project phase I reference panel (‘merged’) suggests poor representation of some haplotypes (for example, Khoe-San haplotypes in Sotho) in the 1000 Genomes Project reference panel alone (‘1000’). r2 is the correlation coefficient, representing the correlation between imputed and genotyped data, on masking each genotyped variant during imputation. MAF, minor allele frequency. PowerPoint slide
Extended Data Figure 1
Extended Data Figure 1. Allele sharing between sequenced populations in the AGVP.
a, The overlap of SNPs between 4×WGS data from Zulu, Ugandan and Ethiopian individuals (subsampled to 100 samples each). b, The overlap of novel variants (those not in the 1000 Genomes Project phase I integrated call set, ‘1000G’) between the three populations. c, d, The allele frequency spectra of variants in different portions of the Venn diagrams depicted in a and b, respectively. There appear to be a large proportion of unshared (private) variants in each population: between 10% and 23% of the total number of variants in a given population. The proportion of novel variants was high, with Ethiopia showing the greatest proportion of novel variation. Most of the novel variation appears to be unshared and rare.
Extended Data Figure 2
Extended Data Figure 2. The first ten principal components for the African data set.
PC1 shows a cline among several African populations, most likely to represent Eurasian gene flow (n = 1,481). PC2 shows a clear separation between West and South/East Africa. Subsequent PCs show more detailed structure between, and within African populations.
Extended Data Figure 3
Extended Data Figure 3. The first ten principal components for the global data set, including populations from the 1000 Genomes Project.
PC1 shows a cline among several African populations extending towards European populations, most likely to represent non-SSA gene flow (n = 2,864). PC2 shows a clear separation between European and Asian populations. Subsequent PCs show more detailed structure between populations globally, and within African populations. GBR, British in England and Scotland; ACB, African Caribbeans in Barbados; ASW, Americans of African ancestry in southwestern USA; CDX, Chinese Dai in Xishuangbanna, China; CEU, Utah residents with Northern and Western European ancestry; CHB, Han Chinese in Beijing, China; CHS, Southern Han Chinese; CLM, Colombians from Medellin, Colombia; FIN, Finnish in Finland; GIH, Gujarati Indian from Houston, Texas, USA; IBS, Iberian population in Spain; JPT, Japanese in Tokyo, Japan; KHV, Kinh in Ho Chi Minh City, Vietnam; MXL, Mexican ancestry from Los Angeles, USA; PEL, Peruvians from Lima, Peru; PUR, Puerto Ricans from Puerto Rico, and TSI, Toscani in Italy.
Extended Data Figure 4
Extended Data Figure 4. The first ten principal components for the global extended data set, including populations from the 1000 Genomes Project, Human Genome Diversity Project, North African and Khoe-San population groups.
PC1 shows a cline among several African populations extending towards European populations, most likely to represent non-SSA gene flow (n = 3,202). PC2 shows a clear separation between European and Asian populations. Subsequent principal components show more detailed structure between populations globally, and within African populations.
Extended Data Figure 5
Extended Data Figure 5. Projection of principal components to assess admixture among African populations.
a, The projection of principal components calculated on YRI and CEU from the 1000 Genomes Project onto the African populations. The AGVP populations are seen to fall on a cline between YRI and CEU, with Ethiopian populations closest to CEU. This is suggestive of Eurasian ancestry among these populations. b, The projection of principal components calculated on YRI and Ju/’hoansi onto the AGVP and other Khoe-San populations. The AGVP and Khoe-San populations are seen to fall on a cline between YRI and Ju/’hoansi, with Zulu and Sotho leading the cline among the AGVP populations. This is suggestive of HG gene flow among these populations.
Extended Data Figure 6
Extended Data Figure 6. ADMIXTURE clustering analysis for AGVP samples combined with the 1000 Genomes Project, Human Genome Diversity Project, North African and Khoe-San samples.
Cluster K = 2 shows separation of European and African ancestry, with delineation of Asian and Khoe-San ancestry in cluster K = 4. Subsequent clusters show separation of East, West, North and South African ancestral components n = 3,202.
Extended Data Figure 7
Extended Data Figure 7. Dating and source of admixture in the AGVP.
a, The time and most likely sources of admixture with means and 95% confidence intervals for different AGVP populations estimated with MALDER (see Supplementary Note 5). Circular markers with a line drawn around them represent high-probability events, while those with no line around them represent low-probability events. b, The time and most likely sources of admixture estimated with MALDER for the same populations using high-quality imputed data to improve resolution.
Extended Data Figure 8
Extended Data Figure 8. Loci with marked allelic differentiation either globally or within Africa.
The derived and ancestral alleles are depicted in blue and red, respectively, for all loci. a, The global distribution of the non-synonymous variant rs17047661 at the CR1 locus implicated in malaria severity. This locus was noted to be among the most differentiated sites (in the top 0.1%) between Europe and Africa. b, The global distribution of the rs10216063 SNP at the AQP2 locus. The derived allele appears to be the major allele among European populations in contrast to African populations. c, The allele frequency distribution of rs10924081 at the ATP1A1 locus. Marked differentiation is observed globally, with the derived allele noted to be the major allele among European populations. d, The global distribution of the risk allele for the SNP rs1378940 in the CSK locus associated with hypertension. This locus was found to be within the top 0.1% of differentiated loci within Africa, and within the top 1% of differentiated loci globally. e, The allele frequency distribution of the rs3213419 SNP at the HP locus. f, The allele frequency distribution of the rs7313726 SNP at the CD163 locus. The HP and CD163 are among the top 0.1% of differentiated sites between malaria endemic and non-endemic regions in Africa.
Extended Data Figure 9
Extended Data Figure 9. The global distribution of biologically relevant loci used for simulation of traits to examine reproducibility of signals across AGVP populations.
a, The frequency of the sickle-cell variant (rs334) in different regions globally. The blue portion of each pie chart represents the frequency of the causal allele A. b, The distribution of the SORT1 causal SNP rs12740374, with the derived allele T depicted in blue. cf, The distributions of the APOL1 variant rs73885319, TCF7L2 variant rs7903146, the APOE variant rs429358 and the PRDM9 variant rs6889665, respectively.
Extended Data Figure 10
Extended Data Figure 10. The coverage obtained across the genome for variants at different allele frequencies for a hypothetical African genotype array with one million tagging variants.
Different allele frequency bins are depicted in different colours. The lines show the coverage that can be achieved by imputation at different r2 thresholds. Coverage, here, is defined as the proportion of variants within an allele frequency captured above a pre-defined r2 threshold (along the x axis) after imputation. The solid lines represent the coverage obtained with one million variants selected using the hybrid tagging and imputation approach, while the broken lines represent the coverage obtained by using a simple pairwise tagging approach to capture one million tagging variants. The hybrid method improves the coverage obtained, particularly for common variation. Coverage for common variants (>5%) appears to be high at an r2 threshold of 0.8 and above, with >80% of these variants accurately imputed.

Comment in

References

    1. Botigué LR, et al. Gene flow from North Africa contributes to differential human genetic diversity in southern Europe. Proc. Natl Acad. Sci. USA. 2013;110:11791–11796. - PMC - PubMed
    1. The International HapMap Consortium. The International HapMap Project. Nature426, 789–796 (2003) - PubMed
    1. The 1000 Genomes Project Consortium. An integrated map of genetic variation from 1,092 human genomes. Nature491, 56–65 (2012) - PMC - PubMed
    1. Tishkoff SA, et al. The genetic structure and history of Africans and African Americans. Science. 2009;324:1035–1044. - PMC - PubMed
    1. Schlebusch CM, et al. Genomic variation in seven Khoe-San groups reveals adaptation and complex African history. Science. 2012;338:374–379. - PMC - PubMed

Publication types