. 2015 Jan 29;517(7536):612-5.
doi: 10.1038/nature13967. Epub 2014 Nov 24.

Interception of host angiogenic signalling limits mycobacterial growth

Affiliations

Interception of host angiogenic signalling limits mycobacterial growth

Stefan H Oehlers et al. Nature. .

Abstract

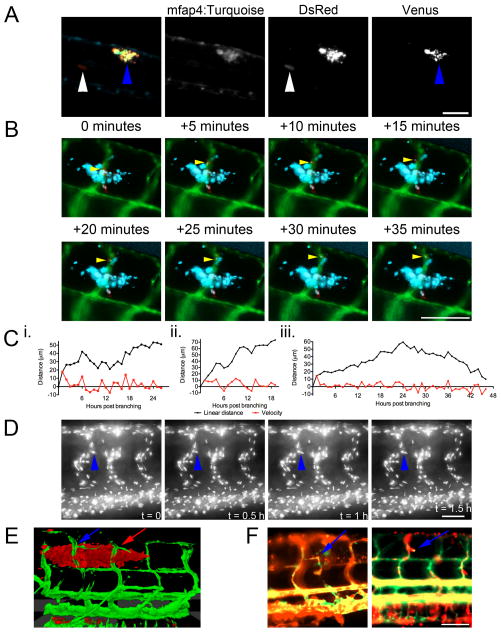
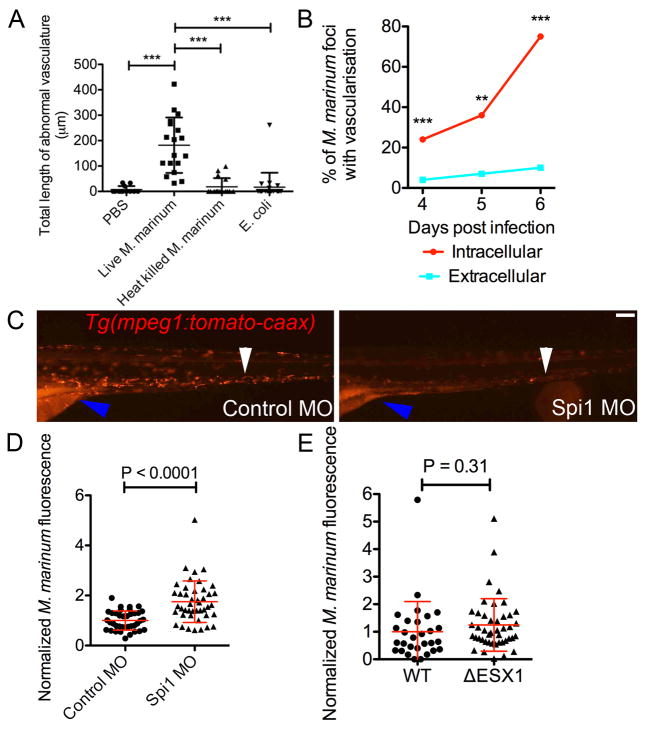
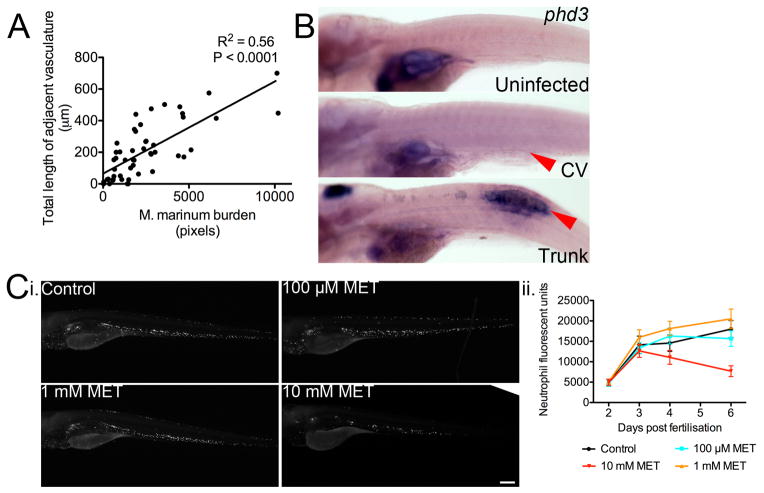
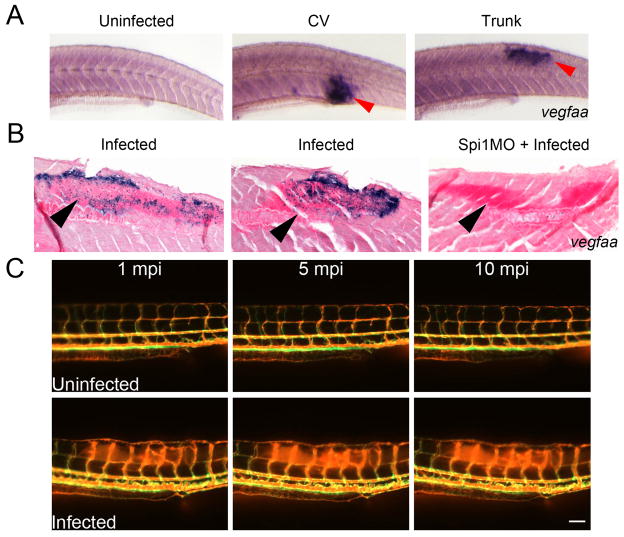
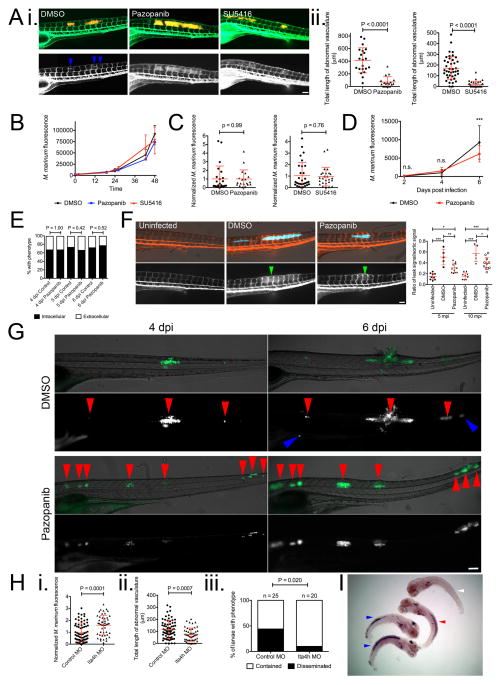
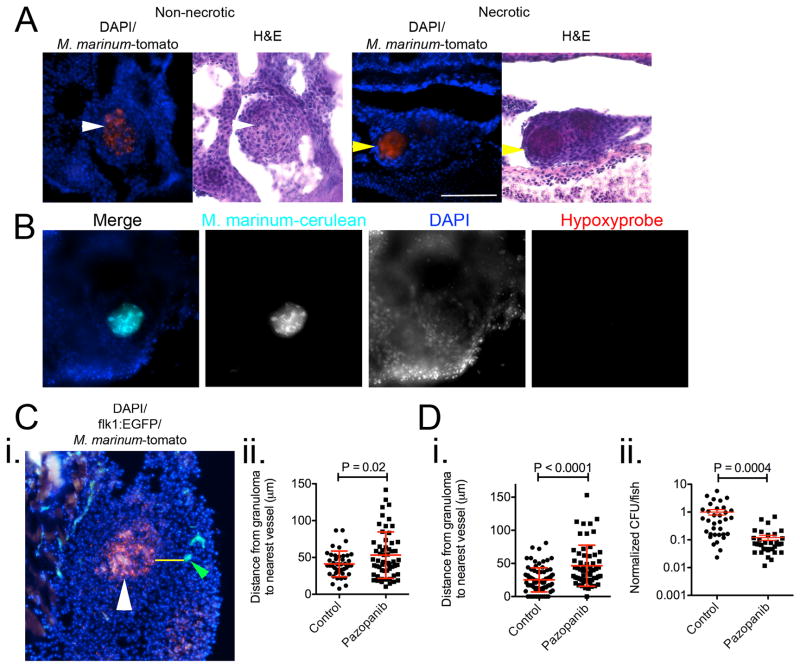
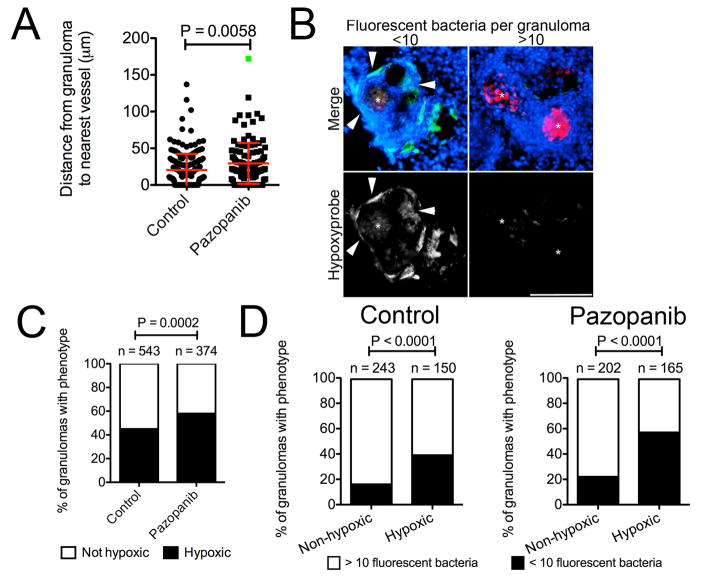
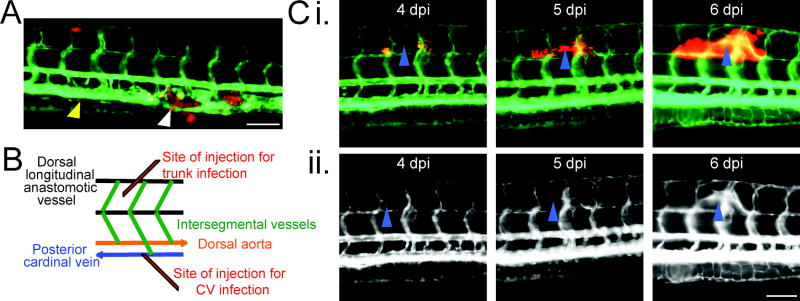
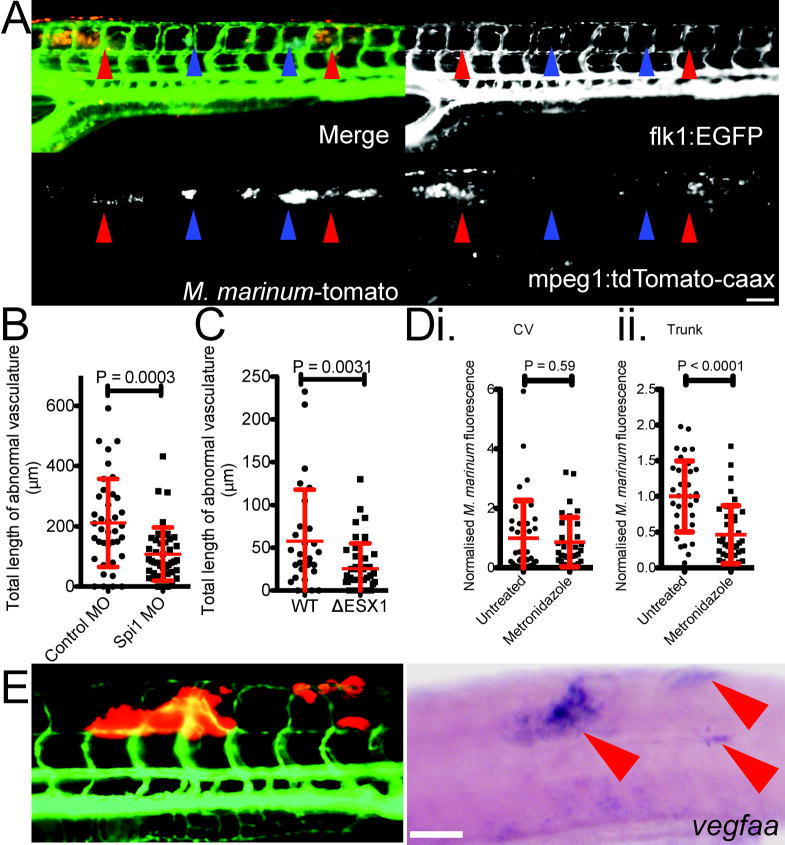
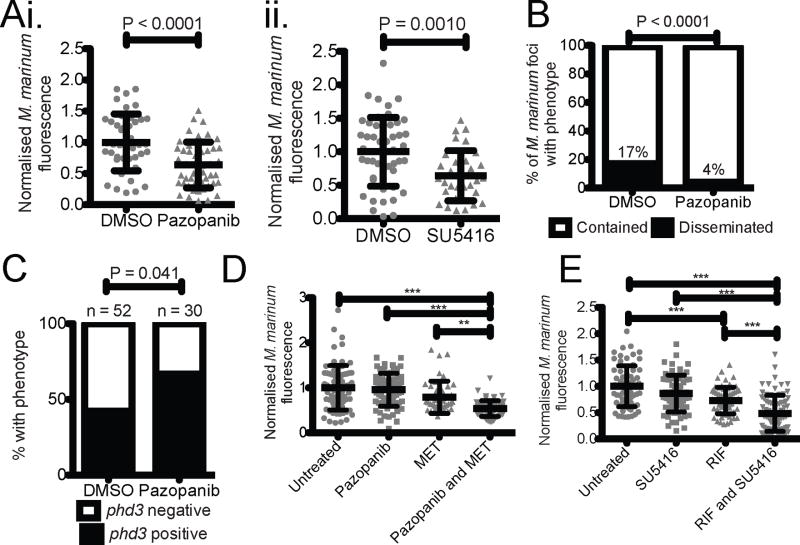
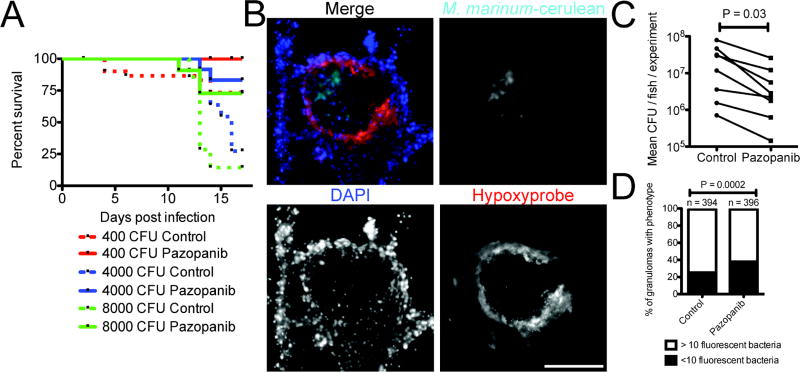
Pathogenic mycobacteria induce the formation of complex cellular aggregates called granulomas that are the hallmark of tuberculosis. Here we examine the development and consequences of vascularization of the tuberculous granuloma in the zebrafish-Mycobacterium marinum infection model, which is characterized by organized granulomas with necrotic cores that bear striking resemblance to those of human tuberculosis. Using intravital microscopy in the transparent larval zebrafish, we show that granuloma formation is intimately associated with angiogenesis. The initiation of angiogenesis in turn coincides with the generation of local hypoxia and transcriptional induction of the canonical pro-angiogenic molecule Vegfaa. Pharmacological inhibition of the Vegf pathway suppresses granuloma-associated angiogenesis, reduces infection burden and limits dissemination. Moreover, anti-angiogenic therapies synergize with the first-line anti-tubercular antibiotic rifampicin, as well as with the antibiotic metronidazole, which targets hypoxic bacterial populations. Our data indicate that mycobacteria induce granuloma-associated angiogenesis, which promotes mycobacterial growth and increases spread of infection to new tissue sites. We propose the use of anti-angiogenic agents, now being used in cancer regimens, as a host-targeting tuberculosis therapy, particularly in extensively drug-resistant disease for which current antibiotic regimens are largely ineffective.


Conflict of interest statement

The authors have no competing financial interests.

Figures

Extended Data 1
Extended Data 1
(A) Image of 6 dpi Tg(mfap4:turquoisext27) larvae infected with M. marinum SM2 pMAP49::Venus. Blue arrowheads indicates site of granuloma with induced expression of Venus from phagocytosed M. marinum. White arrowheads indicate sites of extracellular M. marinum growth detected by constitutive DsRed expression but no macrophage-induced Venus expression. Image is representative of granulomas found in 5 individual animals. (B) Time-lapse images of M. marinum-cerulean dissemination from an established granuloma into the adjacent intersegmental vessel in a Tg(flk1:EGFP, mpeg1:tomato-caaxtd3) double transgenic larva where bacterial are blue labelled, blood vessels are green labelled and macrophages are red labelled. Yellow arrow tracks a single infected macrophage egressing the established granuloma and entering the vasculature. Images are representative of macrophage behaviour in 3 individual animals. (C) Plots of vessel growth kinetics from three individual branches in individual Tg(flk1:EGFP) larvae. Video of each larva analysed is available in Supplementary Videos 6 and 7 (i.), and 8 and 9 (iii.). (D) Time-lapse images of nuclear division during vascular growth in a single Tg(fli1a:EGFP-nls) larva. Blue arrowhead indicates nucleus of interest. Images are representative of nuclear division in 10 individual animals. Video of nuclear division is available in Supplementary Video 10. (E) Three-dimensional rendering of recruited blood vessels in a Tg(flk1:EGFP) larva infected with M. marinum-tomato originating from arterial and venous ISVs as indicated by red and blue arrows, respectively. Image is representative of 10 individual animals. (F) Extended exposure images of blood flow in Tg(flk1:EGFP, gata1:DsRedsd2) larvae. Blue arrows indicate blood flow through ectopic vessels. Images are representative of blood flow in 20 individual animals. Scale bars indicate 100 μm.
Extended Data 2
Extended Data 2
(A) Length of abnormal vasculature in Tg(flk1:EGFP) larvae injected with PBS, live M. marinum, heat killed M. marinum and E. coli. One-way ANOVA with Tukey’s post-test, data are representative of two biological replicates. (B) Recruitment of vasculature by intracellular and extracellular foci of M. marinum. Total number of foci analysed: 4 dpi 221 intracellular 105 extracellular, 5 dpi 71 intracellular 26 extracellular and 6 dpi 131 intracellular 50 extracellular. Fisher’s exact test. (C) Comparative images of 5 dpf control and Spi1 morphant Tg(mpeg1:tomato-caax)xt3 larvae. White arrowhead indicates comparative locations within the caudal haematopoietic tissue. Blue arrowhead indicates intestinal and yolk sac autofluorescence. Scale bar indicates 100 μm. Images are representative of transgene expression in 20 animals per treatment group. (D and E) Bacterial burden in: (D) 5 dpi control and Spi1 morphant larvae, and (E) 4 dpi larvae infected with WT or ΔESX1 M. marinum-tomato. T-test with Welch’s correction, all data are pooled from two biological replicates. Error bars represent mean ± standard deviation.
Extended Data 3
Extended Data 3
(A) Plot of abnormal vasculature length and bacterial burden for individual foci of infection measured by FPC in Tg(flk1:EGFP) larvae. Slope significantly not zero, P < 0.0001 linear regression, data are pooled from three biological replicates. (B) Whole mount in situ hybridisation detection of phd3 expression. Images are representative of phd3 staining in Uninfected (20/20), CV (20/20) and Trunk (7/20). (C) i. Images of Tg(lyzC:ntr-p2A-lanYFPxt14) larvae treated with metronidazole as indicated. Green arrowheads indicate comparative locations within caudal haematopoietic tissue. Images are median images from experimental groups Control n=21, 100 μM n=22, 1 mM n=24 and 10 mM n=19. ii. Quantification of neutrophil numbers by area of fluorescence in Tg(lyzC:ntr-p2A-lanYFPxt14) larvae treated with metronidazole from 2 dpf to 6 dpf. Error bars represent mean ± standard deviation.
Extended Data 4
Extended Data 4
(A) Whole mount in situ hybridisation detection of vegfaa expression in uninfected, caudal vein injected and trunk injected larvae. Red arrow indicates sites of infection with vegfaa expression. Images are representative of 20 animals per treatment group. (B) Representative histological sections of whole mount in situ hybridisation detected vegfaa expression in control infected larvae and a Spi1MO-treated infected larva. Black arrows indicate sites of infection identified by increased nuclear fast red staining density. Images are representative of 10 animals per treatment group. (C) Microangiography of Tg(flk1:EGFP) larvae imaged at 1, 5 and 10 minutes post injection (mpi). Top panels are representative of uninfected larvae, bottom panels are representative of larvae infected with unlabelled M. marinum. Images are representative of 10 animals per treatment group. Scale bars indicate 100 μm.
Extended Data 5
Extended Data 5
(A) i. Comparative images of Tg(flk1:EGFP) larvae infected with M. marinum-tomato and treated with DMSO, pazopanib or SU5416. Top panels depict M. marinum-tomato and labelled vasculature. Bottom panels depict only Tg(flk1:EGFP)-labelled vasculature. Blue arrowheads indicate somites with ectopic vasculature. Images are representative of 20 animals per treatment group. ii. Length of abnormal vasculature in pazopanib or SU5416 treated larvae. T-test, data are pooled from two or three biological replicates, respectively. (B) Growth curve of M. marinum-tomato in 7H9 broth culture supplemented with pazopanib or SU5416. Data are representative of two biological replicates. (C) Bacterial burden in CV infected larvae treated with either pazopanib or SU5416. T-test, data are pooled from two biological replicates. (D) Longitudinal bacterial burden from 2 to 6 dpi in trunk infected larvae treated with pazopanib. One-way ANOVA with Tukey’s post-test. (E) Comparison of M. marinum foci between control and pazopanib treated larvae scored by association with macrophages. Fisher’s exact test. (F) i. Microangiography of larvae infected with M. marinum-cerulean, injected with high molecular weight dextran-Texas red at 6 and imaged at 5 mpi. Top panels depict M. marinum-cerulean and dextran-Texas red, bottom panels depict only dextran-Texas red in vasculature and leakage around sites of infection. Green arrowheads indicate somites with highest leakage signals in infected larvae. Images are median images from graph in Extended Data 5Fii. ii. Quantification of vascular leakage in uninfected, DMSO and pazopanib treated larvae. One-way ANOVA with Tukey’s post-test, data are representative of two biological replicates. (G) Dissemination of M. marinum-wasabi in larvae treated with DMSO or pazopanib. Red arrowheads indicate contained foci of infection that remain in the same location through infection, blue arrowheads indicate disseminated foci of infection. Images are representative of data in Figure 3B. (H) Bacterial burden (i.), length of abnormal vasculature (ii.), and dissemination (iii.) in 5 dpi control and Lta4h morphant larvae. (I) Whole mount in situ hybridisation detection of phd3 expression in uninfected (white arrow) and M. marinum infected zebrafish larvae. Blue arrows indicate phd3 expression positive larvae with purple staining, red arrow grey associated with bacteria, but lack of purple staining, indicating phd3 expression negative larva. Image is representative of data in Figure 3C. Scale bars indicate 100 μm. Error bars represent mean ± standard deviation.
Extended Data 6
Extended Data 6
(A) Images of non-necrotic (left) and necrotic (right) M. marinum-tomato granulomas stained with DAPI (top) and haematoxylin & eosin (bottom). White arrows indicate non-necrotic granuloma, yellow arrows indicate necrotic granulomas. Images are representative of granulomas found in 8 individual animals. (B) Representative image of a necrotic granuloma from a negative control, not injected with pimonidazole, 2 wpi adult Tg(flk1:EGFP) zebrafish infected with M. marinum-cerulean (cyan), and stained for hypoxyprobe (red) and with DAPI (blue). Images are representative of granulomas found in 2 individual animals. (C) i. Representative image of M. marinum-tomato granuloma in Tg(flk1:EGFP) zebrafish stained with DAPI. White arrow indicates granuloma, yellow line indicates path measured for distance between granuloma and nearest vasculature (indicated by green arrow). Image is representative of data presented in Extended Data 6Cii, Extended Data 6Di and Extended Data 7A. ii. Distance between granulomas and nearest vasculature measured in 2 wpi adult Tg(flk1:EGFP) zebrafish. Total number of zebrafish analysed = 4 (control), 4 (pazopanib). (D) i. Distance between granulomas and nearest vasculature measured in 2 wpi adult Tg(flk1:EGFP) zebrafish treated with pazopanib for 1 week. Total number of zebrafish analysed = 2 (control), 2 (pazopanib). ii. Bacterial burden in 2 wpi adult zebrafish treated with pazopanib for 1 week. T-test, data are pooled from 3 biological replicates.
Extended Data 7
Extended Data 7
(A) Distance between granulomas and nearest vasculature measured in 6 wpi adult Tg(flk1:EGFP) zebrafish. Total number of zebrafish analysed = 4 (control), 4 (pazopanib). Green dot indicates outlier that was omitted from statistical analysis. (B) Images of (left) low burden/hypoxic and (right) high burden/non-hypoxic granulomas in zebrafish that were injected with pimonidazole. Asterisks indicate M.marinum-tomato, arrows indicate areas of hypoxia in granuloma. Images are representative of data in Figure 4D, Extended Data 7C and Extended Data 7D. (C) Comparison of granulomas between control and pazopanib treated adult zebrafish scored for pimonidazole staining. Total number of zebrafish analysed = 4 (control), 4 (pazopanib). (D) Comparison of granulomas between non-hypoxic and hypoxic granulomas in control and pazopanib treated adult zebrafish scored for M. marinum burden. Total number of zebrafish analysed = 4 (control), 4 (pazopanib). Scale bars indicate 100 μm. Error bars represent mean ± standard deviation.
Figure 1
Figure 1. Mycobacterium marinum infection induces angiogenesis in the zebrafish infection model
(A) M. marinum-tomato granuloma in the CHT region of a Tg(flk1:EGFP) larva. White arrowhead indicates area of occlusion in the posterior cardinal vein caused by M. marinum granuloma. Yellow arrowhead indicates area of normal posterior cardinal vein width anterior of occlusion. (B) Schematic depicting location of injection into the trunk of a 2 dpf larva. (C) Time lapse images of vascular growth around a trunk granuloma from a single Tg(flk1:EGFP) larva from 4 dpi to 6 dpi. i. Depicts M. marinum-tomato and labelled vasculature. ii. Depicts only Tg(flk1:EGFP)-labelled vasculature. Blue arrowhead tracks the growth of a single vessel across all frames. Images are representative of (A) 10 and (B) 20 individual animals. Scale bars indicate 100 μm.
Figure 2
Figure 2. Mycobacterium marinum induces vascularisation through granuloma formation in cooperation with host leukocytes and the expression of vascular endothelial growth factor
(A) M. marinum-cerulean distribution in a Tg(flk1:EGFP, mpeg1:tomato-caaxtd3) double transgenic larva. Blue arrows indicate sites of extracellular bacterial growth, red arrows indicate sites of intracellular containment. Image is representative of 48 individual animals. (B and C) Length of abnormal vasculature in: (B) 5 dpi control and Spi1 morphant larvae, and (C) 4 dpi larvae infected with WT or ΔESX1 M. marinum-tomato. T-test with Welch’s correction, all data are pooled from two biological replicates. (D) Bacterial burden in i. CV infected and ii. trunk infected larvae treated with 5 mM metronidazole. T-test, data are pooled from three biological replicates. (E) Distribution of M. marinum-tomato in a Tg(flk1:EGFP) larva (left) and corresponding whole mount in situ hybridisation detection of vegfaa expression in the same larva (right). Red arrowheads indicate sites of M. marinum granulomas. Image is representative of 20 individual animals. Scale bars indicate 100 μm. Error bars represent mean ± standard deviation.
Figure 3
Figure 3
Inhibition of Vascular Endothelial Growth Factor Receptor signalling reduces Mycobacterium marinum pathogenicity in zebrafish larvae (A) Bacterial burden in trunk infected (i) pazopanib and (ii) SU5416 treated larvae. T-test, data are pooled from i. two or ii. three biological replicates. (B) Bacterial dissemination in untreated and pazopanib-treated larvae. Total number of granulomas and larvae analysed: Untreated 77 granulomas from 18 larvae, Pazopanib 130 granulomas from 22 larvae. Fisher’s exact test. (C) Expression of phd3 hypoxia marker in untreated and pazopanib-treated infected larvae detected by in situ hybridisation. Total number of larvae analysed = 52 (DMSO), 30 (pazopanib). Fisher’s exact test, data are from a single technical replicate of two pooled biological replicates. (D) Bacterial burden in pazopanib, MET and pazopanib and MET treated larvae. One-way ANOVA with Tukey’s post-test, data are pooled from three biological replicates. (E) Bacterial burden in RIF, SU5416, and RIF and SU5416 treated larvae. One-way ANOVA with Tukey’s post-test, data are pooled from three biological replicates. Error bars represent mean ± standard deviation.
Figure 4
Figure 4
Inhibition of Vascular Endothelial Growth Factor Receptor signalling reduces Mycobacterium marinum burden in adult zebrafish (A) Survival analysis of adult zebrafish infected with 400 CFU (red lines), 4000 CFU (blue lines) or 8000 CFU (green lines) M. marinum. Zebrafish are further grouped into control (dashed lines) or pazopanib treated (solid lines). Log-rank test 400 CFU not significant, 4000 CFU P=0.012, 8000 CFU P=0.029. (B) Representative image of a necrotic granuloma from a 2 wpi adult Tg(flk1:EGFP) zebrafish infected with M. marinum-cerulean (cyan), and stained for hypoxyprobe (red) and with DAPI (blue). Image is representative of granulomas found in 16 individual animals. (C) Pooled bacterial burden in pazopanib treated adult zebrafish. Matched T-test. (D) Comparison of granulomas between control and pazopanib-treated adult zebrafish scored for M. marinum burden as <10 or more than 10 bacteria. Total number of zebrafish analysed = 4 (control), 4 (pazopanib). Scale bar represents 100 μm. Error bars represent mean ± standard deviation.

References

    1. Ernst JD. The immunological life cycle of tuberculosis. Nat Rev Immunol. 2012;12:581–591. - PubMed
    1. Ramakrishnan L. Revisiting the role of the granuloma in tuberculosis. Nat Rev Immunol. 2012;12:352–366. - PubMed
    1. Freeman CD, Klutman NE, Lamp KC. Metronidazole. A therapeutic review and update. Drugs. 1997;54:679–708. - PubMed
    1. Rittershaus ES, Baek SH, Sassetti CM. The normalcy of dormancy: common themes in microbial quiescence. Cell Host Microbe. 2013;13:643–651. - PMC - PubMed
    1. Folkman J. Role of angiogenesis in tumor growth and metastasis. Seminars in oncology. 2002;29:15–18. - PubMed

Publication types

MeSH terms

Substances