. 2015 Jan 1;517(7532):44-9.
doi: 10.1038/nature13950. Epub 2014 Dec 1.

Structure of a mammalian ryanodine receptor

Affiliations

Structure of a mammalian ryanodine receptor

Ran Zalk et al. Nature. .

Abstract

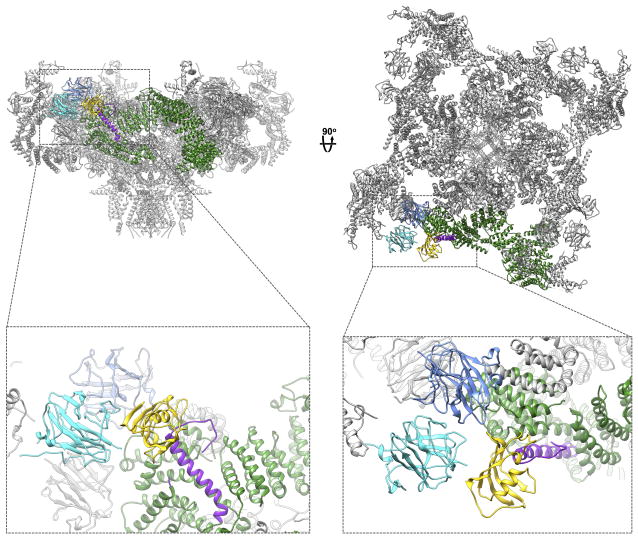
Ryanodine receptors (RyRs) mediate the rapid release of calcium (Ca(2+)) from intracellular stores into the cytosol, which is essential for numerous cellular functions including excitation-contraction coupling in muscle. Lack of sufficient structural detail has impeded understanding of RyR gating and regulation. Here we report the closed-state structure of the 2.3-megadalton complex of the rabbit skeletal muscle type 1 RyR (RyR1), solved by single-particle electron cryomicroscopy at an overall resolution of 4.8 Å. We fitted a polyalanine-level model to all 3,757 ordered residues in each protomer, defining the transmembrane pore in unprecedented detail and placing all cytosolic domains as tertiary folds. The cytosolic assembly is built on an extended α-solenoid scaffold connecting key regulatory domains to the pore. The RyR1 pore architecture places it in the six-transmembrane ion channel superfamily. A unique domain inserted between the second and third transmembrane helices interacts intimately with paired EF-hands originating from the α-solenoid scaffold, suggesting a mechanism for channel gating by Ca(2+).


Conflict of interest statement

The authors declare no competing financial interests.

Figures

Extended data figure 1
Extended data figure 1. Skeletal muscle RyR1 purification
a, Coomassie blue staining of SDS-PAGE showing CHAPS-solubilized SR membrane, calstabin2 elution from glutathione-GST-calstabin1 affinity chromatography column (AC) and the eluted RyR1 from FPLC size exclusion chromatograph (SEC). b, FPLC plot showing the RyR1 peak at ~7 mL elution and the excess calstabin2 (Cs2) peak at ~12 mL elution. c, Immunoblot analysis of CIP-treated RyR1 probed at indicated timepoints with, from bottom, anti-RyR1 (34C) antibody, anti-Phosphotyrosine antibody (Abcam ab10321), anti-Phosphothreonine antibody (Abcam ab79851), anti-Phosphoserine antibody (Abcam ab9332) and anti-RyR phospho-specific antibody (P-Ser 2843) that recognizes the PKA phosphorylated site on RyR1.
Extended data figure 2
Extended data figure 2. Particle picking and 2D class averages
a, Sample micrograph of the RyR1-CIP-EGTA dataset after motion correction, with red boxes around the particles picked by Autopicker (Scale bar=500 Å). b, Sample power spectrum of a twice-decimated micrograph after motion correction. c, Euler angle distribution before symmetry was imposed of the particles that went into the CIP-treated dataset final reconstruction. Latitude corresponds to θ from 0 to 90°. Longitude corresponds to ψ, from 0 to 360°. The dots color and area represent the number of particles in each view. d, 2D projections of the final CIP-treated map (left columns) compared to their respective reference-free 2D class averages (right columns).
Extended data figure 3
Extended data figure 3. Classification and protomer boundaries
a, Classification of the RyR1-EGTA dataset. First row: refined volume with all particles. Second row: primary classification with a number of classes K=10 giving rise to two major classes, one refined to 4.8 Å (blue box) and one refined to 5.0Å (green box). This class (green box) was subclassified with K=10 (third row) and yielded one class with a missing or disordered cytosolic portion of a protomer (red box). b, Classification of the RYR1-EGTA-CIP-treated dataset with K=8. Class8 (purple box) was refined to 5.0 Å. c, Views from the cytosol, membrane plane and lumen of the RyR1 model superimposed with a difference map between the full tetramer map (blue box) and the map with the cytosolic region of one protomer missing or disordered (red box).
Extended data figure 4
Extended data figure 4. RyR1 cryo-EM local resolution map
a, Gold-standard Fourier shell correlation curve for the 3D reconstructions, marked with resolutions corresponding to FSC=0.143. b, Cytosolic, membrane plane and luminal views of RyR1 (EGTA and CIP treated data set) local resolution distribution from 4 (blue) to 6 (red) Å resolution. c, local resolution distribution through a slab of density coincident with channel axis. d, Same slab as (c) for the EGTA treated without CIP. e, Slices through the volume of the CIP-EGTA dataset (top) and EGTA dataset (bottom). Slice direction and number are indicated on the images.
Extended data figure 5
Extended data figure 5. Representative densities of RyR1 selected regions
Representative electron density (gray mesh) in selected regions of the map. The protomers are represented as C-α traces, in different colors for clarity, with enlarged views of the following regions; a, calstabin2 b, the bridge solenoid c, N-terminal domain d, the pore region e, S6.
Extended data figure 6
Extended data figure 6. RyR1 local model to map correlation
a, Cytosolic, membrane plane and luminal views of the local correlation (calculated in a 5X5 voxel sliding window) between a map calculated from the model (filtered to 5 Å) and the electron density map of dephosphorylated RyR1, depicted in spectral coloring from 0.7 (red) to 1 (blue). b, local model/density map correlation within a slab of density through the plane of the membrane, highlighting the unmodelled rod of density on the periphery of the TM region and c, a slab coinciding with the channel axis.
Extended data figure 7
Extended data figure 7. α-solenoid subdomains
RyR1 electron density map (grey semitransparent surface) superimposed with the α-solenoid scaffold of RyR1. a, Core of the α-solenoid scaffold (insertions and elaborations are not shown). Green, bridging solenoid; blue, NTD solenoid; red, core solenoid. b, Alignment of NTD with an α-solenoid structure (PDB ID 3NMX). c, Alignment of core solenoid with an αsolenoid structure (PDB ID 1G3J). d, overlay of bridging solenoid with an α-solenoid structure (PDB ID 1WA5). In panels b through d, RyR1 α-solenoid repeats are depicted in spectral coloring from blue (N-terminus) to red (C-terminus), and the aligned α-solenoid protein is represented in dark grey.
Extended data figure 8
Extended data figure 8. Architecture of bridging and core solenoids
a, Electron density map of RyR1 in dark blue mesh superimposed with the bridging solenoid shown in detail on right, as labeled. b, two views of the interaction of the core solenoid (spectral coloring) containing the putative Ca2+-binding domain with CTD (grey) as labeled.
Extended data figure 9
Extended data figure 9. Calstabin2 binding site
Views in the membrane plane and cytosol of RyR1 with enlarged views of calstabin2 (yellow) bound to RyR1. SPRY1 is depicted in light blue, SPRY2 in cyan, the bridging solenoid in green and the calstabin binding helix in purple.
Extended data figure 10
Extended data figure 10. Putative Ca2+ binding domain in RyR1.
a, sequence alignment of rabbit RyR1,2&3 with the C-lobe of human calmodulin. b, structural alignment of the C-lobe of yeast calmodulin with the model of RyR1.
Figure 1
Figure 1. The architecture of RyR1 at 4.8 Å
a, View from the plane of the SR membrane of a slab of density (blue mesh) coinciding with the channel axis b, Color coded schematic representation of the RyR1. c, view in the plane of the SR membrane d, from the cytosol e, and from the lumen of the electron density map of skeletal muscle RyR1 at 5.0 Å resolution, with one protomer segmented according to the domains assigned in the model, colored as follows: blue, N-terminal domain; cyan, SPRY1, SPRY2 and SPRY3; salmon, clamp region (RY12 repeats), and phosphorylation domain (RY34 repeats); yellow, calstabin; green, the bridge solenoid scaffold; red, the core solenoid; and orange, transmembrane and C-terminal domains; purple, putative Ca2+ binding domain (EF). Dashed lines represent major disordered segments.
Figure 2
Figure 2. RyR1 transmembrane pore and C-terminal domain
a, Electron density map of the pore region (black mesh) and the core solenoid (blue mesh), displayed with the transmembrane region of one protomer in spectral coloring (N-terminus is blue, C-terminus is red). b, A 90° slab through the plane of the membrane, with numbering indicating the positions of the six transmembrane helices. c, The transmembrane region of a protomer in spectral coloring, as labeled d, superposition of the RyR1 pore with the structure of a voltage-gated sodium channel (NavAB, PDB ID 3RVY). The two structures were aligned using SUPERPOSE , giving a core RMSD of 3.42 Å across 628 aligned Cα atoms.
Figure 3
Figure 3. The RyR1 conduction pathway
a, superposition of the RyR1 pore domain (gray) with structures of the potassium channel KcsA (blue), the voltage-gated sodium channel NavAB (yellow), and TRPV1 (red) pores. Only two subunits are shown for clarity. The core RMSDs of the three alignments, calculated using SUPERPOSE are 3.44 Å (over 306 aligned Cα atoms), 3.42 Å (over 628 aligned Cα atoms) and 4.80 Å (over 635 aligned Cα atoms) respectively. b, scheme indicating the relative positioning of all the negatively charged residues in the ionic pathway (red dots) and the sequence of the P-loop and the cytosolic helix extending from S6 indicating in red the negatively charged residues. c, model of two opposing pore regions of RyR1 indicating the bundle crossing and the 24° kink in S6.
Figure 4
Figure 4. The Ca2+ sensing machinery
a, color coded representation of elements in the RyR1 structure that may participate in Ca2+ sensing and allosteric Ca2+ dependent force transduction to the channel gate. Green, calmodulin-like domain/EF hand pair; orange, C-terminal domain and S6; purple, core solenoid hairpin insertion; orange, S2-S3 helical bundle. b, two views of the “thumb and forefingers” motif originating from the core solenoid that engulfs the CTD.
Figure 5
Figure 5. Intra- and inter-protomer interactions formed by cytosolic domains
Views from the cytosol and in the membrane plane of RyR1, with regions colored as follows: the N-terminal domain (blue), core solenoid (red), and bridge solenoid (green). For clarity, one protomer is depicted in brighter coloring. In the view parallel to the membrane, most of the front subunit has been clipped for clarity. a, View from the cytosol, showing contacts between NTD-A and NTD-B of the neighboring protomer (1), NTD-B with the bridging solenoid of the adjacent protomer (2), and NTD-C forming a structurally contiguous solenoid with the bridging solenoid of the same protomer (3). b, view in the plane of the membrane showing interactions formed by NTD-C with the core solenoid of the same protomer (4), and of NTD-B with the core solenoid of the adjacent protomer (5). c, Views in the membrane plane and from the cytosol of RyR1 with the following domains colored as in Fig. 1b; core solenoid, the bridging solenoid scaffold, the RY34 repeats-phosphorylation domain, SPRY1, SPRY2, SPRY3, RY12 repeats, and the N-terminal domain. Position of the docked RY34 phosphorylation domain (salmon) abutting the bridge solenoid (dark green) within the density map (gray mesh). d, Locations of SPRY domains 1, 2 and 3 (cyan), calstabin2 (yellow), and RY12 (salmon) within the density map.

References

    1. Zalk R, Lehnart SE, Marks AR. Modulation of the ryanodine receptor and intracellular calcium. Annual review of biochemistry. 2007;76:367–385. - PubMed
    1. Marx SO, et al. PKA phosphorylation dissociates FKBP12.6 from the calcium release channel (ryanodine receptor): defective regulation in failing hearts. Cell. 2000;101:365–376. - PubMed
    1. Paolini C, Protasi F, Franzini-Armstrong C. The relative position of RyR feet and DHPR tetrads in skeletal muscle. Journal of molecular biology. 2004;342:145–153. - PubMed
    1. Meissner G, Lu X. Dihydropyridine receptor-ryanodine receptor interactions in skeletal muscle excitation-contraction coupling. Bioscience reports. 1995;15:399–408. - PubMed
    1. Stern MD, Pizarro G, Rios E. Local control model of excitation-contraction coupling in skeletal muscle. The Journal of general physiology. 1997;110:415–440. - PMC - PubMed

Publication types

MeSH terms

Substances

Associated data