. 2015 Mar 5;519(7541):114-7.
doi: 10.1038/nature14033. Epub 2014 Dec 1.

Structure of the F-actin-tropomyosin complex

Affiliations

Structure of the F-actin-tropomyosin complex

Julian von der Ecken et al. Nature. .

Abstract

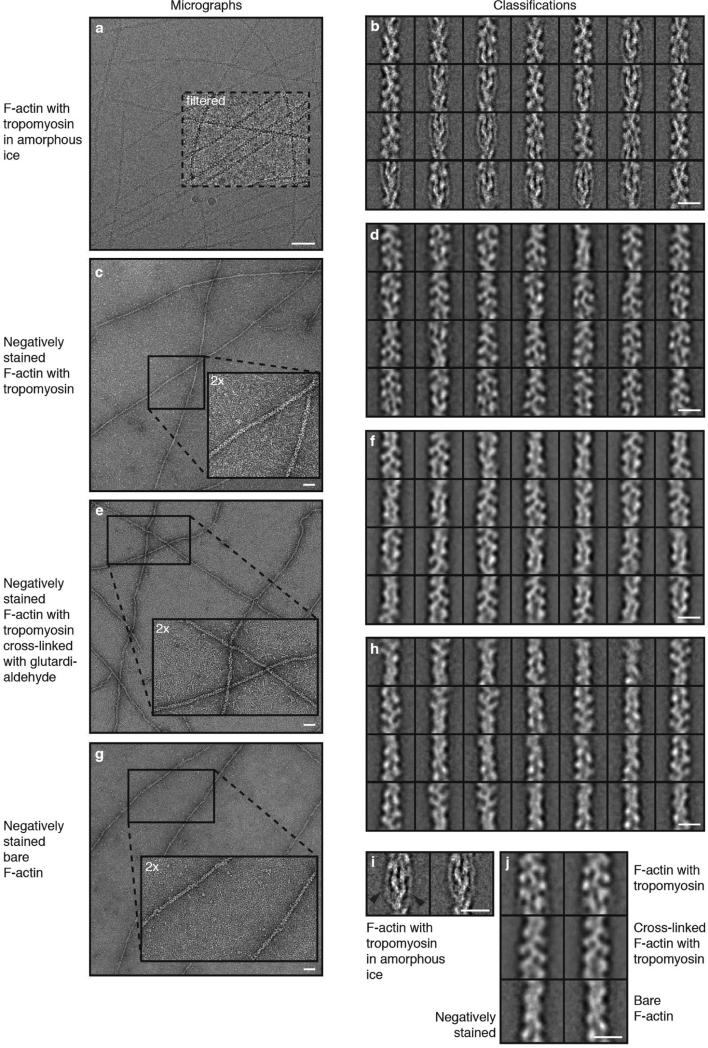
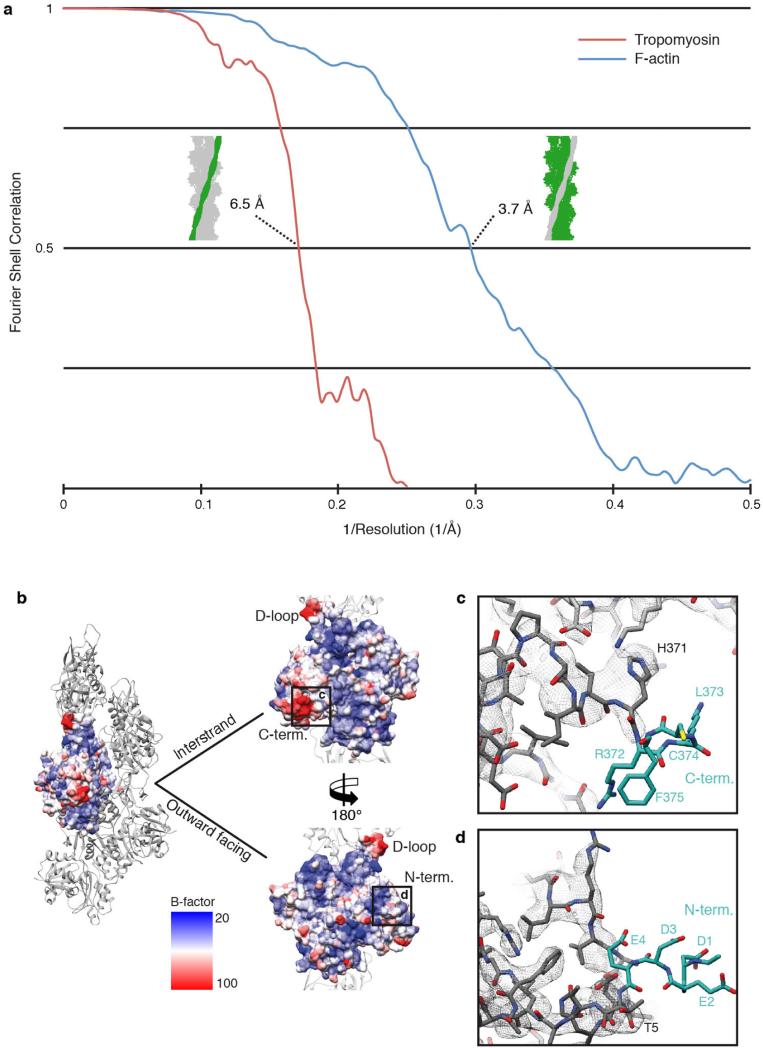
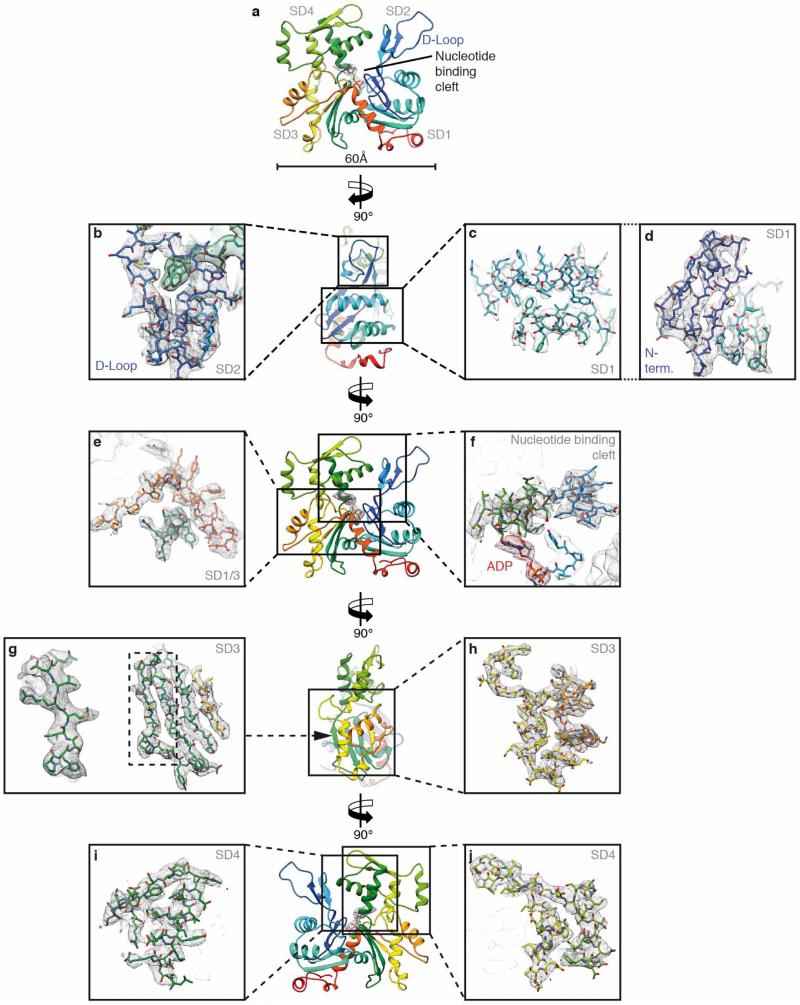
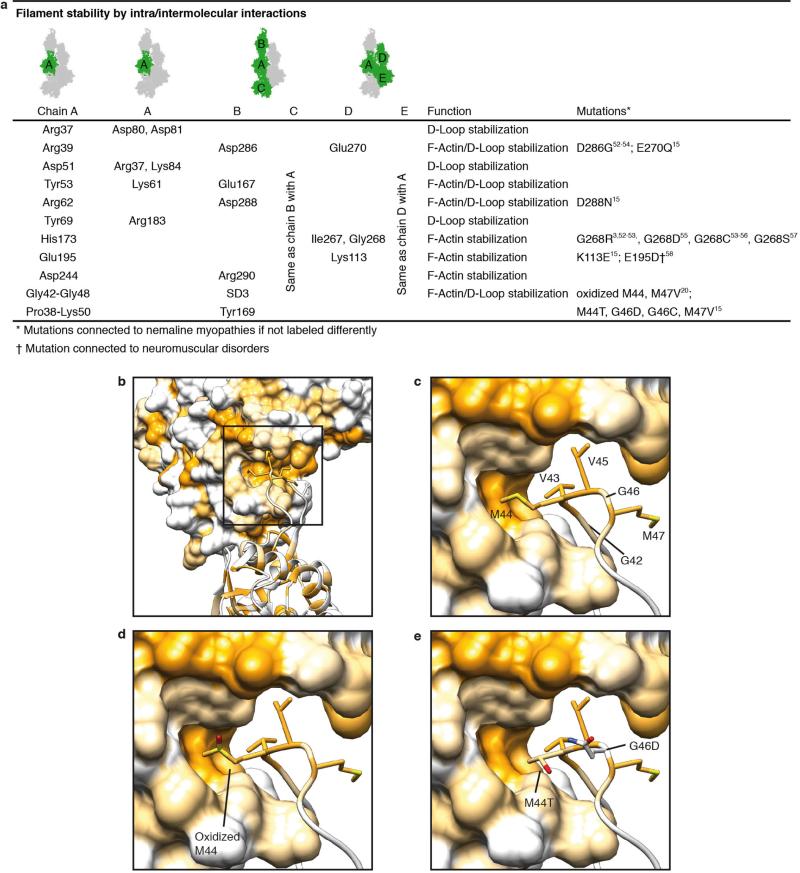
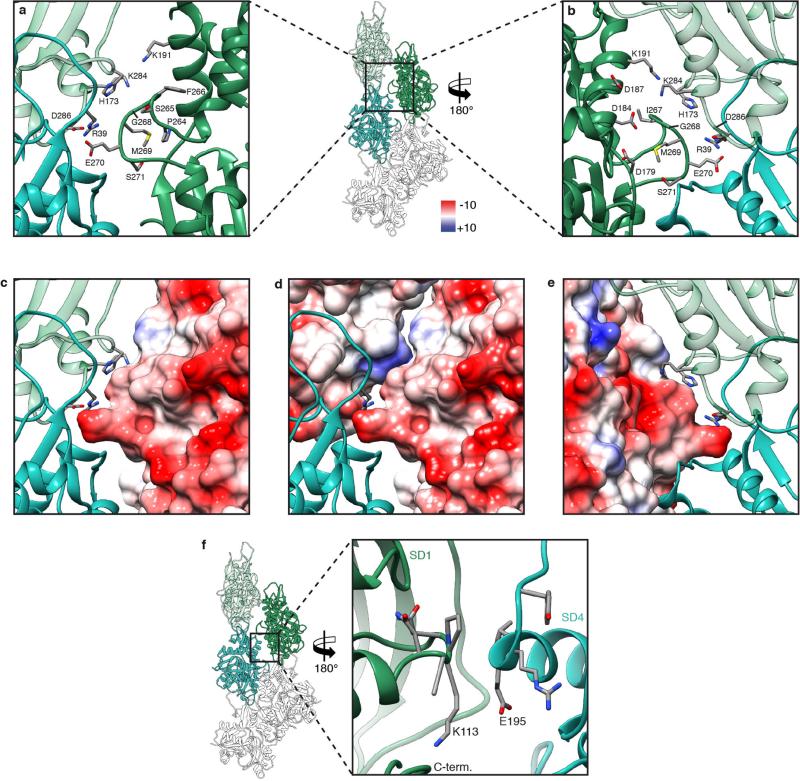
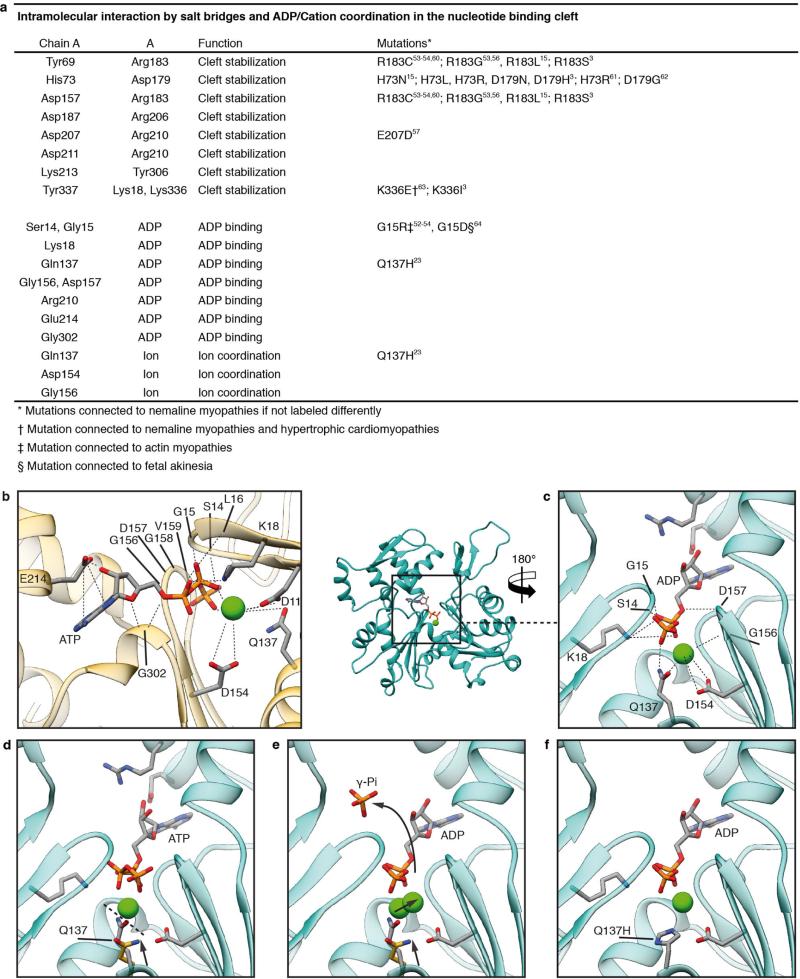
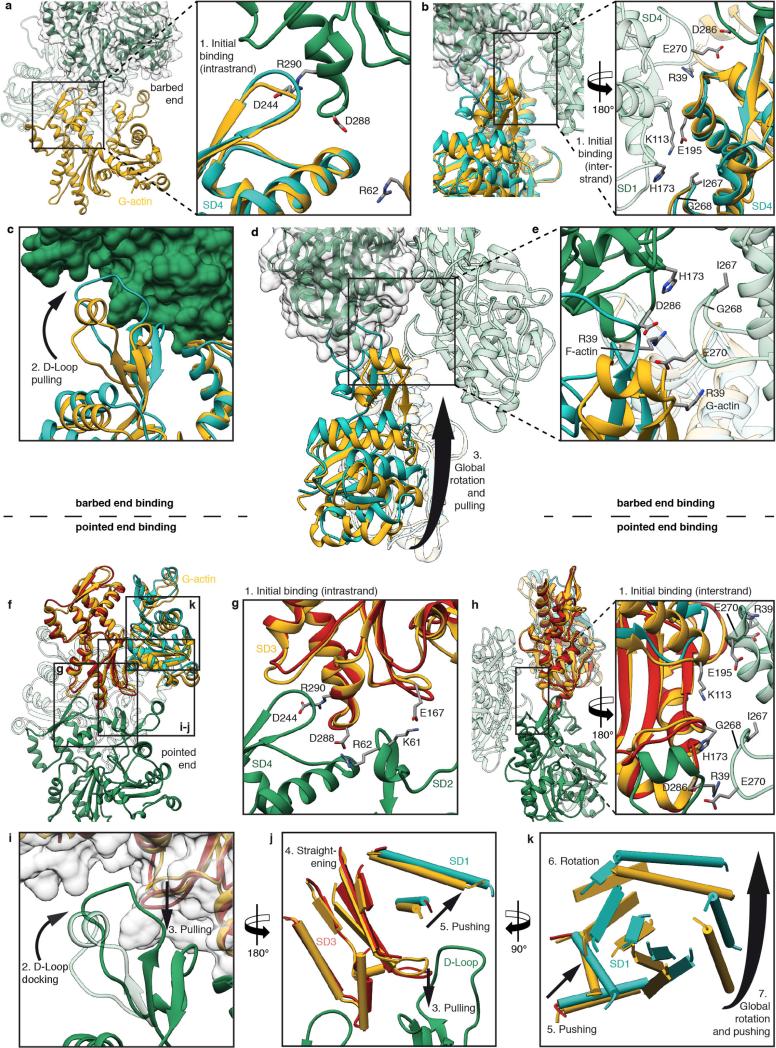
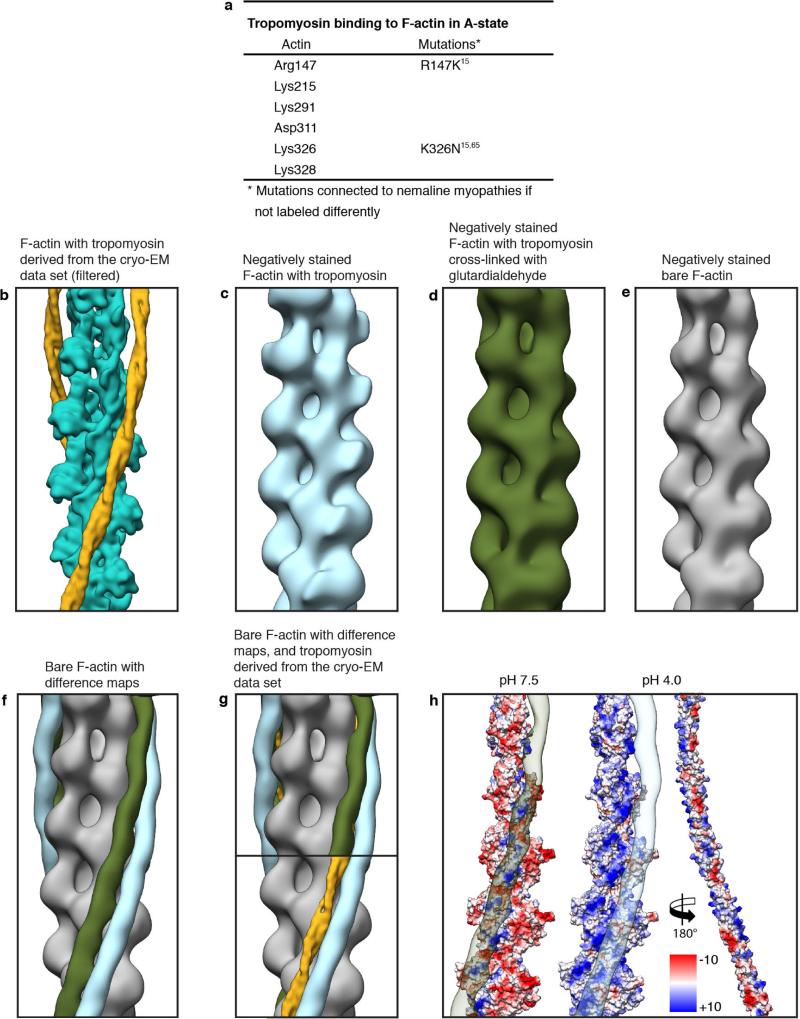
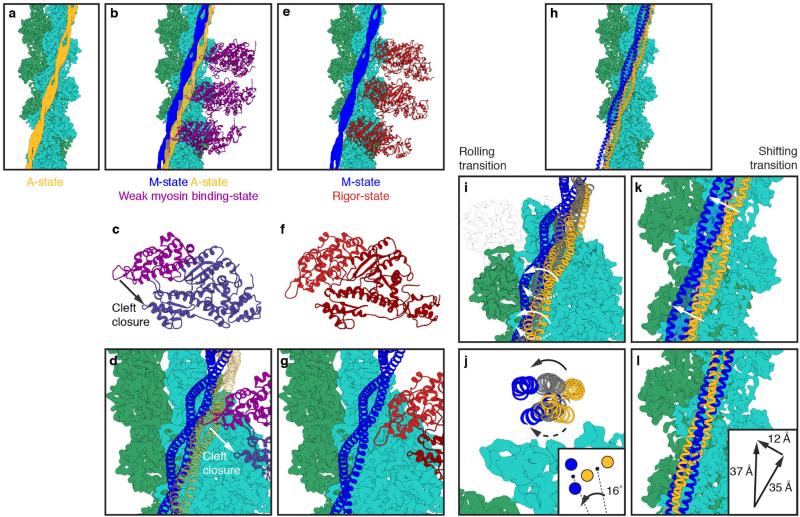
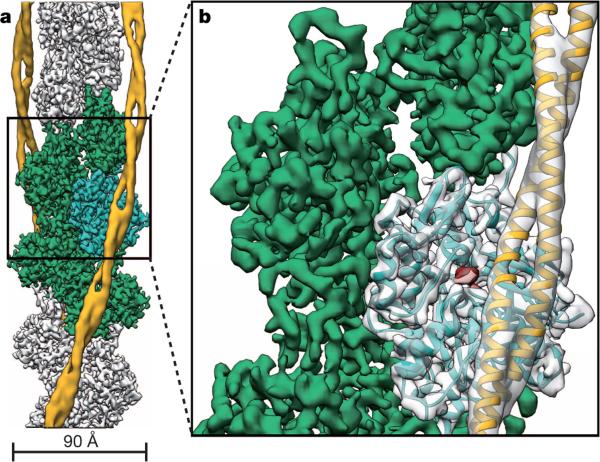
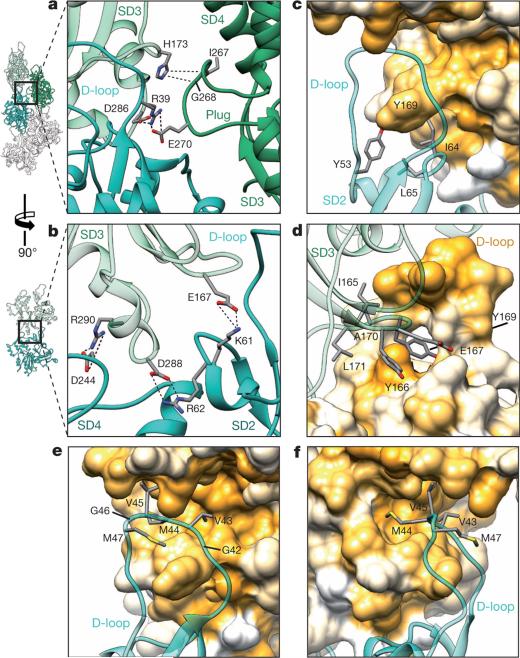
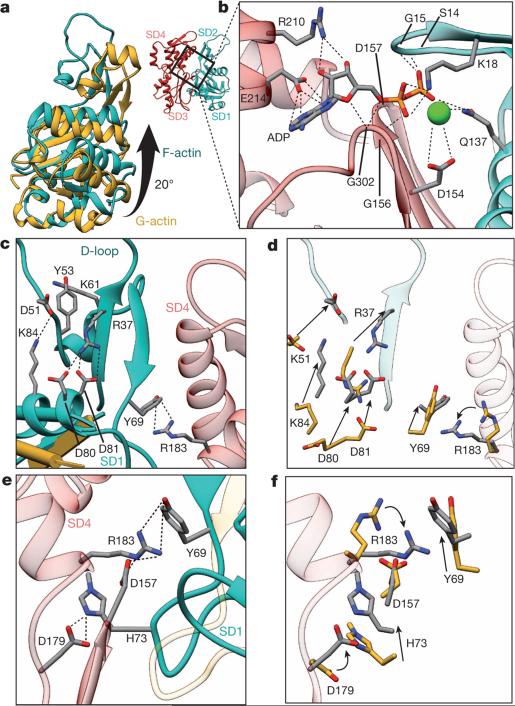
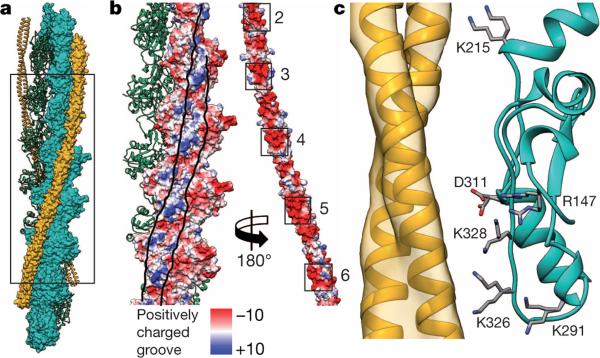
Filamentous actin (F-actin) is the major protein of muscle thin filaments, and actin microfilaments are the main component of the eukaryotic cytoskeleton. Mutations in different actin isoforms lead to early-onset autosomal dominant non-syndromic hearing loss, familial thoracic aortic aneurysms and dissections, and multiple variations of myopathies. In striated muscle fibres, the binding of myosin motors to actin filaments is mainly regulated by tropomyosin and troponin. Tropomyosin also binds to F-actin in smooth muscle and in non-muscle cells and stabilizes and regulates the filaments there in the absence of troponin. Although crystal structures for monomeric actin (G-actin) are available, a high-resolution structure of F-actin is still missing, hampering our understanding of how disease-causing mutations affect the function of thin muscle filaments and microfilaments. Here we report the three-dimensional structure of F-actin at a resolution of 3.7 Å in complex with tropomyosin at a resolution of 6.5 Å, determined by electron cryomicroscopy. The structure reveals that the D-loop is ordered and acts as a central region for hydrophobic and electrostatic interactions that stabilize the F-actin filament. We clearly identify map density corresponding to ADP and Mg(2+) and explain the possible effect of prominent disease-causing mutants. A comparison of F-actin with G-actin reveals the conformational changes during filament formation and identifies the D-loop as their key mediator. We also confirm that negatively charged tropomyosin interacts with a positively charged groove on F-actin. Comparison of the position of tropomyosin in F-actin-tropomyosin with its position in our previously determined F-actin-tropomyosin-myosin structure reveals a myosin-induced transition of tropomyosin. Our results allow us to understand the role of individual mutations in the genesis of actin- and tropomyosin-related diseases and will serve as a strong foundation for the targeted development of drugs.


Figures

Extended Data Figure 1
Extended Data Figure 1. Micrographs and classifications of different data sets
ah, Representative digital micrographs and corresponding representative two-dimensional class averages of F-actin decorated with tropomyosin in amorphous ice (in total 300 class averages of randomly chosen 40,000 phase-flipped segments of in total 109,242 segments from 689 images) (a, b), negatively stained (in total 300 class averages of 27,926 segments from 111 images) (c, d), negatively stained after cross-linking with glutardialdehyde (in total 300 class averages of 27,011 segments from 81 images) (e, f), and a micrograph of negatively stained bare F-actin (in total 100 class averages of 8,371 segments from 40 images) (g, h). Some areas of the micrographs are either filtered or enlarged, as indicated in the figures. Scale bars, 50 nm. Each class average (‘Classifications’) contains 130–200 (cryo data set) or 70–90 (negatively stained data sets) single segments. Scale bars, 10 nm. A boxed region of the digital micrograph in a was band-pass filtered to allow a better visualization of the filaments. Insets in c, e and g show 2× magnified regions of the digital micrographs. i, Two of the class averages depicted in b that show a clear tropomyosin density. The tropomyosin density is indicated by black arrows. Scale bar, 10 nm. j, Comparison of representative class averages of the three negative-stain data sets. Class averages of the data sets with tropomyosin (top panels) show additional density and a larger diameter than bare F-actin (bottom panel). Scale bar, 10 nm. 8,371 segments from 40 images of bare F-actin, 27,926 segments from 111 images of F-actin decorated with tropomyosin, and 27,011 segments from 81 images of F-actin decorated with tropomyosin and cross-linked with glutardialdehyde.
Extended Data Figure 2
Extended Data Figure 2. Resolution of the F-actin–tropomyosin complex
a, FSC curves of different areas of interest by masking (see Methods). The resolution of tropomyosin was estimated using the twice down-sampled data set (2.24 Å per pixel). The FSC0.5 criterion indicates that the tropomyosin electron density map has a resolution of 6.5 Å. The resolution of the final F-actin electron density map is estimated at a resolution of 3.7 Å (FSC0.5). b, Surfaces of F-actin with B-factors (high is red, low is blue; the B-factor indicates the true static or dynamic mobility of an atom) estimated by the reciprocal space refinement in PHENIX. A side view as well as top views on the inward- and outward-facing surfaces, that is, facing the adjacent F-actin subunit inside the filament and oriented to the periphery, respectively, are shown. c, d, Putative structures of the C and N termini (cyan), respectively. Electron density is missing in these regions.
Extended Data Figure 3
Extended Data Figure 3. Representative regions of the F-actin electron density map
a, Overview of the atomic model of an F-actin subunit rainbow-coloured from the N terminus (blue) to the C terminus (red). ADP and the coordinated cation, probably Mg2+, are depicted inside their corresponding electron densities. bd, Side view. Interface between the D-loop (SD2) and the SD3 of the adjacent actin subunit (b), outer two helices of SD1 (c), and inner β-sheet with N terminus (d). e, f, Front view. Connection of SD1 and SD3 (e) and nucleotide binding cleft (f). g, h, Side view. Inner β-sheet of SD3 with one highlighted strand (g) and outer part of SD3 (h). i, j, Back view. SD4 separated in two parts.
Extended Data Figure 4
Extended Data Figure 4. Overview of inter- and intrastrand interactions and hydrophobic D-loop
a, Table of identified residues that are involved in intra- and intermolecular interactions and known mutations. b, Overview of the D-loop bound to the hydrophobic cleft in SD3 of the F-actin molecule on top. Surfaces and residues are coloured from high (yellow) to low (white) hydrophobicity. c, Involved hydrophobic residues of the D-loop. d, e, Modifications in the D-loop, like oxidation of methionine 44 (ref. 20) (c) or mutations of methionine 44 and glycine 46 (M44T, G46G), (d) change the polarity or insert charges and consequently weaken the hydrophobic interactions. Thus, this destabilization of the intrastrand contact is connected to anomalous actin filament assembly and nemaline myopathies,,,–.
Extended Data Figure 5
Extended Data Figure 5. Interstrand and intrastrand F-actin interactions
ae, The interface at the plug involves three residues (R39, E270, D286) that form salt bridges and mediate not only one interstrand contact but also one intrastrand contact. In addition, the orientation of residues 264–269 result in a negatively charged patch that electrostatically interacts with positively charged residues on the opposing actin. a, b, Front and back view of the interface at the plug, respectively. ce, Surface representations (front views in c and d, back view in e) depicting the Coulomb potential, indicating that the interaction of the upper region of the plug with adjacent inter- or intrastrand molecules is mediated by electrostatic interactions. f, Another interstrand contact is formed by residues 110–115 of SD1 and residues 191–199 of SD4 of the adjacent actin. However, no prominent electrostatic or hydrophobic interactions could be identified at this interface.
Extended Data Figure 6
Extended Data Figure 6. Nucleotide binding site and intramolecular interactions
a, Table of identified intramolecular interactions that result in a stabilization of the nucleotide binding cleft, coordination of ADP and a divalent cation. Data are from refs , , , , , , and –. b, Coordination of ADP and Ca2+ in the nucleotide binding cleft in G-actin (PDB accession code 3EL2; ref. 59). ce, Back view of the nucleotide binding cleft of F-actin (cyan) with bound ADP–Mg2+ or ADP–Ca2+ (c), ATP–Ca2+ (d, relative position taken from PDB accession code 3EL2; ref. 59) and conformational changes between the G-actin-ATP and F-actin-ADP state (e). Glutamine 137 is moved closer to ADP, coordinating not only the cation (as in G-actin) but also the nucleotide β-phosphate (c). The presence of ATP instead of ADP in the nucleotide-binding site would be sterically unfavourable, suggesting that a different intermediate conformation exists for F-actin-ATP (d). The shorter distance of glutamine 137 to the γ-phosphate probably induces ATP hydrolysis and then afterwards the cation takes the position of the γ-phosphate in the ADP-state (e). For comparison the position of glutamine 137 in G-actin is shown in yellow and the transition from G-actin to F-actin is depicted by arrows. f, Mutation of glutamine 137 to histidine results in hampered coordination of the ion and the nucleotide and is connected to nemaline myopathies.
Extended Data Figure 7
Extended Data Figure 7. Model of barbed-end and pointed-end binding and G- to F-actin transition based on a comparison of start point (G-actin) and end point (F-actin)
a, b, Binding of new G-actin (yellow, PDB accession code 3EL2; ref. 59) at the barbed end of F-actin (green) is initiated by the intrastrand binding of SD4 of G-actin to SD3 of F-actin (a, side view) and the interstrand binding of SD4 and SD1 (b, front view), respectively. G-actin is overlaid with a subunit of the structure found in F-actin (cyan). The main interstrand contacts are already present at the start of the transition and thereby guide the binding G-actin to its correct position, determining the symmetry of the filament. c, After initial binding the D-loop is trapped in the hydrophobic cleft of SD3 of F-actin and pulls on SD2. F-actin is depicted in surface representation (green). d, Finally, the SD2 and concomitantly SD1 are rotated and the final F-actin conformation is stabilized by various intramolecular interactions (see Figs 2c–f and 3c–f, Extended Data Fig. 6a). e, Owing to the relatively large distance from the SD1 and SD2 subdomains of the newly bound G-actin to the subunit of the opposite strand, the only influence of the opposite strand on the binding of G-actin is at the docking position of the D-loop. The transition of R39 illustrates well the docking of the D-loop. The residue is depicted in both states (G-actin and F-actin). fh, Binding of new G-actin (yellow, PDB accession code 3EL2; ref. 59) at the pointed end of F-actin (green) is initiated by initial intrastrand binding (g) of SD3 of G-actin to SD4 of F-actin at the pointed end and interstrand binding of SD4 to SD3 (h), respectively. Again, the main interstrand contacts are available before the transition of G-actin (yellow) to F-actin (SD1 and SD2 in cyan, SD3 and SD4 are red). i, During binding to F-actin the transition from G-actin to F-actin is initiated by an induced fit of the F-actin D-loop to the hydrophobic cleft of the newly bound G-actin. This leads to a pulling down of the central β-sheet of SD3 of G-actin. j, The β-sheet is thereby straightened and pushes up two adjacent helices of SD1. k, The slight dislocation of these helices is transmitted to other regions of SD1 and thereby emphasized. This leads to a global rotation of SD1, which results in a considerable rotation of SD2 by an angle of 20° and a closure of the nucleotide binding cleft (Fig. 3; see Supplementary Video 3).
Extended Data Figure 8
Extended Data Figure 8. Tropomyosin binding and comparison of reconstructions regarding the tropomyosin position on F-actin
a, Table showing putative residues of F-actin involved in tropomyosin binding and known mutations. be, Reconstructions of F-actin decorated with tropomyosin calculated from: the cryo-EM data set filtered to 15 Å (b), from a negatively stained data set (c), from a negatively stained data set after cross-linking with glutardialdehyde (d), and from negatively stained bare F-actin (e). f, By calculating a difference map between tropomyosin–bare F-actin (blue) and glutardialdehyde–bare F-actin (green), differences in the tropomyosin position on bare F-actin (grey) are visualized. g, Overlay of difference maps showing that the position of tropomyosin in the cryo-EM reconstruction (yellow) corresponds to the tropomyosin position of the negatively stained data set with the cross-linked complex (green). h, Surface of F-actin and tropomyosin (pseudo-repeats 2–6) with the electrostatic Coulomb potentials at pH 7.5 and pH 4 (see also Fig. 4b). Tropomyosin was rotated by 180° and shifted to the right to allow a better view of the F-actin–tropomyosin interface. Difference maps of the glutardialdehyde–bare F-actin and the tropomyosin–bare F-actin map are shown on the F-actin surface at pH 7.5 (left) and pH 4.0 (middle), respectively,.
Extended Data Figure 9
Extended Data Figure 9. Model of tropomyosin transition on F-actin during myosin binding
a, Cryo-EM structure of the F-actin–tropomyosin complex with tropomyosin in the A-state. Tropomyosin (yellow, A-state), F-actin (green). bd, Initial weak binding of myosin (magenta, PDB accession code 1LKX; ref. 66) to the F-actin–tropomyosin filament in the absence of troponin. Most of the myosin binding sites on F-actin are not occupied by tropomyosin and only loop 4 and the cardiomyopathy loop are sterically hindered from binding to the F-actin filament (b). Actin-induced closure of the 50 kDa cleft of myosin (c) results in a strong binding of myosin and tropomyosin moves to its M-state position (blue) (d). eg, Actin–tropomyosin–myosin complex in the rigor state (PDB accession code 4A7H; ref. 8). Myosin is shown in red. hl, There are two possible ways for the transition of tropomyosin from the A-state to the M-state. Tropomyosin either rolls (i, j) or slides (k, l) from one to the other position. Rolling would involve an azimuthal rotation of ~16° with respect to the F-actin axis (inset of j) and a left-handed rotation of ~70° (indicated by solid arrows) or a right-handed rotation of ~110° (indicated by dotted arrows) with respect to its own axis (i, j). Sliding would imply not only an azimuthal shift of ~12 Å (indicated by white arrows in k), but also a tremendous shift of a half-tropomyosin repeat (that is, ~35 Å) along the F-actin filament (k, l). The radius to the filament axis would be preserved in both situations. The inset of l depicts the vectors for a shifting transition of tropomyosin: an azimuthal and longitudinal shift of 12 Å and 35 Å, resulting in an overall shift of 37 Å.
Figure 1
Figure 1. Cryo-EM structure of F-actin decorated with tropomyosin
a, Full cryo-EM reconstruction of F-actin (grey, with five central subunits in green and one subunit in cyan) decorated with tropomyosin (yellow). b, Close-up view of a with the atomic and molecular model of an F-actin subunit (cyan) and tropomyosin (yellow) and their corresponding densities, respectively. The density corresponding to ADP is depicted in red.
Figure 2
Figure 2. Filament stability by intrastrand and interstrand interactions
af, Neighbouring F-actin subunits stabilize the F-actin filament by interaction through salt bridges (a, b) and by hydrophobic interactions (cf). The central F-actin subunit is depicted in cyan, and adjacent subunits are shown in shades of green. Surfaces are coloured from high (yellow) to low (white) hydrophobicity. Oxygen is coloured red, nitrogen is blue, carbon is grey and hydrogen is colourless. Interactions between amino acids are highlighted with dotted lines. a, Interstrand and intrastrand salt bridges of three actin subunits involving the plug. b, Several intrastrand salt bridges at the actin–actin interface. cf, Front view (c, e), back view (d) and side view (f) of the D-loop interacting with the SD3 of the neighbouring intrastrand F-actin subunit. The D-loop wraps around Y169 of the neighbouring subunit and other residues snugly fit into the groove formed by regions adjacent to the D-loop (c, d), resembling a lock-and-key interaction. In addition, a prominent hydrophobic patch in the D-loop interacts with a hydrophobic groove on the neighbouring F-actin subunit (e, f).
Figure 3
Figure 3. G-actin to F-actin transition
a, A global rotation of SD1 and SD2 leads to a flattening of G-actin (yellow) during transition to F-actin (cyan). b, Coordination of ADP and a cation in the nucleotide binding cleft in F-actin (SD1–SD2 cyan, SD3–SD4 red). The cation is most probably Mg2+. However, Ca2+ cannot be excluded as the coordinated cation because the actin was purified in Ca2+-containing buffer. cf, The conformation of F-actin is finally stabilized by intramolecular interactions between SD2, SD1 and SD4 (c, e). Most of the residues involved in the stabilization of the F-actin conformation show a considerable movement during the transition between G-actin and F-actin (d, f). a, G-actin with defined D-loop for better visualization; PDB accession code 1J6Z. cf, ATP-bound G-actin; PDB accession code 3EL2.
Figure 4
Figure 4. F-actin interaction with tropomyosin
a, Structural overview of an F-actin filament (green and cyan) decorated with tropomyosin (yellow). Half of the filament is shown in surface representation. The N and C termini of F-actin are included in this model. b, Surface of F-actin and tropomyosin (pseudo-repeats 2–6) with the electrostatic Coulomb potentials ranging from −10 kcal mol−1 to +10 kcal mol−1 at pH 7.5. Tropomyosin was rotated by 180° and shifted to the right to allow a better view on the F-actin–tropomyosin interface, which is delimited by lines drawn onto the surfaces. The overall negatively charged tropomyosin interacts with a positively charged groove on F-actin. c, Several charged residues of actin are within distances that would make it possible to interact with tropomyosin via putative salt bridges. Different rotamers (orientations of a residue) of the same residue are shown to indicate how F-actin subunits could adjust to the surfaces of different tropomyosin pseudo-repeats.

References

    1. van Wijk E, et al. A mutation in the gamma actin 1 (ACTG1) gene causes autosomal dominant hearing loss (DFNA20/26). J. Med. Genet. 2003;40:879–884. - PMC - PubMed
    1. Milewicz DM, et al. Genetic basis of thoracic aortic aneurysms and dissections: focus on smooth muscle cell contractile dysfunction. Annu. Rev. Genomics Hum. Genet. 2008;9:283–302. - PubMed
    1. Sparrow JC, et al. Muscle disease caused by mutations in the skeletal muscle alpha-actin gene (ACTA1). Neuromuscul. Disord. 2003;13:519–531. - PubMed
    1. Gordon AM, Homsher E, Regnier M. Regulation of contraction in striated muscle. Physiol. Rev. 2000;80:853–924. - PubMed
    1. Maytum R, Lehrer SS, Geeves MA. Cooperativity and switching within the three-state model of muscle regulation. Biochemistry. 1999;38:1102–1110. - PubMed

Publication types

Associated data