Review
. 2015 Mar;88(1047):20140470.
doi: 10.1259/bjr.20140470. Epub 2014 Dec 4.

Cardiac MR assessment of microvascular obstruction

Affiliations
Review

Cardiac MR assessment of microvascular obstruction

A Abbas et al. Br J Radiol. 2015 Mar.

Abstract

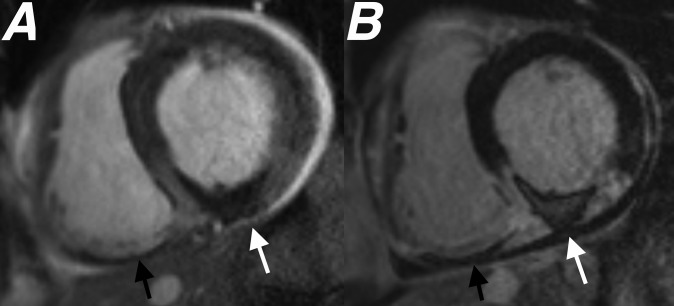
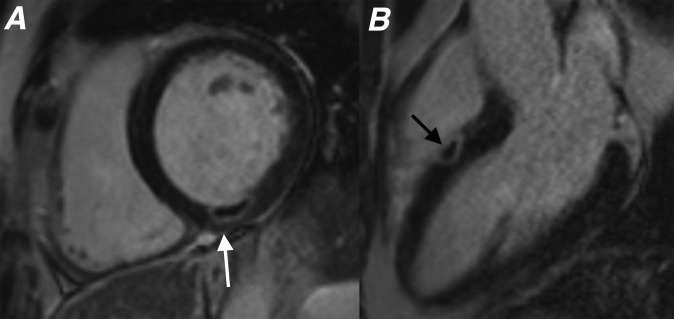
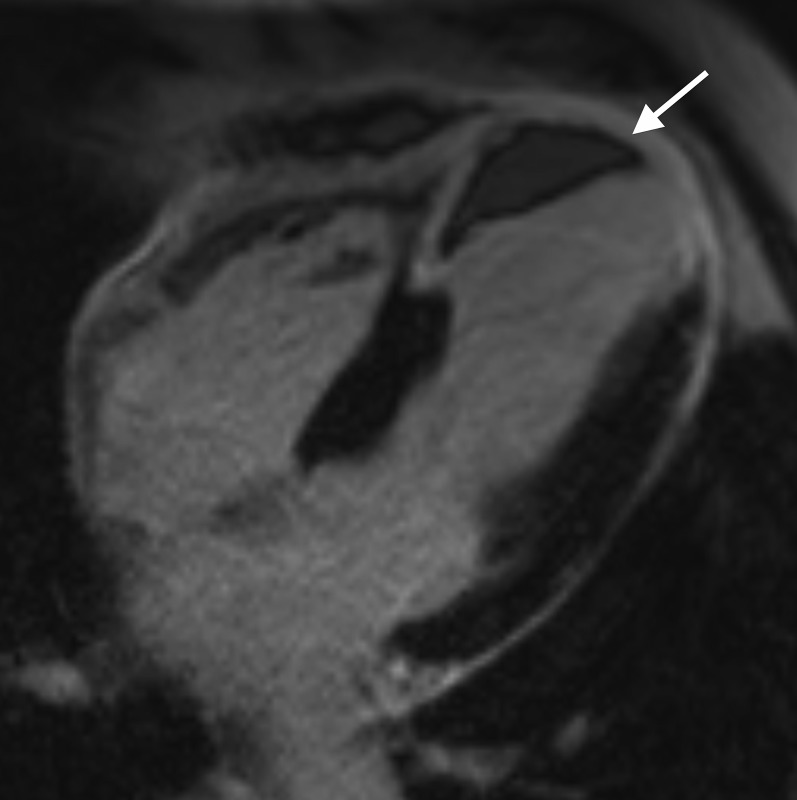
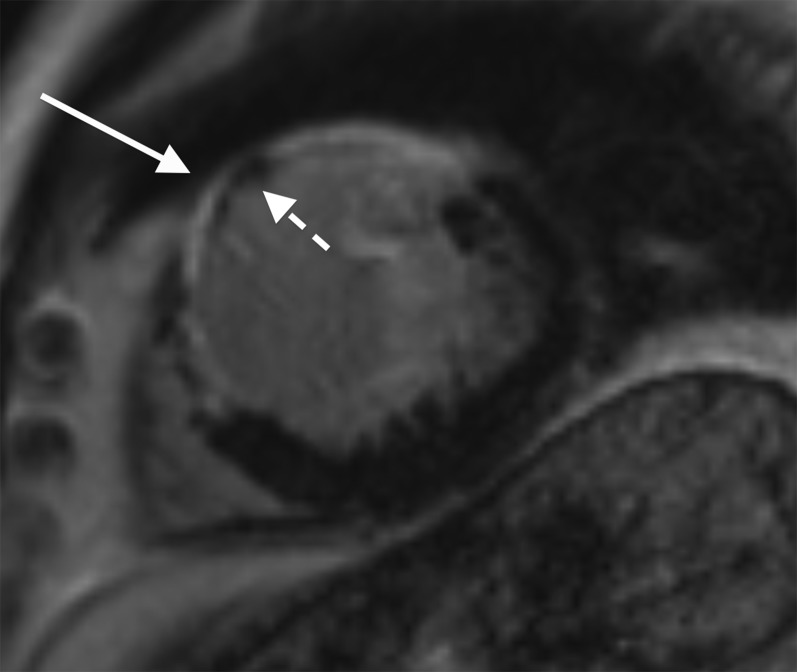
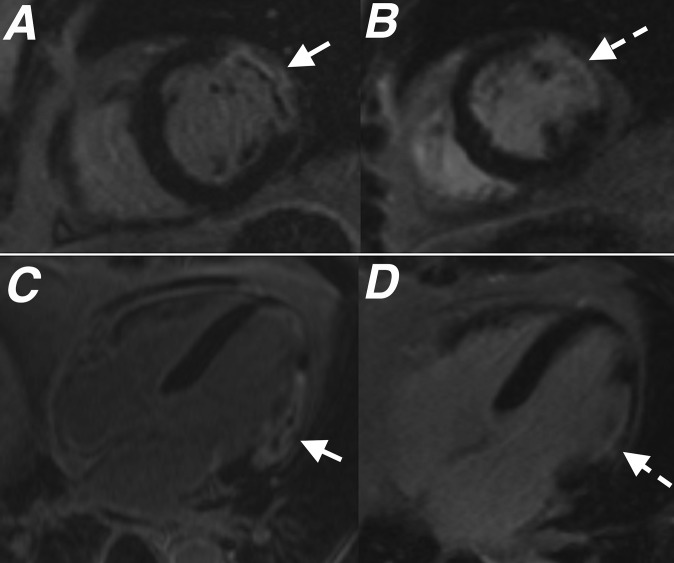
Microvascular obstruction (MVO) is usually seen in a proportion of patients with acute myocardial infarction following reperfusion therapy of an occluded coronary artery. It is characterized by damage and dysfunction of the myocardial microvasculature with a no-reflow phenomenon within the infarct zone. While MVO may be demonstrated via a number of different imaging modalities, cardiac MR (CMR) enables accurate identification of MVO and also permits assessment of infarct extent and overall left ventricular function during the same imaging examination. We present a pictorial review of the characteristic appearances of MVO on CMR and highlight the importance of this imaging diagnosis for patient outcome following acute myocardial infarction.


Figures

Figure 1.
Figure 1.
Standard cardiac MR protocol used for patients being assessed for possible microvascular obstruction. EGE, early gadolinium enhancement; LGE, late gadolinium enhancement; LV, left ventricle; SSFP, steady state free procession.
Figure 2.
Figure 2.
Cardiac MR acquired 4 days following delayed presentation acute ST elevation myocardial infarction to evaluate for myocardial viability. Images from (a) short axis resting first-pass perfusion sequence, (b) short axis steady-state free-procession sequence acquired 3 min post gadolinium injection, and (c) short axis late gadolinium enhancement (LGE) sequence, all acquired at the mid left ventricular level and (d) three-chamber LGE sequence showing a focal area of microvascular obstruction within the mid inferolateral left ventricular wall (white arrows). Metal artefact related to previous sternotomy wires is also evident (interrupted white arrow). The measured ejection fraction was 42%.
Figure 3.
Figure 3.
Cardiac MR performed in a patient 3 days post primary percutaneous coronary intervention to the left anterior descending coronary artery. Two-chamber long axis late gadolinium enhancement sequence showing full thickness infarct involving the entire anterior left ventricular wall extending onto the apex (white arrow). Subendocardial low signal within the infarct corresponds to a large region of microvascular obstruction. The measured ejection fraction was 25%.
Figure 4.
Figure 4.
Cardiac MR performed following a late presentation ST elevation myocardial infarction. Short axis late gadolinium enhancement sequence performed at mid left ventricle level showing an extensive area of microvascular obstruction (MVO) within the septal wall extending onto the anterior wall (white arrow heads) with only a very limited rim of late enhancement (interrupted white arrow). Note the marked difference in appearance between the nulled normal myocardium of the lateral wall (white arrow) and the site of MVO within the septal wall. The measured ejection fraction was 27%.
Figure 5.
Figure 5.
Cardiac MR performed 4 days after primary percutaneous coronary intervention to the right coronary artery. Images from (a) short axis steady-state free-procession cine sequence performed 3 min following gadolinium injection and (b) short axis late gadolinium enhancement study both performed at basal left ventricular level showing a large area of microvascular obstruction (MVO) within the inferior left ventricular wall (white arrows). An additional area of MVO is seen within the inferior right ventricular wall (black arrows), highlighting that MVO is not just limited to infarcts involving the left ventricle. The measured ejection fraction was 46%.
Figure 6.
Figure 6.
Cardiac MR study performed within 10 days following myocardial radiofrequency ablation therapy in two different patients. (a) Short axis late gadolinium enhancement (LGE) sequence showing focal area of microvascular obstruction (MVO) within the inferior wall (white arrow) corresponding to the site of recent ablation. (b) Three-chamber long axis LGE showing small focus of MVO in the septal left ventricular wall (black arrow) following ablation performed via the right ventricle. The tiny focal region of myocardial involvement is typical for MVO associated with myocardial thermal ablation.
Figure 7.
Figure 7.
Four-chamber late gadolinium enhancement image showing a full thickness infarct involving the distal septal left ventricular wall and apex. An intracavitary left ventricular thrombus (white arrow) is seen abutting the distal septal left ventricle wall. Note how the low signal thrombus lies against the myocardial wall unlike microvascular obstruction, where the low signal is seen within the myocardium.
Figure 8.
Figure 8.
Short axis late gadolinium enhancement sequence acquired at the mid left ventricular level showing a full thickness infarct involving the anterior and anteroseptal left ventricular wall (white arrow). Areas of low signal within the myocardium at the site of infarct (interrupted arrow) corresponded with foci of calcification seen on a previous CT in keeping with a calcified myocardial infarct. Note that unlike patients with microvascular obstruction, the myocardium is significantly thinned in patients with a long-standing calcified infarct.
Figure 9.
Figure 9.
Images from (a) short axis late gadolinium enhancement (LGE) and (c) four-chamber LGE performed 2 days following acute infarct show a full thickness infarct within the anterolateral left ventricular wall with a central area of microvascular obstruction (MVO) (white arrows). Images from (b) short axis LGE and (d) four-chamber LGE taken from the follow-up cardiac MR performed 2 months later show infarct with thinning of the anterolateral wall and resolution of MVO (interrupted white arrows).

References

    1. Nijveldt R, Hofman MB, Hirsch A, Beek AM, Umans VA, Algra PR, et al. . Assessment of microvascular obstruction and prediction of short-term remodelling after acute myocardial infarction: cardiac MR imaging study. Radiology 2009; 250: 363–70. doi: 10.1148/radiol.2502080739 - DOI - PubMed
    1. Rajiah P, Desai MY, Kwon D, Flamm SD. MR imaging of myocardial infarction. Radiographics 2013; 33: 1383–412. doi: 10.1148/rg.335125722 - DOI - PubMed
    1. Wu KC. CMR of microvascular obstruction and hemorrhage in myocardial infarction. J Cardiovasc Magn Reson 2012; 14: 68. doi: 10.1186/1532-429X-14-68 - DOI - PMC - PubMed
    1. Weir RA, Murphy CA, Petrie CJ, Martin TN, Balmain S, Clements S, et al. . Microvascular obstruction remains a portent of adverse remodeling in optimally treated patients with left ventricular systolic dysfunction after acute myocardial infarction. Circ Cardiovasc Imaging 2010; 3: 360–7. doi: 10.1161/CIRCIMAGING.109.897439 - DOI - PubMed
    1. Kidambi A, Mather AN, Motwani M, Swoboda P, Uddin A, Greenwood JP, et al. . The effect of microvascular obstruction and intramyocardial hemorrhage on contractile recovery in reperfused myocardial infarction: insights from cardiovascular magnetic resonance. J Cardiovasc Magn Reson 2013; 15: 58. doi: 10.1186/1532-429X-15-58 - DOI - PMC - PubMed

MeSH terms