

Low income, community poverty and risk of end stage renal disease
- PMID: 25471628
- PMCID: PMC4269852
- DOI: 10.1186/1471-2369-15-192
Low income, community poverty and risk of end stage renal disease
Abstract
Background: The risk of end stage renal disease (ESRD) is increased among individuals with low income and in low income communities. However, few studies have examined the relation of both individual and community socioeconomic status (SES) with incident ESRD.
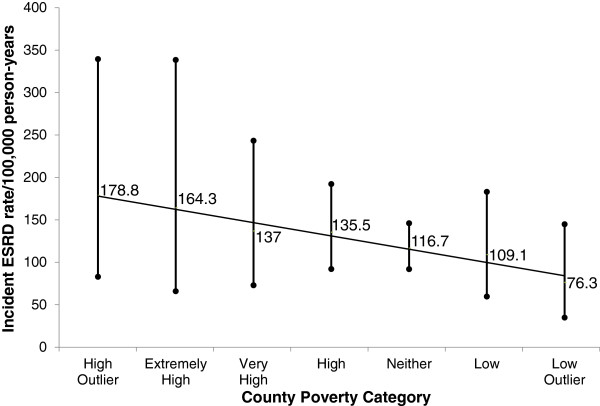
Methods: Among 23,314 U.S. adults in the population-based Reasons for Geographic and Racial Differences in Stroke study, we assessed participant differences across geospatially-linked categories of county poverty [outlier poverty, extremely high poverty, very high poverty, high poverty, neither (reference), high affluence and outlier affluence]. Multivariable Cox proportional hazards models were used to examine associations of annual household income and geospatially-linked county poverty measures with incident ESRD, while accounting for death as a competing event using the Fine and Gray method.
Results: There were 158 ESRD cases during follow-up. Incident ESRD rates were 178.8 per 100,000 person-years (105 py) in high poverty outlier counties and were 76.3 /105 py in affluent outlier counties, p trend=0.06. In unadjusted competing risk models, persons residing in high poverty outlier counties had higher incidence of ESRD (which was not statistically significant) when compared to those persons residing in counties with neither high poverty nor affluence [hazard ratio (HR) 1.54, 95% Confidence Interval (CI) 0.75-3.20]. This association was markedly attenuated following adjustment for socio-demographic factors (age, sex, race, education, and income); HR 0.96, 95% CI 0.46-2.00. However, in the same adjusted model, income was independently associated with risk of ESRD [HR 3.75, 95% CI 1.62-8.64, comparing the <$20,000 income group to the >$75,000 group]. There were no statistically significant associations of county measures of poverty with incident ESRD, and no evidence of effect modification.
Conclusions: In contrast to annual family income, geospatially-linked measures of county poverty have little relation with risk of ESRD. Efforts to mitigate socioeconomic disparities in kidney disease may be best appropriated at the individual level.
Figures
References
-
- Galobardes B, Shaw M, Lawlor DA, Davey Smith G, Lynch J. Methods in Social Epidemiology 1st Edition. San Francisco: Jossey-Bass; 2006.
-
- Coresh J, Wei GL, McQuillan G, Brancati FL, Levey AS, Jones C, Klag MJ. Prevalence of high blood pressure and elevated serum creatinine level in the United States: findings from the third National Health and Nutrition Examination Survey (1988-1994) Arch Intern Med. 2001;161(9):1207–1216. doi: 10.1001/archinte.161.9.1207. - DOI - PubMed
-
- Robbins JM, Vaccarino V, Zhang H, Kasl SV. Socioeconomic status and type 2 diabetes in African American and non-Hispanic white women and men: evidence from the Third National Health and Nutrition Examination Survey. Am J Public Health. 2001;91(1):76–83. doi: 10.2105/AJPH.91.1.76. - DOI - PMC - PubMed
Pre-publication history
-
- The pre-publication history for this paper can be accessed here:http://www.biomedcentral.com/1471-2369/15/192/prepub
Publication types
MeSH terms
Grants and funding
LinkOut - more resources
Full Text Sources
Other Literature Sources
Medical
