. 2014 Dec 4;516(7529):56-61.
doi: 10.1038/nature13920.

Deconstructing transcriptional heterogeneity in pluripotent stem cells

Affiliations

Deconstructing transcriptional heterogeneity in pluripotent stem cells

Roshan M Kumar et al. Nature. .

Abstract

Pluripotent stem cells (PSCs) are capable of dynamic interconversion between distinct substates; however, the regulatory circuits specifying these states and enabling transitions between them are not well understood. Here we set out to characterize transcriptional heterogeneity in mouse PSCs by single-cell expression profiling under different chemical and genetic perturbations. Signalling factors and developmental regulators show highly variable expression, with expression states for some variable genes heritable through multiple cell divisions. Expression variability and population heterogeneity can be influenced by perturbation of signalling pathways and chromatin regulators. Notably, either removal of mature microRNAs or pharmacological blockage of signalling pathways drives PSCs into a low-noise ground state characterized by a reconfigured pluripotency network, enhanced self-renewal and a distinct chromatin state, an effect mediated by opposing microRNA families acting on the Myc/Lin28/let-7 axis. These data provide insight into the nature of transcriptional heterogeneity in PSCs.


Figures
Extended Data Figure 1
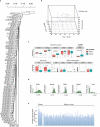
Extended Data Figure 1. Quality control of single-cell RNA-Seq data
(A) A combination of read alignment rate (y-axis) and number of genes detected (lnTPM > 1) (x-axis) was used to identify outlier cells (red circles) to remove from subsequent analysis, leaving 183 single mESCs cultured in serum+LIF, 94 mESCs cultured in 2i+LIF, and 84 Dgcr8KO mESCs cultured in serum+LIF that were analyzed by single-cell RNA-Seq in this study (blue circles). (B) Correlation in mean expression in detected cells (Mu) between replicate FBS+LIF plates across a range of alpha thresholds. Mu was calculated separately for each plate. Correlations in mu were calculated after limiting genes to those with alphas exceeding the specified threshold on the x-axis. (C) Maximum gene expression in replicate plates. Genes not reliably detected as defined in the text are colored red. (D) Comparison of alpha estimates in replicate plates, limited to reliably detected genes. Selected lineage regulators are denoted. (E) Comparison of Mu estimates in replicate plates, limited to reliably detected genes. Selected housekeeping, pluripotency, and signaling genes are denoted. (F) (Top) Relationship between estimates of alpha (x-axis) and mu (y-axis) of all genes based on both plates of mESC in FBS+LIF. Undetected genes are colored yellow. (Bottom) Same as above except only showing reliably detected genes, and overlaid with density contour (red lines).
Extended Data Figure 2
Extended Data Figure 2. Examination of mESCs cultured in serum+LIF for the presence of distinct subpopulations
(A) Hierarchical clustering dendogram of single-cell RNA-Seq data for 183 mESCs cultured in serum+LIF. (B) Principal component analysis of the 183 mESCs cultured in serum+LIF.. Points colored blue are those with PCA1 values < −25, which are classified as outlier cells. (C) Boxplots of expression of selected pluripotency regulators and the lineage regulator Pax3 (top), and genes associated with EpiSCs (bottom). ‘Normal’ indicates the majority of cells colored as grey dots in ED Figure 2B, and ‘Outliers’ indicates the distinct set of 14 cells colored blue in ED Figure 2B. P-values for statistically significant differences are shown. (D) Histograms showing the expression distributions of pluripotency regulators previously found to fluctuate within mESC populations. Cutoffs to divide expression into high and low states to test for enrichment within outlier cells are indicated by dashed lines. (E) Average expression of Polycomb target genes within outlier cells (left), and the majority of the mESCs cultured in serum+LIF (right).
Extended Data Figure 3
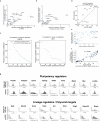
Extended Data Figure 3. Correlation of single-cell expression measurements between different technologies
(A) Correlation between transcripts per million (TPM) measured by single-cell RNA-Seq and transcripts per cell measured by single-molecule FISH for 14 selected genes in mESCs cultured in serum+LIF. Error bars represent standard deviations of measurements. (B) Correlation between coefficients of variation measured by single-cell RNA-Seq and FISH for the 14 genes shown in (A). (C) Correlation coefficients for α (fraction detected, left) or μ (mean expression in detected cells, right) between single-molecule FISH and single-cell RNA-Seq are plotted as a function of varying the threshold level for detection by RNA FISH (x-axis). An RNA FISH detection threshold of 10 indicates that genes expressed at < 10 copies per cell would not be detected by RNA FISH. Correlation for α between RNA-Seq and RNA FISH peaked at an RNA FISH detection threshold of > 5 transcripts per cell, giving an estimated single-cell RNA-Seq detection efficiency of ~20% (1 out of 5 transcripts detected, assuming single-molecule sensitivity for the RNA FISH method). (D) Correlation in α between single-cell RNA-Seq and single-molecule FISH for 14 genes measured by both methods, assuming a single-molecule FISH detection threshold of > 5 transcripts per cell. Dashed line shows linear fit to the data. The fraction of cells a gene is detected in shows good agreement between the two methods when taking the sensitivity of the RNA-Seq into account. (E) Comparison of the fraction of mESCs cultured in serum+LIF a gene was detected in by single-cell qPCR (x-axis) or single-cell RNA-Seq (y-axis). Single-cell RNA-Seq showed greater sensitivity overall as compared to single-cell qPCR, but a set of genes was sporadically expressed as measured by both methods. Trendline indicates linear fit to the data. (F) Correlations of fraction detected between independent biological replicates for 96 genes profiled by single-cell QPCR. Trendline shows linear fit to the data, and indicates that the fraction of cells a gene is detected in remains consistent across independent biological replicates. (G) Comparison of expression distributions measured by single-cell RNA-Seq (light grey) and single-molecule FISH (darker grey) for pluripotency regulators (top) and Polycomb target genes (bottom).
Extended Data Figure 4
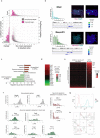
Extended Data Figure 4. Expression of Polycomb target genes in ESCs and NPCs
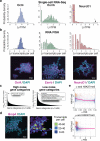
(A) Polycomb target genes show highly variable expression in mESCs. Relationship between μ (mean expression in detected cells, x-axis) and coefficient of variation (standard deviation normalized by mean expression in all cells, y-axis) is shown for Polycomb target genes (purple) and non-Polycomb target genes (grey). Distributions for μ and coefficients of variation for the two gene sets are shown above and to the left of the graph, respectively. Polycomb target genes show pronounced variability in expression, even when controlling for expression level. (B) Expression of the neural regulators and Polycomb target genes Otx2 (top) and NeuroD1 (bottom) measured by RNA FISH in mESCs cultured in serum+LIF. (left). Overall distributions within the population and representative colonies are shown, along with gene tracks from IGV showing ChIP-Seq reads for H3K27me3 at the Otx2 and NeuroD1 genes. (C) Enriched gene ontology categories among genes significantly upregulated (red) or downregulated (green) in neural precursor cells as compared to embryonic stem cells. (D) Expression changes of selected genes in neural precursor cells as compared to the embryonic stem cells they were derived from. As expected, neural regulators and ES Polycomb target genes Pax6, Prrx1, Hes1, Msx1, Pbx3, Nes, and Runx1 were upregulated in NPCs, while the pluripotency regulators Esrrb, Nr0b1, Pou5f1 (Oct4), Zfp42 (Rex1), and Nanog were downregulated. Expression of the housekeeping genes Gapdh and Actb, and the pluripotency and neural regulator Sox2, were relatively unchanged between the two cell types. (E) Expression comparison of ES Polycomb target genes that are detected in either mESCs or NPCs. Many Polycomb target genes that are neuronal regulators are detected in a higher fraction of NPCs than ESCs, while certain Polycomb targets such as Pax3 (a regulator of musculosketal development) are detected in a smaller fraction of cells. Genes are ordered in ascending order of ESC to NPC average expression change. (F) Histograms showing distributions of expression levels for selected housekeeping genes (left) and neuronal regulators (center and right) in NPCs. The neuronal regulators Msx1 and Runx1 show bimodal expression in NPCs. (G) Distance distributions within ESC (red) and NPC (blue) populations. NPCs show more population heterogeneity than ESCs. (H) State classification based on principal component analysis of single-cell RNA-Seq of NPCs. Four distinct states are identified.
Extended Data Figure 5
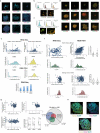
Extended Data Figure 5. Fluctuations in pluripotency and lineage regulator expression
(A) RNA FISH images showing expression of Nanog (top), Nr0b1 (middle), and Esrrb (bottom) in individual colonies or regions of cells. (B, C) Histograms show distributions of fluorescence intensities within individual cells from quantitative immunofluorescence of Oct4 and (B) Nanog, or (C) Nr0b1, along with Nanog / Oct4 or Nr0b1 / Oct4 ratios as indicated. For Nanog / Oct4 images (B), Nanog staining is colored green while Oct4 staining is colored red. In the panel on the left a cluster of low Nanog cells is indicated by a blue arrow, while a cluster of high Nanog cells is indicated by a white arrow. In the panel on the right, the same image is shown with DAPI staining colored blue, and groups of Oct4 negative / Nanog negative differentiated cells that may have arisen from the low Nanog cells are indicated with gray arrows. For Nr0b1 / Oct4 images (C), Nr0b1 is colored green while Oct4 staining is colored red. A relatively high Nr0b1 colony is shown in the panel on the left, while a region of low Nr0b1 cells is displayed in the panel on the right. (D) Quantitative immunofluorescence images showing expression of Oct4 (red) and Nr0b1 (top row), Nanog (middle row), or Esrrb (bottom row) within individual colonies of mESCs grown in serum+LIF. Oct4 is used as an internal reference as it shows relatively invariant expression within mESCs. (E) Single-cell RNA-Seq relationships for gene pairs shown in Figure 2G. Distributions of gene expression from RNA-Seq and RNA FISH experiments are shown. Dashed lines indicate divisions between high and low states for box plot shown in Figure 2G. Single-cell RNA-Seq data shows that the subset of cells in both a high Sox2 and low Nr0b1 state show an increased probability of expressing NeuroD1 (LnTPM >1) as compared to all cells (bottom). (F) RNA-Seq (left) and RNA FISH (right) correlations between the pluripotency regulator Esrrb and the signaling factor Bmp4 (top) and the pluripotency regulator Nanog and the neural regulator Otx2 (bottom). Dashed lines indicate divisions between high and low states for the box plots shown on the right. (G) Correlations from single-cell RNA-Seq data between average Polycomb target gene expression and Zfp42 (Rex1), Nanog, and Nr0b1 (Dax1). Dashed lines indicate divisions between high and low states for the box plot comparing Polycomb target expression with expression of the three regulators, which are all negatively associated with expression of Polycomb targets. The Venn diagram shows coupling between high and low states of the three regulators. Low Nr0b1 cells are more likely to be in a low Zfp42 and/or low Nanog state as compared to high Nr0b1 cells, suggesting that Nr0b1 functions to maintain Zfp42 and Nanog expression and repress Polycomb target genes. (H) RNA FISH images of an ESC colony hybridized with probes against Nanog (yellow) and Otx2 (magenta), showing inverse relationship between Nanog and Otx2 expression.
Extended Data Figure 6
Extended Data Figure 6. Single-cell QPCR of mESCs exposed to chemical and genetic perturbations
(A) Shown are the average Ct values and standard deviations for technical triplicates (error bars on x-axis) or biological triplicates (error bars on y-axis) across 96 genes for pools of 100 or 10 cells or single sorted cells. Cells were sorted into PCR strips containing RT-PCR reagents and primer pools, reverse transcription and pre-amplification was performed, and cDNA was quantified on a Fluidigm BioMark PCR system. (B) Heat map of single-cell qPCR data for 84 genes examined across 19 different PSC perturbations and in MEFs (n = 1,144 single cells). Unsupervised hierarchical clustering grouped genes into three clusters: bimodally-expressed genes (right group), ubiquitously-expressed genes (left group), and sporadically-expressed genes (middle group). (C) Numbers of genes showing significant changes in expression distributions as compared to the reference conditions of v6.5 mESCs cultured in serum+LIF on MEFs. Significance of changes was determined by the two-sample Kolmogorov-Smirnov test, correcting P-values for multiple tests using the Holm method. (D) Selection of the state classification model that maximizes the Bayesian Information Criteria (BIC, y-axis). Mclust was used to generate multivariate Gaussian mixture models of the first three principal components of the Fluidigm qPCR-based expression values of individual mESCs. The models vary in the number of components (one to ten) and the following geometric characteristics: volume, shape, and orientation as described49. The best model was used to classify cells into states.
Extended Data Figure 7
Extended Data Figure 7. Gene expression changes in mESCs upon culture in 2i or removal of mature miRNAs
(A) Changes in expression of the pluripotency regulators shown in Figure 4C going from serum+LIF to 2i+LIF culture (x-axis), or between wild-type and Dgcr8KO cells cultured in serum+LIF (y-axis), as measured by single-cell RNA-Seq. Selected genes are highlighted. (B) Changes in expression of 18 commonly used housekeeping genes (ActB, Aip, Cxxc1, Gapdh, Gusb, Hmbs, Hprt, Ipo8, Mrpl48, Mtcp1, Pgk1, Ppia, Rpl13a, Rplp2, Rps6, Tbp, Ubc, and Ywhaz) between the same conditions as in A. (C) Intra- (left) and inter- (right) condition distances between individual cells based on single-cell RNA-Seq data for all genes (top), 219 transcription factors that regulate pluripotent cells as determined by CellNet50 (middle), or lineage regulators, defined as the 256 previously determined Polycomb target genes in mESCs that are transcription factors (bottom). (D) Comparison of single-cell average expression changes going from serum+LIF to 2i+LIF culture in the present study (x-axis) against population-level expression changes between mESCs cultured in serum+LIF versus 2i+LIF measured by Marks et al. (y-axis). Trendline from linear fit to the data is shown, and selected genes that show lower expression in 2i+LIF culture in both studies are highlighted. (E) Single-molecule FISH showing shifts in expression of Oct4, Nanog,Nr0b1, and Otx2 at the RNA level between wt mESCs in serum+LIF and 2i+LIF culture conditions and Dgcr8KO mESCs cultured in serum+LIF. (F) Representative RNA FISH images showing expression of the Polycomb target gene and neural regulator Otx2 in individual mESC colonies under the three conditions examined. (G) Correlation between expression shifts between serum+LIF and 2i+LIF culture observed by single-cell RNA-Seq (x-axis) and RNA FISH (y-axis) for the 14 genes shown in Extended Data Figure 4A. Trendline indicates linear fit to the data. (H) Quantitative immunofluorescence showing changes in Nanog / Oct4 (left) and Nr0b1 / Oct4 (right) ratios between serum+LIF and 2i+LIF culture. Serum+LIF data is the same shown in Extended Data Figure 9. (I) RNA FISH images of E14 mESC colonies cultured in serum+LIF (left) or 2i+LIF (right) media and probed for Nanog (top) or Esrrb (bottom) expression. Both Nanog and Esrrb show bimodal expression patterns in E14 mESCs grown in serum+LIF, and shift towards the high expression state in 2i+LIF culture. White arrows indicate regions of low Nanog or Esrrb expression in mESCs grown in serum+LIF.
Extended Data Figure 8
Extended Data Figure 8. Dependence of Polycomb target gene expression on culture conditions and miRNAs
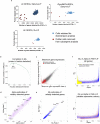
(A) Fraction of Polycomb target genes detected in wt mESCs cultured in serum+LIF (red) or 2i+LIF (green), or Dgcr8−/− mESCs cultured in serum+LIF (blue). (B) Correlation between Polycomb target gene expression and pluripotency regulator expression in different conditions. Displayed are the Pearson correlation coefficients (PCC) between pluripotency-related regulator z-score and proportion of Polycomb targets detected, computed across all single cells. The z-score is defined as the number of standard deviations that a sample exceeds (z-score>0) or is less than (<0) the mean value. Z-scores for pluripotency regulators were computed for each condition separately. A high PCC indicates that a higher factor expression (relative to its mean in the condition) increases the likelihood that Polycomb targets will be detected as expressed (e.g., Zfx in FBS+Lif). (C) Scatter plots comparing amount of H3K9me3 (top) H3K27ac (middle), and RNA polymerase II (bottom) at promoter regions in wt mESCs cultured in serum+LIF versus 2i+LIF conditions, wt mESCs versus Dgcr8KO mESCs cultured in serum+LIF, or Dgcr8KO mESCs cultured in serum+LIF versus wt mESCs cultured in 2i+LIF as indicated. ChIP-Seq reads at gene promoters were median normalized for comparison, and Polycomb target genes are indicated in green. Unlike H3K27me3, levels of these three factors do not show a strong decrease at Polycomb target genes under 2i+LIF conditions and in Dgcr8KO mESCs (compare to Figure 4E).
Extended Data Figure 9
Extended Data Figure 9. Perturbing miRNA balance and the c-myc / Lin28 / let-7 axis
(A) Purified RNA from v6.5 mESCs and E14 mESCs cultured in either serum+LIF or 2i+LIF conditions was extracted and reverse-transcribed with TaqMan primers specific to the indicated miRNAs, and then expression was profiled by QPCR. Error bars represent standard deviation from technical triplicate PCR reactions, and samples are normalized to a basket of reference small noncoding RNAs and the decrease in Ct values compared to v6.5 mESCs grown in serum+LIF is shown. See Materials and Methods for full details. (B) Fold-change in expression of the indicated miRNAs in wild-type mESCs cultured in serum+LIF or 2i+LIF, induced and uninduced iLet-7 mESCs cultured in serum+LIF, and MEFs grown under standard conditions. Changes are shown relative to v6.5 mESCs grown in serum+LIF. (C) Comparison of genes that change in expression upon introduction of the ESCC miRNA miR-294 to Dgcr8−/− mESCs in Melton et al. (y-axis) to genes that change in expression between serum+LIF and 2i+LIF culture in single-cell RNA-Seq data (x-axis). Genes that are significantly upregulated in Dgcr8−/− mESCs upon miR-294 introduction are indicated in blue, and those that are significantly downregulated are indicated in green. Selected genes upregulated by miR-294 and downregulated in 2i+LIF culture as compared to serum+LIF are highlighted. As a group, genes downregulated by miR-294 show higher expression in 2i+LIF than in serum+LIF. (D) mESC colonies staining uniformly positive for alkaline phosphatase show reduced levels of c-myc. Overall and colony-specific c-myc distribution in serum+LIF culture as measured by RNA FISH, showing uniformly positive (top), mixed (middle), or negative (bottom) AP staining. (E) Western blot showing reduction of Lin28a protein levels in ishLin28a cells upon addition of doxycycline. (F) Let-7 expression changes in doxycycline-inducible ilet-7 mESCs grown in serum+LIF upon induction. RT-QPCR was performed as in A, and Ct changes are shown relative to v6.5 mESCs in serum+LIF in a separate experiment from panel A. The inducible let-7 construct is detected by the let-7g probe. (G) Effect of miRNA transfection on self-renewal efficiency of Dgcr8KO mESCs. miRNA mimics were transfected into Dgcr8KO mESCs, and self-renewal efficiency was measured. Error bars indicate standard deviations between triplicate transfection experiments. Co-transfection of the ESCC miRNA miR-294 with a let7 miRNA results in enhanced self-renewal efficiency as compared to miR-294 alone. (H) Expression changes of selected genes measured by QPCR upon culture of v6.5 mESCs in serum+LIF, 2i+LIF, or treatment with only Erk or GSK3β inhibitors.
Figure 1
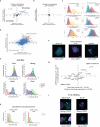
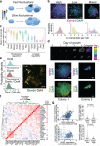
Figure 1. Gene expression variability landscape of PSCs
(A) Histograms of transcript distributions from single-cell RNA-Seq of v6.5 mESCs cultured in serum+LIF. Arrow indicates high NeuroD1 expressing cells. (B) Histograms and representative images of transcript distributions for Oct4, Esrrb, and NeuroD1 from single-molecule FISH. (C) Gene categories showing high or low noise. (D) Sporadic expression of the Polycomb target gene Bmp4 within an mESC colony as measured by smFISH. (E) Relationship between population H3K27me3 levels, fraction of cells a gene is detected in (α, top), and average expression level when detected (μ, bottom). Overall trend lines are shown. All relevant statistical information can be found in the ‘Statistics’ section of the Methods.
Figure 2
Figure 2. Expression states of variable genes are coupled together and persist over multiple cell divisions
(A) Slowly fluctuating genes show a high degree of intercolony variability. (B) Expression of the pluripotency regulator Esrrb within individual colonies. (C) Intra- and inter-colony variability in expression for selected pluripotency and lineage regulators. Average transcript number and standard deviation within colonies are indicated. (D) Time-lapse imaging of colony formation from single cells, and Nr0b1 and Oct4 expression within these colonies. (E) Relative Oct4 and Esrrb protein levels within mESCs cultured in serum+LIF. Groups of high and low Esrrb cells are indicated. (F) Correlation of pluripotency regulator polycomb target gene expression between individual cells. (G) Dependence of NeuroD1 expression on the level of Sox2 and Nr0b1 within individual cells. Dashed lines indicate high and low expression states, and P-values for differences between states were calculated using the Kolmogorov-Smirnov test.
Figure 3
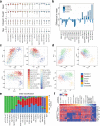
Figure 3. Effect of perturbations on gene expression variability and cell state
(A) Population distributions for the unimodally expressed genes Pou5f1 (Oct4) and Rest, and the bimodally expressed genes Tcfcp2l1 and Myc. (B) Comparison of population heterogeneity as measured by mean intra-condition distances. (C) Principal component analysis (PCA) of single-cell qPCR data. (D) PCA colored by the most likely state classification. (E) Cell state classification of PSCs exposed to different perturbations and conditions. (F) Expression heatmap of genes contributing the most to the top three principal components, excluding housekeeping and fibroblast genes.
Figure 4
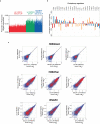
Figure 4. Dgcr8KO mESCs show evidence of ground-state self-renewal
(A) Correlation between single-cell RNA-Seq gene expression changes in different conditions. (B) Distances between individual cells for pluripotency regulators shown in panel C. (C) Heat map of single-cell RNA-Seq data for selected pluripotency regulators. (D, E) Single-molecule FISH (D) and quantitative immunofluorescence (E) showing a shift towards the high expression state of Esrrb in 2i+LIF and Dgcr8KO mESCs. (F) Promoter H3K27me3 levels in the three conditions examined by single-cell RNA-Seq. Polycomb target genes are shown in green. (H) H3K27me3 ChIP-Seq tracks from the three conditions profiled showing the selective loss of H3K27me3 at the Otx2 promoter in Dgcr8KO and 2i+LIF mESCs.
Figure 5
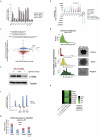
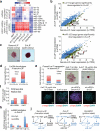
Figure 5. miRNA balance controls transitions between ground and transition states
(A) NanoString profiling of miRNAs expressed in mESCs or MEFs. (B) Expression changes of predicted let-7 or miR-152 target genes between conditions. (C) Representative colonies showing solid or mixed alkaline phosphatase (AP) staining. (D, E) Self-renewal efficiency of mESCs bearing a dox-inducible Lin28a shRNA construct (D) or dox-inducible let-7 (E) in the presence or absence of doxycycline. Mean values from two replicate experiments are shown. c-myc expression levels for representative iLet-7 colonies as measured by smFISH are shown in (E). (F) Fraction of uniformly AP positive colonies in experiments shown in Figures 5D and 5E. (G) Expression changes in c-myc and Lin28a induced by transfection of miRNA inhibitors into wild-type mESCs cultured in 2i+LIF. Error bars indicate standard deviations between triplicate transfection experiments. (H) Model for interplay between Erk signaling, miRNAs, and c-myc / Lin28 / let-7 axis in ground and transition states.

Comment in

References

    1. Boyer LA, et al. Core transcriptional regulatory circuitry in human embryonic stem cells. Cell. 2005;122:947–956. - PMC - PubMed
    1. Loh Y-H, et al. The Oct4 and Nanog transcription network regulates pluripotency in mouse embryonic stem cells. Nature genetics. 2006;38:431–440. - PubMed
    1. Loh YH, et al. Genomic approaches to deconstruct pluripotency. Annu Rev Genomics Hum Genet. 2011;12:165–185. - PMC - PubMed
    1. MacArthur BD, Ma'ayan A, Lemischka IR. Systems biology of stem cell fate and cellular reprogramming. Nature Reviews Molecular Cell Biology. 2009 - PMC - PubMed
    1. Young Richard A. Control of the Embryonic Stem Cell State. Cell. 2011;144:940–954. - PMC - PubMed

Publication types

Associated data