. 2014 Dec 4;516(7529):126-30.
doi: 10.1038/nature14013.

Physical mechanism for gating and mechanosensitivity of the human TRAAK K+ channel

Affiliations

Physical mechanism for gating and mechanosensitivity of the human TRAAK K+ channel

Stephen G Brohawn et al. Nature. .

Abstract

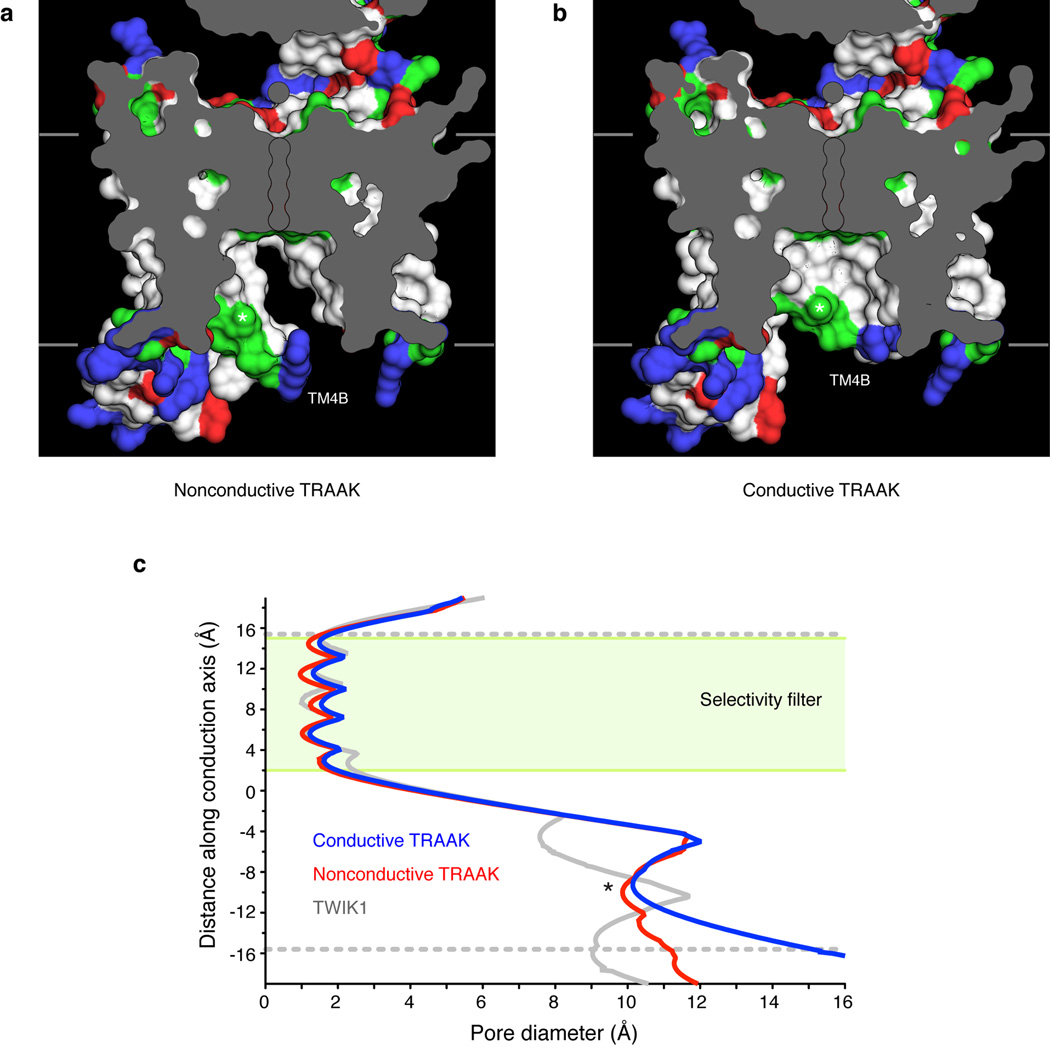
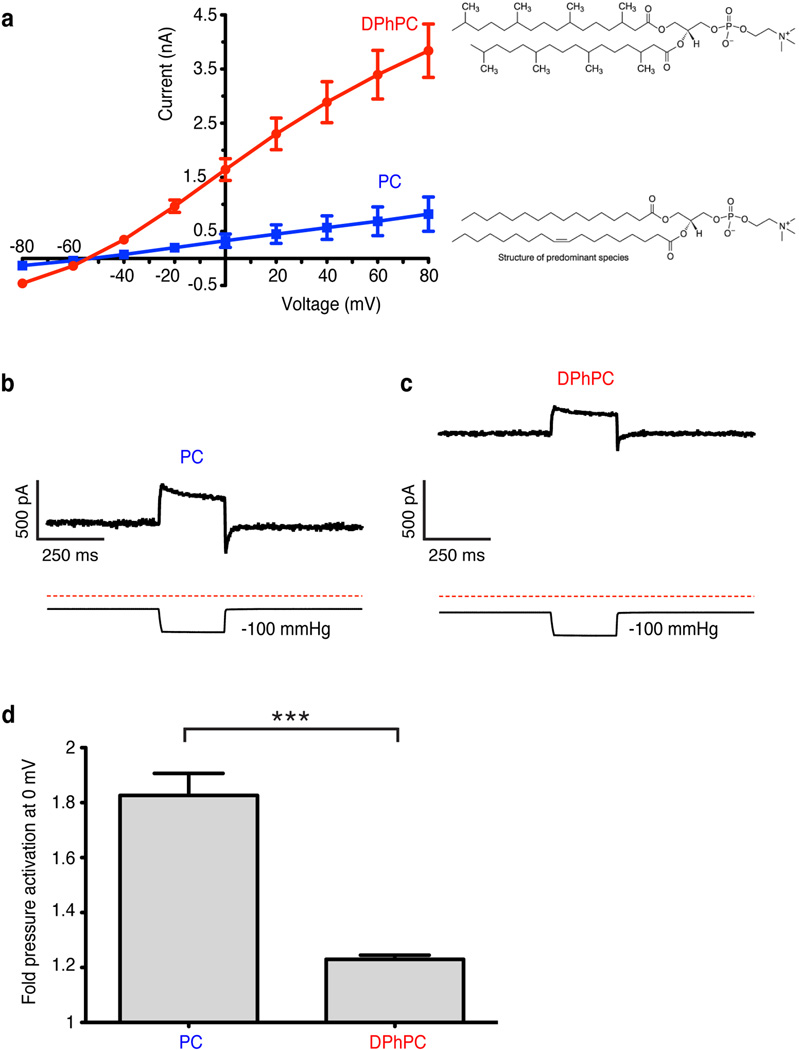
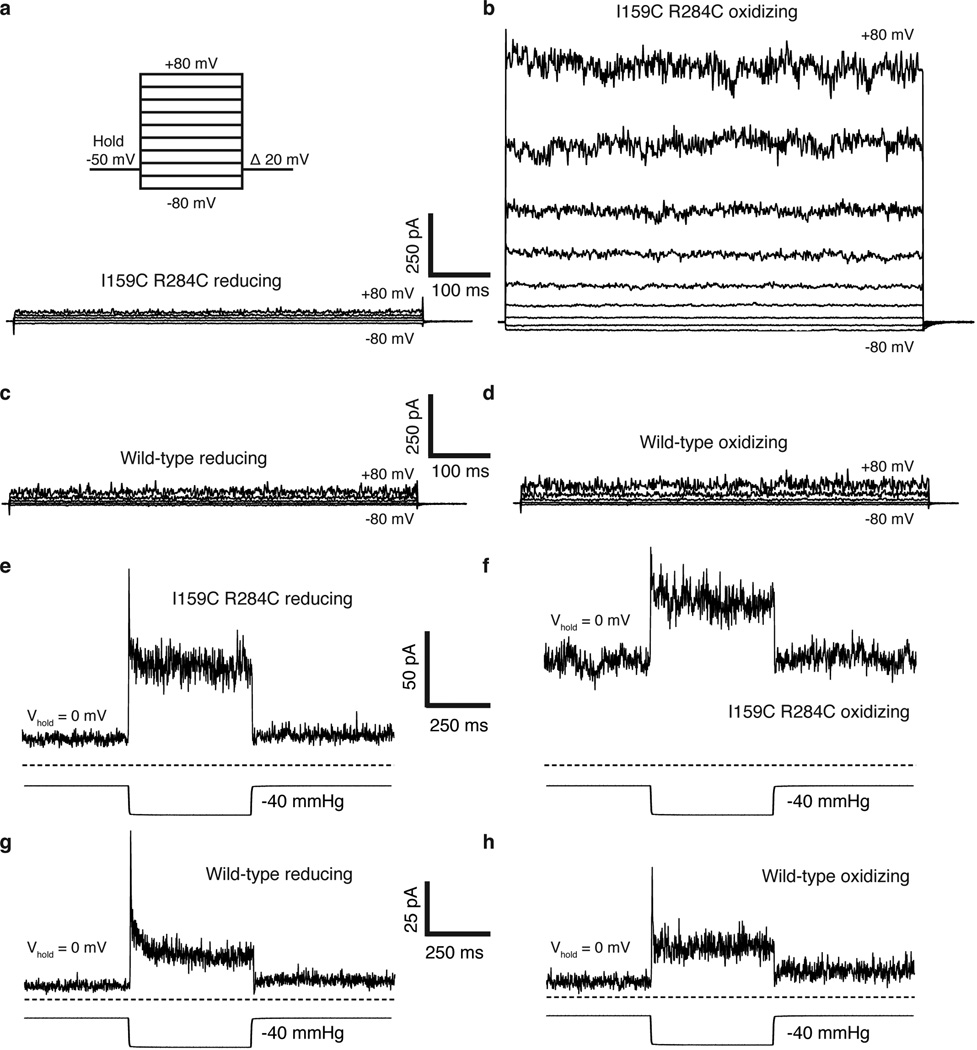
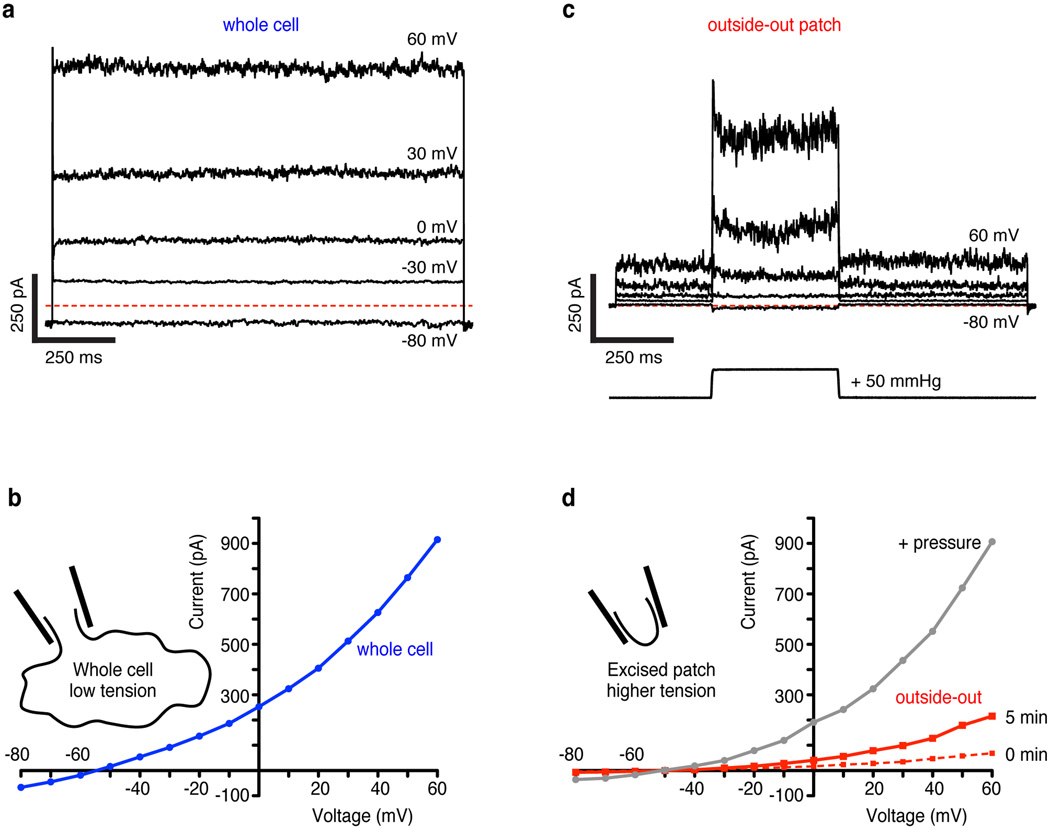
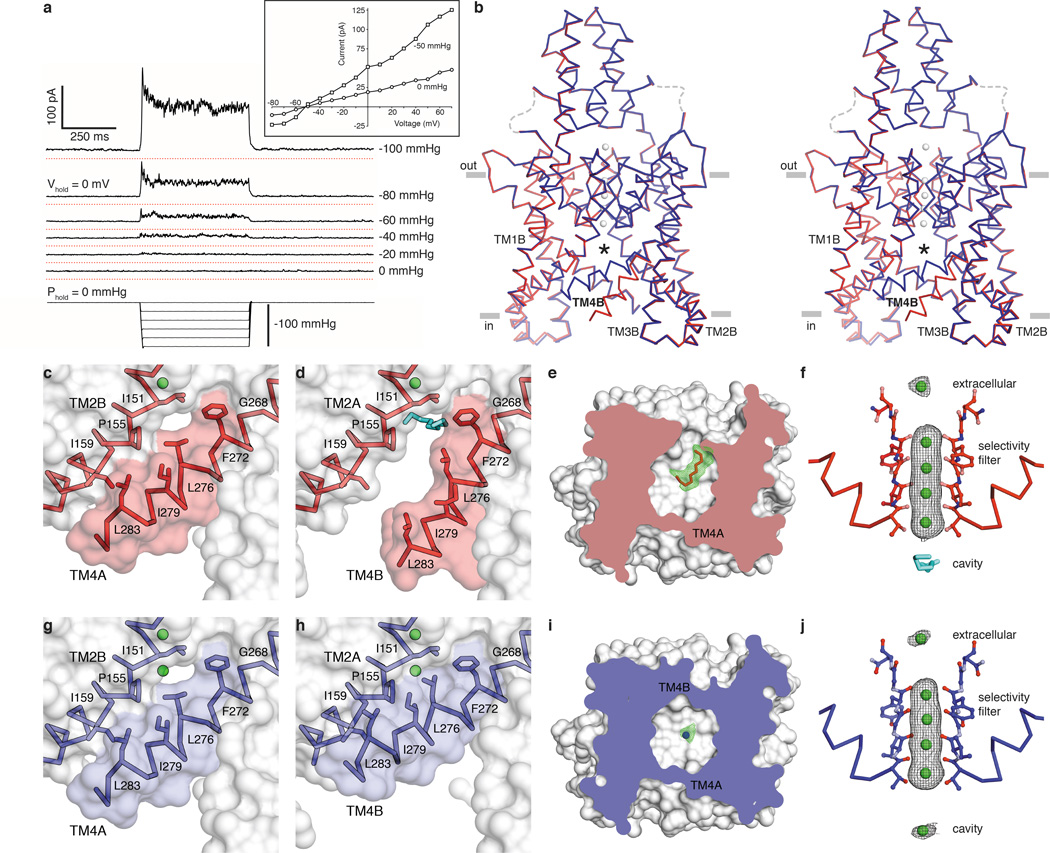
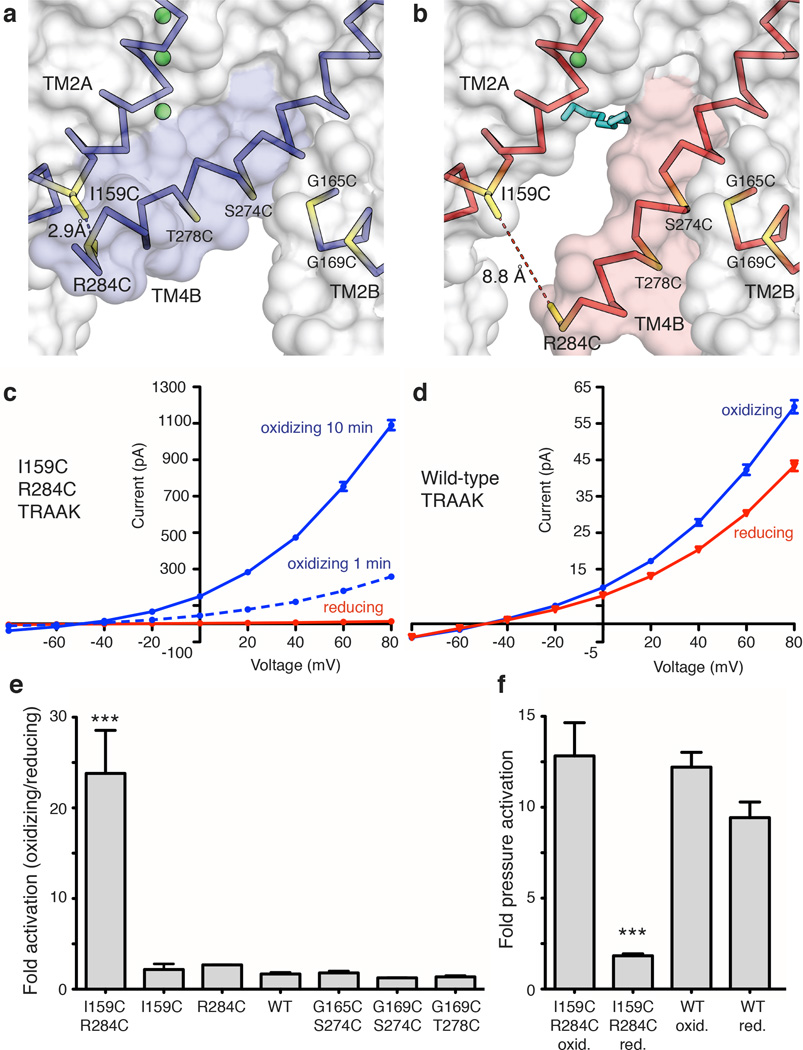
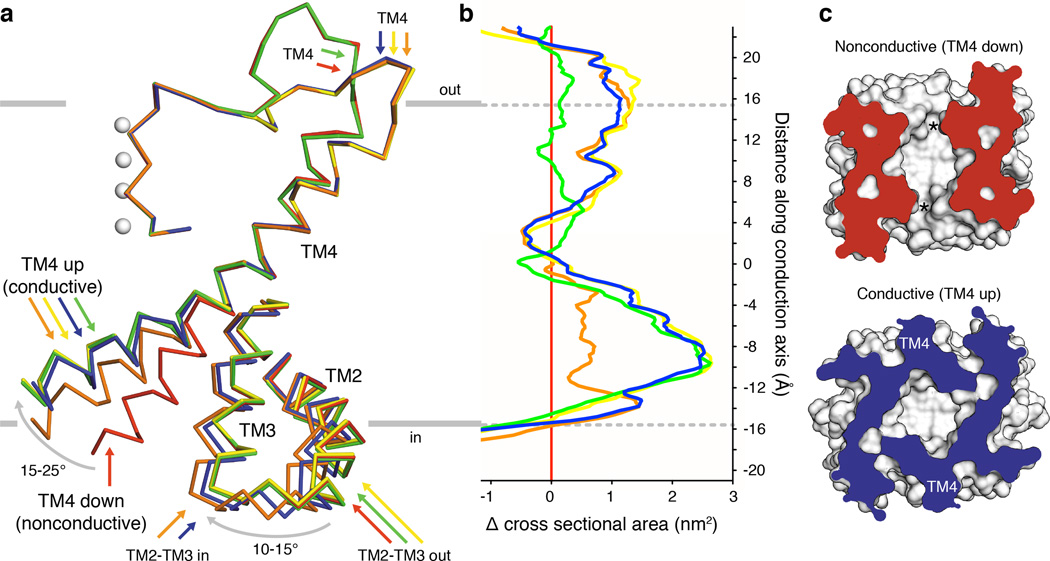
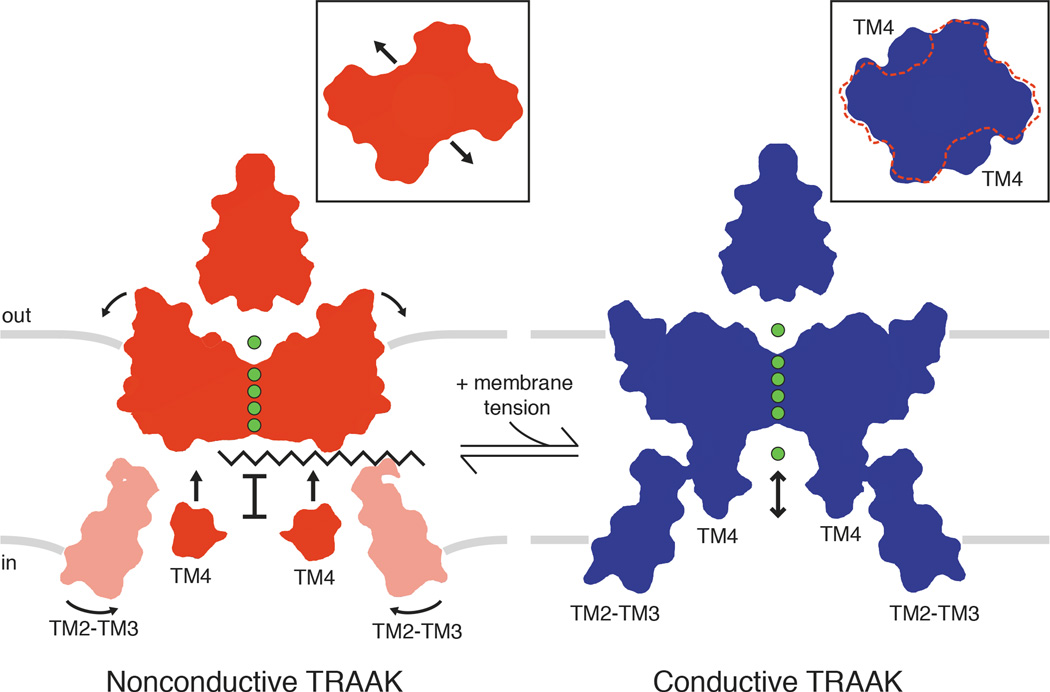
Activation of mechanosensitive ion channels by physical force underlies many physiological processes including the sensation of touch, hearing and pain. TRAAK (also known as KCNK4) ion channels are neuronally expressed members of the two-pore domain K(+) (K2P) channel family and are mechanosensitive. They are involved in controlling mechanical and temperature nociception in mice. Mechanosensitivity of TRAAK is mediated directly through the lipid bilayer--it is a membrane-tension-gated channel. However, the molecular mechanism of TRAAK channel gating and mechanosensitivity is unknown. Here we present crystal structures of TRAAK in conductive and non-conductive conformations defined by the presence of permeant ions along the conduction pathway. In the non-conductive state, a lipid acyl chain accesses the channel cavity through a 5 Å-wide lateral opening in the membrane inner leaflet and physically blocks ion passage. In the conductive state, rotation of a transmembrane helix (TM4) about a central hinge seals the intramembrane opening, preventing lipid block of the cavity and permitting ion entry. Additional rotation of a membrane interacting TM2-TM3 segment, unique to mechanosensitive K2Ps, against TM4 may further stabilize the conductive conformation. Comparison of the structures reveals a biophysical explanation for TRAAK mechanosensitivity--an expansion in cross-sectional area up to 2.7 nm(2) in the conductive state is expected to create a membrane-tension-dependent energy difference between conformations that promotes force activation. Our results show how tension of the lipid bilayer can be harnessed to control gating and mechanosensitivity of a eukaryotic ion channel.


Figures

Extended Data Figure 1
Extended Data Figure 1. The central cavity in conductive and nonconductive TRAAK conformations
(a,b) View from the membrane plane of the TRAAK central cavity in the (a) nonconductive and (b) conductive conformations. The exposed surface of hydrophobic amino acids are colored white, arginine and lysine are blue, glutamate and aspartate are red, and polar residues are green. The positions of K+ ions in the filter are outlined and residue T277 in TM4 is indicated with an asterisk. (c) Diameter of the ion conduction pathway as a function of distance through the membrane for nonconductive TRAAK (red), conductive TRAAK (blue) and TWIK1 (gray, PDB:3UKM). The green box indicates the position of the selectivity filter and dashed gray lines are the approximate boundaries of the lipid membrane. The ~10 Å diameter constriction formed partially by T277 is indicated with an asterisk. The pore diameter is larger in TRAAK than in TWIK1 and expands below T277 in the conductive conformation.
Extended Data Figure 2
Extended Data Figure 2. Reconstituted TRAAK activity in different lipids
(a) Current recorded from TRAAK proteoliposome patches as a function of holding voltage (mean ± SEM, n=9 patches each). Current through TRAAK reconstituted in phosphatidylcholine lipids with branched acyl chains (1,2-diphytanoyl-sn-glycero-3-phosphocholine, DPhPC) was significantly higher than in non-branched acyl chains (egg L-α-phosphatidylcholine, PC) at each voltage measured (5.0 fold higher at 0 mV, p < 0.0001, Student’s t-test). (b,c) Representative recording of pressure (lower trace) activation of TRAAK current (upper trace) in (b) PC or (c) DPhPC lipids. (d) Quantification of pressure activation of TRAAK in PC and DPhPC (mean fold pressure activation at 0 mV ± SEM, n=9 patches each, ***p < 0.0001, Student’s t-test).
Extended Data Figure 3
Extended Data Figure 3. Representative electrophysiological recordings from wild-type and I159C R284C TRAAK
In these experiments and those in Fig. 2, inside-out patches from cells expressing wild-type or mutant TRAAK channels were excised and perfused with reducing bath solution (with 10 mM DTT). After stabilization of the patch (TRAAK channels exhibit a gradual run-up of current following excision to an equilibrium value, e.g. Extended Data Fig. 4), the perfusion solution was switched to oxidizing bath solution (no DTT). (a,b) Representative voltage family from a I159C R284C TRAAK patch during perfusion of (a) reducing and (b) oxidizing solution. The voltage family protocol is illustrated. (c,d) Same as (a,b) but from a wild-type TRAAK patch. (e,f) Current response (upper) to pressure application (lower) at 0 mV from the same I159C R284C TRAAK patch during perfusion of (e) reducing or (f) oxidizing bath solution. (g,h) Same as (e,f), but from a wild-type TRAAK patch. Scale is shown between each pair of recordings in reducing and oxidizing bath solutions.
Extended Data Figure 4
Extended Data Figure 4. Basal activity and tension activation of TRAAK
(a) Whole cell current from a TRAAK-expressing cell during a voltage step protocol in a ten-fold gradient of [K+] (EK+ = −59 mV, holding voltage = −80 mV, ΔV = 10 mV, indicated steps shown). Red dashed line indicates zero current level. (b) Current-voltage relationship from experiment in (a). (c) Currents (upper traces) recorded from an outside-out patch excised from the same cell as in (a,b). The voltage protocol in (a) was used with an additional pressure step (lower trace) during each voltage step. (d) Current-voltage relationship from data in (b) (mean current 5 min after patch excision before pressure (red) and peak current during pressure step (gray)) and a recording immediately after pulling the patch (red dashes). The excised patch contains < 1% of the whole cell membrane area, but gives ~25% of the whole cell current before and similar current during a pressure step. This is explained by very low basal activity of TRAAK with near-zero membrane tension (whole cell) and channel activation by increasing membrane tension over a broad range (intermediate tension in an excised patch to high tension in a pressurized patch).
Extended Data Figure 5
Extended Data Figure 5. Detailed view of TM2-TM3 rotation in TRAAK
Stereo view from the cytoplasm of an overlay of nonconductive (red) and conductive TM2-TM3 rotated (blue) conformations. Amino acids that sterically prevent TM2-TM3 rotation when TM4 is down are shown as sticks. TM2-TM3 rotates about hinges at positions G169 and G205. This rotation can only occur if TM4 is up because amino acids L172, F201 and G205 on TM2-TM3 shift (0.75 –2.1 Å) to a position that would sterically clash with amino acids Y271 and V275 on TM4 in a down conformation. Translation of Y271 and V275 3.1–4.1 Å in TM4 up conformations creates space for the TM2-TM3 rotation.
Figure 1
Figure 1. Structures of TRAAK in nonconductive and conductive conformations
(a) Current response to pressure applied to an inside-out patch from a TRAAK-expressing cell held at 0 mV in a ten-fold [K+] gradient (EK+=−59 mV). Recordings are vertically offset with red lines at the zero current level. (Inset) Current-voltage relationship from the same patch before and during pressure application. (b) Stereo view of an overlay of conductive (blue) and nonconductive (red) conformations of TRAAK in K+ (gray). The central cavity (with ligands removed) is marked with an asterisk. (c–f) Nonconductive TRAAK structures. (c,d) Membrane view of the cytoplasmic half of (c) TM4A and (d) TM4B with a cavity-bound acyl chain (cyan). (d) is rotated 180° about the conduction axis from (c). (e) Cytoplasmic view clipped to the cavity plane with Fo-Fc positive omit density at 2.5σ (green) around the acyl chain (red). (f) Anomalous density (gray) at 3σ (extracellular ion) or 5σ (selectivity filter ions) around Tl+ (green) in the conduction pathway of nonconductive TRAAK with a cavity-bound acyl chain (cyan). (g–j) Conductive TRAAK structures in the same views as (c–f). The cavity-bound ion is shown in Fo-Fc positive omit density (i, green) and anomalous density (j, gray) at 3σ.
Figure 2
Figure 2. Redox-dependent activation of a TRAAK double cysteine mutant between TM2 and TM4
(a,b) Cysteine mutations (yellow) and predicted distance between sulfur atoms in I159C R284C TRAAK in the (a) conductive and (b) nonconductive conformations. (c,d) Current-voltage relationship from a representative (c) I159C R284C or (d) wild-type (WT) TRAAK patch in reducing (red) and oxidizing (blue) bath solutions. (e) Quantification of fold activation in oxidizing compared to reducing bath solutions (mean ± SEM at 0 mV, I159C R284C 23.8 ± 4.7 (n=6 patches), I159C 2.17 ±0.62 (n=3), R284C 2.68 ± 0.03 (n=3), WT 1.67 ± 0.19 (n=6), G165C S274C 1.80 ±0.21 (n=3), G169C S274C 1.25±0.02 (n=3), G169C T278C 1.37 ±0.14 (n=3), ***p<0.0001, one way ANOVA). (f) Quantification of pressure activation in oxidizing or reducing bath solutions (mean fold activation at 0 mV ± SEM, I159C R284C reducing 12.83 ± 1.83, I159C R284C oxidizing 1.83 ± 0.11, WT reducing 12.21 ± 0.82 and WT oxidizing 8.43 ± 0.86, n=3 patches each, ***p=0.0003, one way ANOVA).
Figure 3
Figure 3. Conformational changes in conductive TRAAK structures expand the channel cross sectional area
(a) Membrane view of an overlay of mobile elements in nonconductive (red) and conductive conformations (orange, green, yellow and blue) of TRAAK. (b) Difference in cross sectional area versus membrane depth calculated between each conductive conformation and the nonconductive conformation (positive values indicate area expansion upon channel opening, colors as in (a)). Depth is on the same scale as (a) with gray indicating bilayer boundaries. (c) Cytoplasmic view of nonconductive and conductive conformations clipped at –9 Å depth. Intramembrane openings (asterisks) or TM4 positions are indicated.
Figure 4
Figure 4. Model for TRAAK gating and physical basis of mechanosensitivity
In the nonconductive conformation (red), a lipid acyl chain accesses the central cavity through intramembrane openings above TM4 to sterically block ion (green) conduction. In the conductive conformation (blue), conformational changes in TM4 seal the intramembrane openings to prevent lipid access and permit ion conduction through the channel. Conformational changes upon channel opening increase the channel cross sectional area (insets). Rotation of TM2-TM3 towards TM4 in the cytoplasmic leaflet and displacement of the extracellular half of TM4 further expand the channel and may stabilize the conductive conformation. Area expansion and reduced midplane bending of the membrane (gray bars) result in a membrane tension-dependent energy difference between conformations that explains mechanosensitivity of TRAAK.

References

References for the main text

    1. Arnadóttir J, Chalfie M. Eukaryotic mechanosensitive channels. Annual review of biophysics. 2010;39:111–137. - PubMed
    1. Bautista DM, Lumpkin EA. Perspectives on: information and coding in mammalian sensory physiology: probing mammalian touch transduction. J Gen Physiol. 2011;138:291–301. - PMC - PubMed
    1. Delmas P, Coste B. Mechano-Gated Ion Channels in Sensory Systems. Cell. 2013;155:278–284. - PubMed
    1. Nilius B, Honore E. Sensing pressure with ion channels. Trends Neurosci. 2012;35:477–486. - PubMed
    1. Anishkin A, Loukin SH, Teng J, Kung C. Feeling the hidden mechanical forces in lipid bilayer is an original sense. Proc Natl Acad Sci USA. 2014;111:7898–7905. - PMC - PubMed

References for the online-only methods section

    1. Minor W, Cymborowski M, Otwinowski Z, Chruszcz M. HKL-3000: the integration of data reduction and structure solution--from diffraction images to an initial model in minutes. Acta Crystallogr D Biol Crystallogr. 2006;62:859–866. - PubMed
    1. McCoy AJ, et al. Phaser crystallographic software. J Appl Crystallogr. 2007;40:658–674. - PMC - PubMed
    1. Karplus PA, Diederichs K. Linking Crystallographic Model and Data Quality. Science. 2012;336:1030–1033. - PMC - PubMed
    1. Emsley P, Lohkamp B, Scott WG, Cowtan K. Features and development of Coot. Acta Crystallogr D Biol Crystallogr. 2010;66:486–501. - PMC - PubMed
    1. Murshudov GN, et al. REFMAC5 for the refinement of macromolecular crystal structures. Acta Crystallogr D Biol Crystallogr. 2011;67:355–367. - PMC - PubMed

Publication types

Substances