

Toward optimizing patient-specific IMRT QA techniques in the accurate detection of dosimetrically acceptable and unacceptable patient plans
- PMID: 25471949
- PMCID: PMC4235651
- DOI: 10.1118/1.4899177
Toward optimizing patient-specific IMRT QA techniques in the accurate detection of dosimetrically acceptable and unacceptable patient plans
Abstract
Purpose: The authors investigated the performance of several patient-specific intensity-modulated radiation therapy (IMRT) quality assurance (QA) dosimeters in terms of their ability to correctly identify dosimetrically acceptable and unacceptable IMRT patient plans, as determined by an in-house-designed multiple ion chamber phantom used as the gold standard. A further goal was to examine optimal threshold criteria that were consistent and based on the same criteria among the various dosimeters.
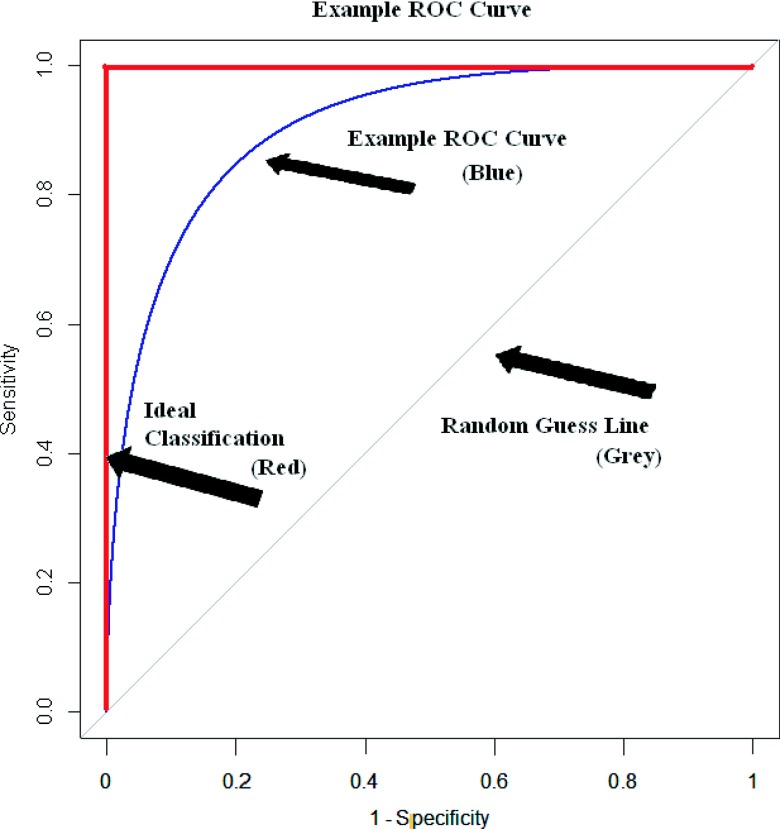
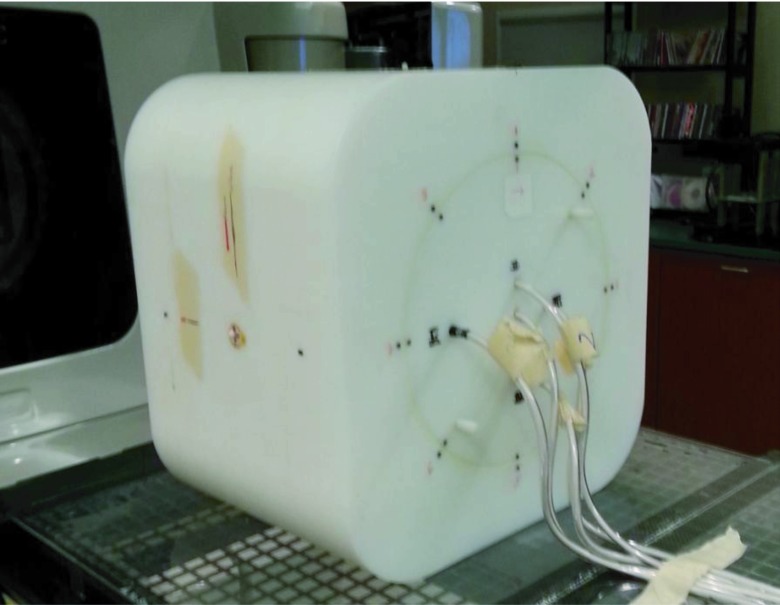
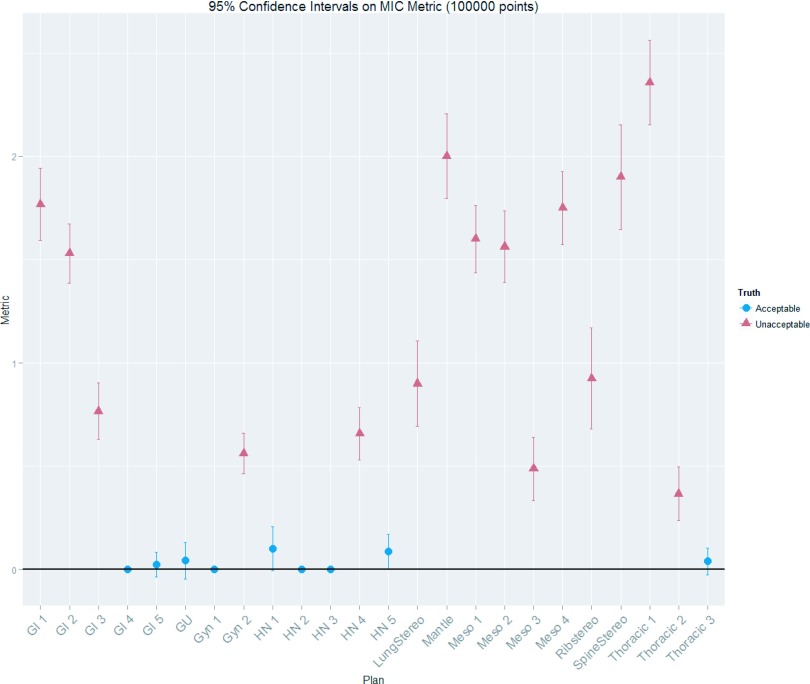
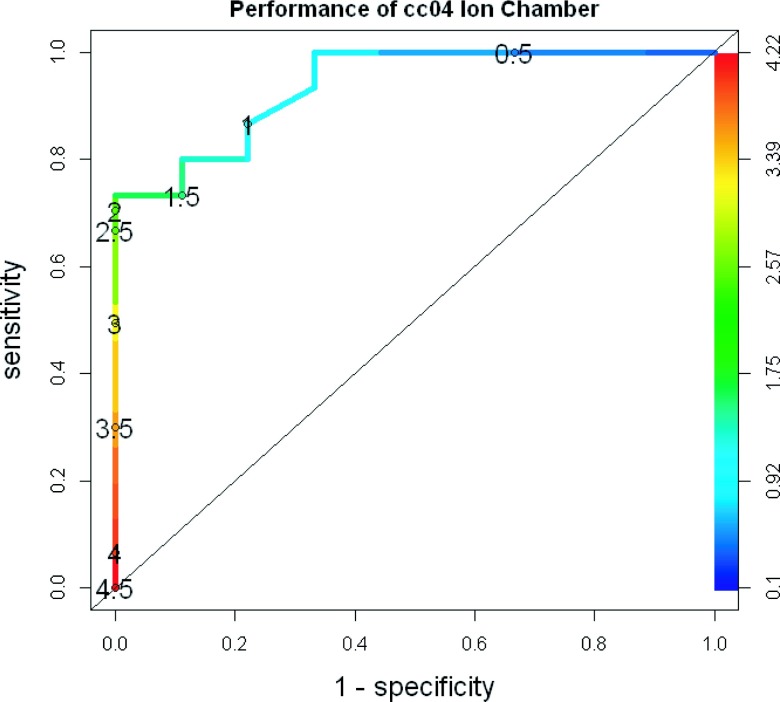
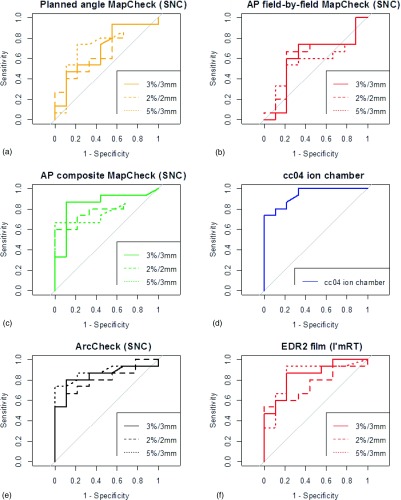
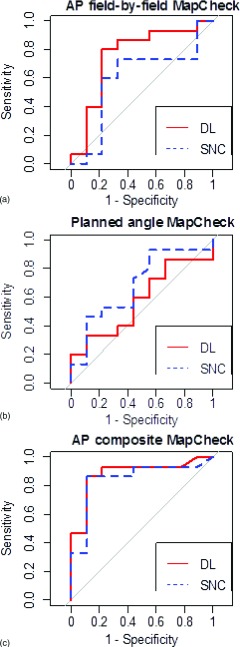
Methods: The authors used receiver operating characteristic (ROC) curves to determine the sensitivity and specificity of (1) a 2D diode array undergoing anterior irradiation with field-by-field evaluation, (2) a 2D diode array undergoing anterior irradiation with composite evaluation, (3) a 2D diode array using planned irradiation angles with composite evaluation, (4) a helical diode array, (5) radiographic film, and (6) an ion chamber. This was done with a variety of evaluation criteria for a set of 15 dosimetrically unacceptable and 9 acceptable clinical IMRT patient plans, where acceptability was defined on the basis of multiple ion chamber measurements using independent ion chambers and a phantom. The area under the curve (AUC) on the ROC curves was used to compare dosimeter performance across all thresholds. Optimal threshold values were obtained from the ROC curves while incorporating considerations for cost and prevalence of unacceptable plans.
Results: Using common clinical acceptance thresholds, most devices performed very poorly in terms of identifying unacceptable plans. Grouping the detector performance based on AUC showed two significantly different groups. The ion chamber, radiographic film, helical diode array, and anterior-delivered composite 2D diode array were in the better-performing group, whereas the anterior-delivered field-by-field and planned gantry angle delivery using the 2D diode array performed less well. Additionally, based on the AUCs, there was no significant difference in the performance of any device between gamma criteria of 2%/2 mm, 3%/3 mm, and 5%/3 mm. Finally, optimal cutoffs (e.g., percent of pixels passing gamma) were determined for each device and while clinical practice commonly uses a threshold of 90% of pixels passing for most cases, these results showed variability in the optimal cutoff among devices.
Conclusions: IMRT QA devices have differences in their ability to accurately detect dosimetrically acceptable and unacceptable plans. Field-by-field analysis with a MapCheck device and use of the MapCheck with a MapPhan phantom while delivering at planned rotational gantry angles resulted in a significantly poorer ability to accurately sort acceptable and unacceptable plans compared with the other techniques examined. Patient-specific IMRT QA techniques in general should be thoroughly evaluated for their ability to correctly differentiate acceptable and unacceptable plans. Additionally, optimal agreement thresholds should be identified and used as common clinical thresholds typically worked very poorly to identify unacceptable plans.
Figures
References
Publication types
MeSH terms
Grants and funding
LinkOut - more resources
Full Text Sources
Other Literature Sources
