. 2014 Dec 4:10:284.
doi: 10.1186/s12917-014-0284-6.

Adverse effects of Influenza A(H1N1)pdm09 virus infection on growth performance of Norwegian pigs - a longitudinal study at a boar testing station

Affiliations

Adverse effects of Influenza A(H1N1)pdm09 virus infection on growth performance of Norwegian pigs - a longitudinal study at a boar testing station

Chiek Er et al. BMC Vet Res. .

Abstract

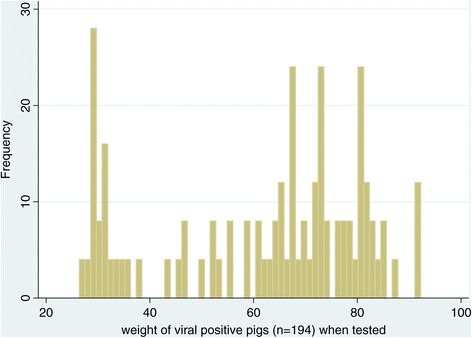
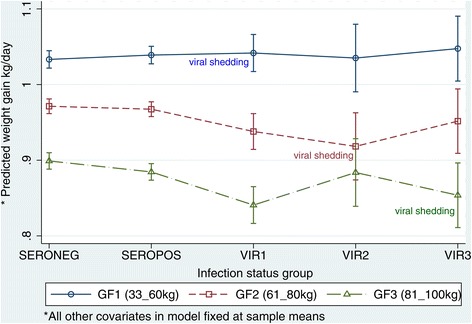
Background: Influenza A(H1N1)pdm09 virus infection in Norwegian pigs was largely subclinical. This study tested the hypothesis that the infection causes negligible impact on pigs' growth performance in terms of feed conversion efficiency, daily feed intake, daily growth, age on reaching 100 kg bodyweight and overall feed intake. A sample of 1955 pigs originating from 43 breeding herds was classified into five infection status groups; seronegative pigs (n = 887); seropositive pigs (n = 874); pigs positive for virus at bodyweight between 33 kg and 60 kg (n = 123); pigs positive for virus at bodyweight between 61 kg and 80 kg (n = 34) and pigs positive for virus at bodyweight between 81 kg and 100 kg (n = 37). Each pig had daily recordings of feed intake and bodyweight from 33 kg to 100 kg. Marginal effects of the virus infection on the outcomes were estimated by multi-level linear regression, which accounted for known fixed effects (breed, birthdate, average daily feed intake and growth phase) and random effects (cluster effects of pig and herd).

Results: The seropositive and virus positive pigs had decreased (P value<0.05) growth performance compared to seronegative pigs even though feed intake was not decreased. Reduced feed conversion efficiency led to lower average daily growth, additional feed requirement and longer time needed to reach the 100 kg bodyweight. The effects were more marked (P value<0.03) in pigs infected at a younger age and lasted a longer period. Despite increased feed intake observed, their growth rates were lower and they took more time to reach 100 kg bodyweight compared to the seronegative pigs.

Conclusion: Our study rejected the null hypothesis that the virus infection had negligible adverse effects on growth performance of Norwegian pigs.


Figures

Figure 1
Figure 1
Histogram of weight of virus positive pigs (n= 194) when they were tested positive for virus shedding.
Figure 2
Figure 2
Marginal plots for average daily growth (ADG) and adverse effects of influenza A(H1N1)pdm09 virus infection. Based on the model presented in Table 2, the mean ADG was predicted for each of the five infection status groups and the three growth phases (GF), while all other covariates of birthdate, feed intake and breed were fixed at the sample means. The effect of the virus infection is marked by comparing the four infected groups with the reference seronegative group on the same growth phase denoted by the line joining the groups. Comparisons between groups were made for each growth phase since ADG vary with age. As depicted in the graph, the younger pigs would hypothetically have a higher ADG because they have a better FCE (see Figure 2 and Table 3) if feed intake is fixed at the same level. The gradient of the lines joining the means of each group and the confidence intervals indicate whether there were differences between the groups. Abbreviations: INFGP = Infection status group; SEROPOS = seropositive pigs, SERONEG = seronegative pigs, VIR1 = PCR-positive pigs at bodyweight between 33 kg and 60 kg (GF1); VIR2 = PCR-positive pigs at bodyweight between 61 kg and 80 kg (GF2); VIR3 = PCR-positive pigs at bodyweight between 81 kg and 100 kg (GF3).
Figure 3
Figure 3
Marginal plots for feed conversion efficiency (FCE) and adverse effects of influenza A(H1N1)pdm09 virus infection. Based on the model presented in Table 3, the mean FCE was predicted for each of the five infection status groups and the three growth phases (GF) while all the other covariates of birthdate, feed intake and breed were fixed at the sample means. The effect of the virus infection is marked by comparing the four infected groups with the reference seronegative group on the same growth phase as denoted by the line joining the groups. Comparisons were made for each growth phase since feed efficiency decreases with age. The gradient of the lines joining the means of each group and the confidence intervals indicate whether there were differences between the groups. Abbreviations: INFGP = Infection status group; SEROPOS = seropositive pigs, SERONEG = seronegative pigs, VIR1 = PCR-positive pigs at bodyweight between 33 kg and 60 kg (GF1); VIR2 = PCR-positive pigs at bodyweight between 61 kg and 80 kg (GF2); VIR3 = PCR-positive pigs at bodyweight between 81 kg and 100 kg (GF3).
Figure 4
Figure 4
Marginal plots of mean age at 100 kg and adverse effects of influenza A(H1N1)pdm09 virus infection. The plots show the predicted mean ages of pigs at 100 kg for the five groups of pigs based on the model presented in Table 6. The gradient of the line joining the mean for each group and the confidence intervals indicate whether there is any difference between the groups due to their infection status. Comparisons were made between the four infected groups and the reference seronegative group. Abbreviations: INFGP = Infection status group; SEROPOS = seropositive pigs, SERONEG = seronegative pigs, VIR1 = PCR-positive pigs at bodyweight between 33 kg and 60 kg (GF1); VIR2 = PCR-positive pigs at bodyweight between 61 kg and 80 kg (GF2); VIR3 = PCR-positive pigs at bodyweight between 81 kg and 100 kg (GF3).
Figure 5
Figure 5
Marginal plots of overall feed intake and adverse effects of influenza A(H1N1)pdm09 virus infection. The plots show the predicted mean overall feed intakes for the five groups of pigs based on the model presented in Table 7. The gradient of the line joining the mean for each group and the confidence intervals indicate whether there is any difference between the groups due to their infection status. Comparisons were made between the four infected groups and the reference seronegative group. Abbreviations: INFGP = Infection status group; SEROPOS = seropositive pigs, SERONEG = seronegative pigs, VIR1 = PCR-positive pigs at bodyweight between 33 kg and 60 kg (GF1); VIR2 = PCR-positive pigs at bodyweight between 61 kg and 80 kg (GF2); VIR3 = PCR-positive pigs at bodyweight between 81 kg and 100 kg (GF3).

References

    1. Van Alstine WG: Respiratory System. In Disease of Swine. 10th edition. Edited by Zimmerman J, Karriker L, Ramirez A, Schwartz KJ. Wiley-Blackwell; 2012.
    1. Loeffen WLA, Heinen PP, Bianchi ATJ, Hunneman WA, Verheijden JHM. Effect of maternally derived antibodies on the clinical signs and immune response in pigs after primary and secondary infection with an influenza H1N1 virus. Vet Immunol Immunopathol. 2003;92(1–2):23–35. doi: 10.1016/S0165-2427(03)00019-9. - DOI - PubMed
    1. Khatri M, Goyal SM, Saif YM. Oct4+ stem/progenitor swine lung epithelial cells are targets for influenza virus replication. J Virol. 2012;86(12):6427–6433. doi: 10.1128/JVI.00341-12. - DOI - PMC - PubMed
    1. Crisci E, Mussá T, Fraile L, Montoya M. Review: influenza virus in pigs. Mol Immunol. 2013;55(3–4):200–211. doi: 10.1016/j.molimm.2013.02.008. - DOI - PubMed
    1. Torremorell M, Allerson M, Corzo C, Diaz A, Gramer M. Transmission of influenza a virus in pigs. Transbound Emerg Dis. 2012;59:68–84. doi: 10.1111/j.1865-1682.2011.01300.x. - DOI - PubMed

Publication types

LinkOut - more resources