Clinical Trial
. 2014 Dec 3;6(265):265ra166.
doi: 10.1126/scitranslmed.3009501.

PET/CT imaging correlates with treatment outcome in patients with multidrug-resistant tuberculosis

Affiliations
Clinical Trial

PET/CT imaging correlates with treatment outcome in patients with multidrug-resistant tuberculosis

Ray Y Chen et al. Sci Transl Med. .

Abstract

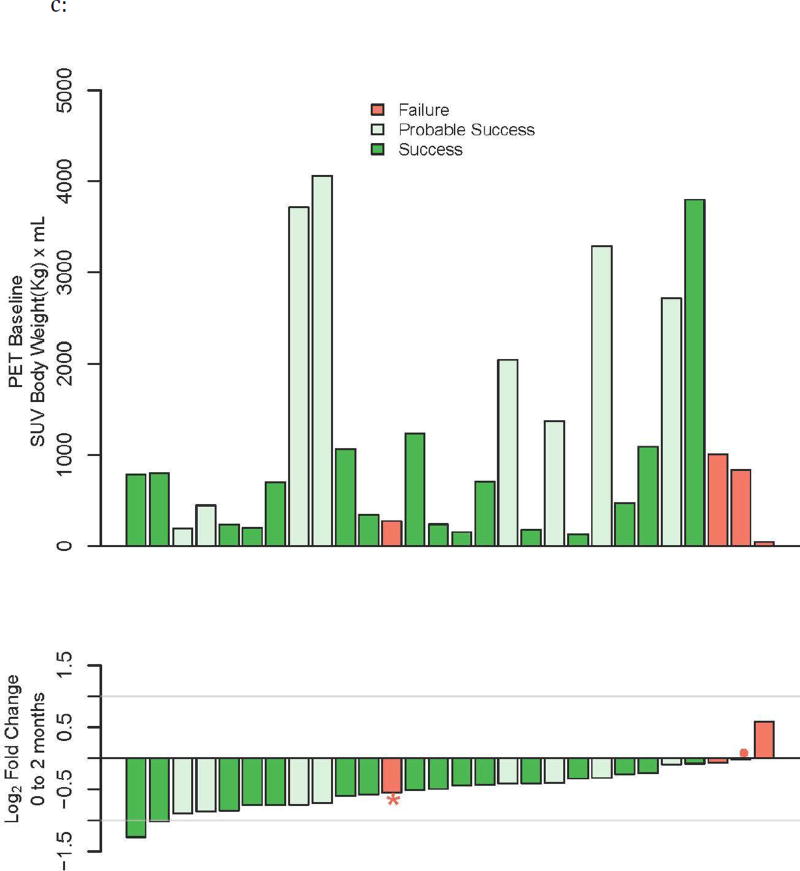
Definitive clinical trials of new chemotherapies for treating tuberculosis (TB) require following subjects until at least 6 months after treatment discontinuation to assess for durable cure, making these trials expensive and lengthy. Surrogate endpoints relating to treatment failure and relapse are currently limited to sputum microbiology, which has limited sensitivity and specificity. We prospectively assessed radiographic changes using 2-deoxy-2-[(18)F]-fluoro-D-glucose (FDG) positron emission tomography/computed tomography (PET/CT) at 2 and 6 months (CT only) in a cohort of subjects with multidrug-resistant TB, who were treated with second-line TB therapy for 2 years and then followed for an additional 6 months. CT scans were read semiquantitatively by radiologists and were computationally evaluated using custom software to provide volumetric assessment of TB-associated abnormalities. CT scans at 6 months (but not 2 months) assessed by radiologist readers were predictive of outcomes, and changes in computed abnormal volumes were predictive of drug response at both time points. Quantitative changes in FDG uptake 2 months after starting treatment were associated with long-term outcomes. In this cohort, some radiologic markers were more sensitive than conventional sputum microbiology in distinguishing successful from unsuccessful treatment. These results support the potential of imaging scans as possible surrogate endpoints in clinical trials of new TB drug regimens. Larger cohorts confirming these results are needed.


Conflict of interest statement

Competing interests: None.

Figures

Figure 1
Figure 1
a: Waterfall plot of change in CT reader scores and correlation with treatment outcomes. b: Waterfall plot of change in automated CT abnormal volumes and correlation with treatment outcomes. c: Waterfall plot of change in PET total glycolytic activity and correlation with treatment outcomes.
Figure 1
Figure 1
a: Waterfall plot of change in CT reader scores and correlation with treatment outcomes. b: Waterfall plot of change in automated CT abnormal volumes and correlation with treatment outcomes. c: Waterfall plot of change in PET total glycolytic activity and correlation with treatment outcomes.
Figure 2
Figure 2
a: ROC curves for correlation between treatment success with change in sputum culture conversion (solid and liquid), CT reader scores (Area Under the Curve [AUC] 0.78, 95% confidence interval [CI] 0.52–1.0), automated CT abnormal softer volume (−500 to −100 HU; AUC 0.57, 95% CI 0.19–0.81), automated CT abnormal harder volume (−100 to 200 HU; AUC 0.91, 95% CI 0.78–1.0), and PET (AUC 0.86, 95% CI 0.59–1.0) at 2 months. b: ROC curves for correlation between change in CT at 6 months and treatment outcomes. CT reader score Area Under the Curve [AUC] 0.82, 95% confidence interval [CI] 0.58–1.0); automated CT abnormal softer volume (−500 to −100 HU) AUC 0.88, 95% CI 0.72–1.0; automated CT abnormal harder volume (−100 to 200 HU) AUC 0.98, 95% CI 0.93–1.0.
Figure 2
Figure 2
a: ROC curves for correlation between treatment success with change in sputum culture conversion (solid and liquid), CT reader scores (Area Under the Curve [AUC] 0.78, 95% confidence interval [CI] 0.52–1.0), automated CT abnormal softer volume (−500 to −100 HU; AUC 0.57, 95% CI 0.19–0.81), automated CT abnormal harder volume (−100 to 200 HU; AUC 0.91, 95% CI 0.78–1.0), and PET (AUC 0.86, 95% CI 0.59–1.0) at 2 months. b: ROC curves for correlation between change in CT at 6 months and treatment outcomes. CT reader score Area Under the Curve [AUC] 0.82, 95% confidence interval [CI] 0.58–1.0); automated CT abnormal softer volume (−500 to −100 HU) AUC 0.88, 95% CI 0.72–1.0; automated CT abnormal harder volume (−100 to 200 HU) AUC 0.98, 95% CI 0.93–1.0.
Figure 3
Figure 3
a: Automated CT model image showing how the chest is stripped down to the lungs. b: Representative reconstructed automated CT volume images at 0, 2, and 6 months using Hounsfield unit densities >−200.
Figure 3
Figure 3
a: Automated CT model image showing how the chest is stripped down to the lungs. b: Representative reconstructed automated CT volume images at 0, 2, and 6 months using Hounsfield unit densities >−200.
Figure 4
Figure 4. PET/CT scan of a subject at study entry and after two months of treatment
This scan shows a subject with right middle and lower lobe disease and no involvement of the left lung. In this representation voxels between −100 and 200 Hounsfield units are labeled gray (smoothed for clarity in the top views but unsmoothed from the primary data in the lower views). FDG uptake is represented by a red to yellow scale ranging from an SUV of 4 to 8. This subject has a fan collapse of the right middle lobe and extensive abnormalities in the right lower lobe posteriorly. These parenchymal abnormalities resolve significantly at the two-month time point by CT and have minimal FDG uptake by two months while the collapse of the middle lobe retains FDG uptake and shows only minimal resolution.
Figure 5
Figure 5
Correlation plot of 10 CT features and Hounsfield unit (HU) density. Triangles indicate statistical significance at P<0.001 using the bootstrap.

References

    1. Wallis RS, Kim P, Cole S, Hanna D, Andrade BB, Maeurer M, Schito M, Zumla A. Tuberculosis biomarkers discovery: developments, needs, and challenges. The Lancet infectious diseases. 2013;13:362–372. doi: 10.1016/S1473-3099(13)70034-3. published online EpubApr. - DOI - PubMed
    1. Horne DJ, Royce SE, Gooze L, Narita M, Hopewell PC, Nahid P, Steingart KR. Sputum monitoring during tuberculosis treatment for predicting outcome: systematic review and meta-analysis. The Lancet infectious diseases. 2010;10:387–394. doi: 10.1016/S1473-3099(10)70071-2. published online EpubJun. - DOI - PMC - PubMed
    1. Benator D, Bhattacharya M, Bozeman L, Burman W, Cantazaro A, Chaisson R, Gordin F, Horsburgh CR, Horton J, Khan A, Lahart C, Metchock B, Pachucki C, Stanton L, Vernon A, Villarino ME, Wang YC, Weiner M, Weis S C. Tuberculosis Trials. Rifapentine and isoniazid once a week versus rifampicin and isoniazid twice a week for treatment of drug-susceptible pulmonary tuberculosis in HIV-negative patients: a randomised clinical trial. Lancet. 2002;360:528–534. published online. - PubMed
    1. Johnson JL, Hadad DJ, Dietze R, Maciel EL, Sewali B, Gitta P, Okwera A, Mugerwa RD, Alcaneses MR, Quelapio MI, Tupasi TE, Horter L, Debanne SM, Eisenach KD, Boom WH. Shortening treatment in adults with noncavitary tuberculosis and 2-month culture conversion. American journal of respiratory and critical care medicine. 2009;180:558–563. doi: 10.1164/rccm.200904-0536OC. published online EpubSep 15. - DOI - PMC - PubMed
    1. Phillips PP, Nunn AJ, Paton NI. Is a 4-month regimen adequate to cure patients with non-cavitary tuberculosis and negative cultures at 2 months? The international journal of tuberculosis and lung disease : the official journal of the International Union against Tuberculosis and Lung Disease. 2013;17:807–809. doi: 10.5588/ijtld.12.0725. published online EpubJun. - DOI - PubMed

Publication types

MeSH terms