. 2014 Dec 3;6(265):265ra167.
doi: 10.1126/scitranslmed.3009500.

PET/CT imaging reveals a therapeutic response to oxazolidinones in macaques and humans with tuberculosis

Affiliations

PET/CT imaging reveals a therapeutic response to oxazolidinones in macaques and humans with tuberculosis

M Teresa Coleman et al. Sci Transl Med. .

Abstract

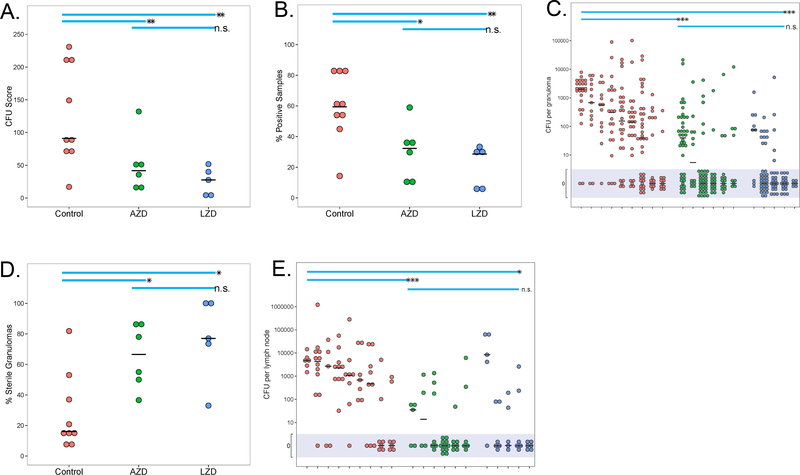
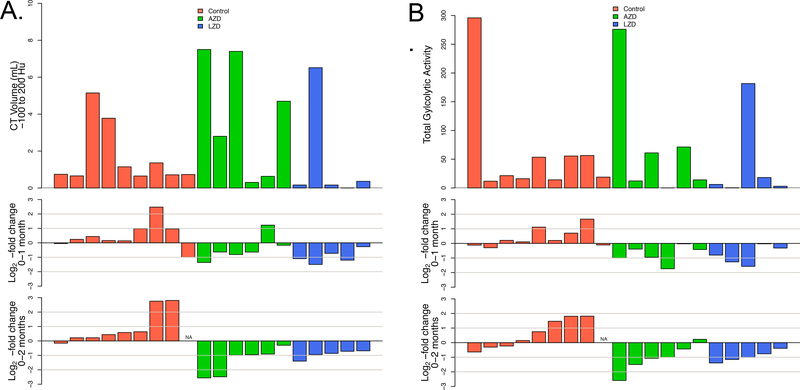
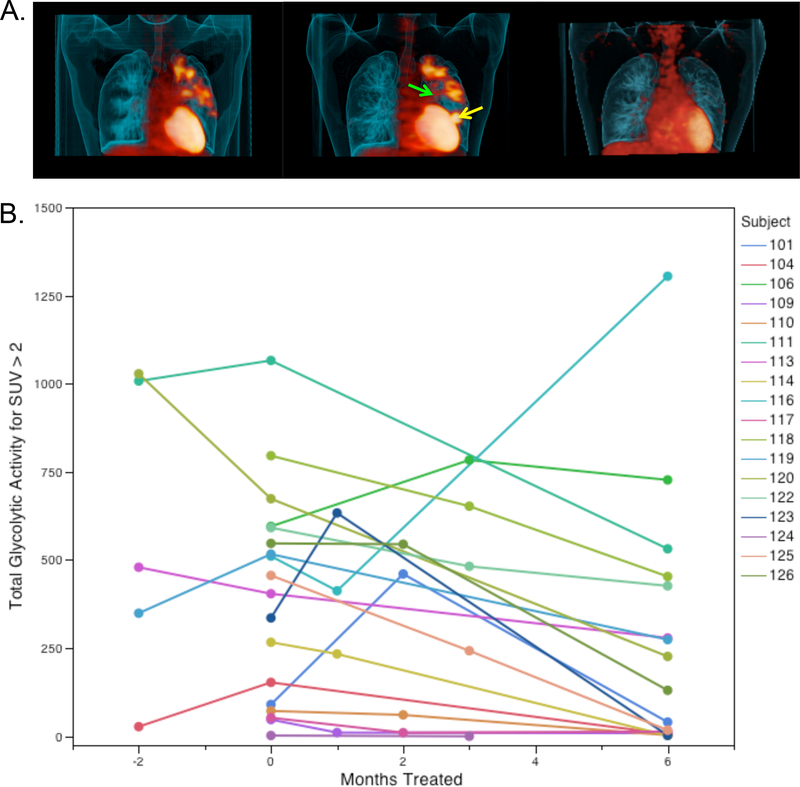
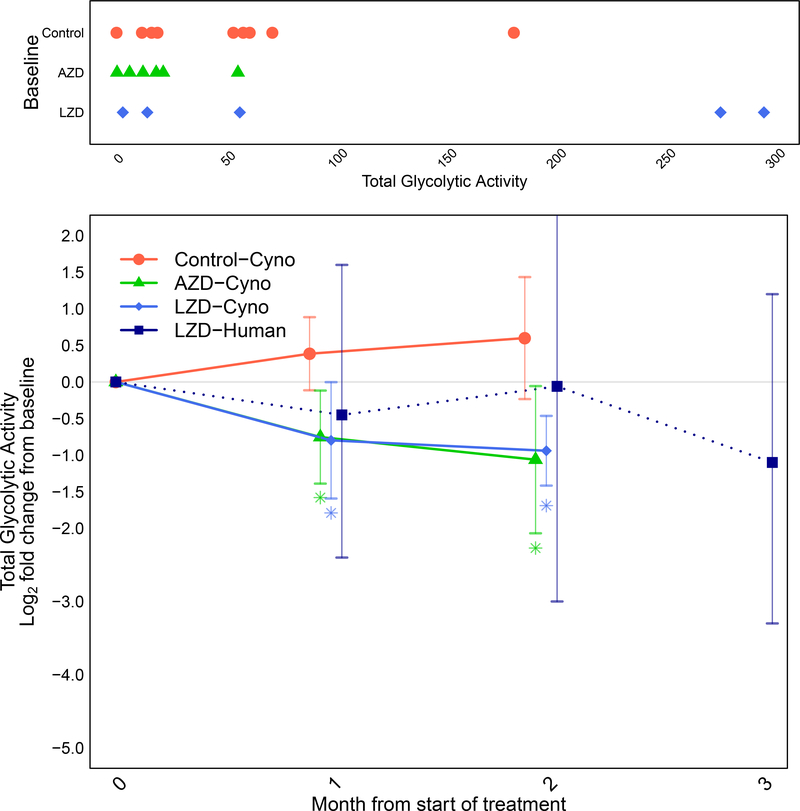
Oxazolidinone antibiotics such as linezolid have shown significant therapeutic effects in patients with extensively drug-resistant (XDR) tuberculosis (TB) despite modest effects in rodents and no demonstrable early bactericidal activity in human phase 2 trials. We show that monotherapy with either linezolid or AZD5847, a second-generation oxazolidinone, reduced bacterial load at necropsy in Mycobacterium tuberculosis-infected cynomolgus macaques with active TB. This effect coincided with a decline in 2-deoxy-2-[(18)F]-fluoro-d-glucose positron emission tomography (FDG PET) imaging avidity in the lungs of these animals and with reductions in pulmonary pathology measured by serial computed tomography (CT) scans over 2 months of monotherapy. In a parallel phase 2 clinical study of linezolid in patients infected with XDR-TB, we also collected PET/CT imaging data from subjects receiving linezolid that had been added to their failing treatment regimens. Quantitative comparisons of PET/CT imaging changes in these human subjects were similar in magnitude to those observed in macaques, demonstrating that the therapeutic effect of these oxazolidinones can be reproduced in this model of experimental chemotherapy. PET/CT imaging may be useful as an early quantitative measure of drug efficacy against TB in human patients.


Conflict of interest statement

Competing interests: The authors declare no competing interests.

Figures

Fig. 1.
Fig. 1.. LZD or AZD5847 treatment reduces bacterial burden in macaques.
(A) Overall bacterial burden (CFU score) was lower in LZD- or AZD-treated macaques, compared to untreated controls. CFU score took into account bacterial burden from all grossly visible granulomas and areas of pathology, lymph nodes, extrapulmonary sites, and random lung tissue, as previously described (21). (B) This panel shows the percentage of tissue samples (lung tissue, granulomas, lymph nodes, extrapulmonary organs) from each individual animal at necropsy that were positive for Mtb growth. (C) Individual granulomas were plated for total CFU (each circle represents a granuloma, each individual animal is shown) and the mean CFU/granuloma (solid line) was calculated; shaded area reflects all those granulomas below level of detection). (D) The percentage of granulomas failing to yield any culturable bacilli when plated was reduced by oxazolidinone treatment (each symbol is an individual animal). (E) The total CFU within each thoracic lymph node was reduced by LZD or AZD treatment compared to untreated controls (symbols represent each individual thoracic lymph node in each animal). P-values are indicated as follows: * p<0.05, ** p<0.01, ***p<0.001. The short horizontal black line indicates median.
Fig. 2.
Fig. 2.. Radiologic response rates of oxazolidinone-treated animals by treatment group.
(A) Volume of “hard” abnormal CT density (−100 to 200 HU) for each animal at baseline (top panel), log2-fold change from baseline to one month (middle panel), log2-fold change from baseline to two months (bottom panel). (B) Total glycolytic activity (TGA) for each animal at baseline (top panel), log2-fold change from baseline to one month (middle panel), log2-fold change from baseline to two months (bottom panel).
Fig. 3.
Fig. 3.. Radiologic response rates for subjects in the LZD substudy.
(A) Representative subject in the delayed arm who was enrolled failing all available therapy and monitored for two months prior to receiving LZD treatment. The left scan shows the FDG PET scan at study entry, the center scan immediately prior to receiving LZD and the right scan after six months of LZD therapy. All scans are shown projected at the same standardized uptake value (SUV). This subject finished two years of LZD therapy and was disease-free at their follow-up visit six months after discontinuing therapy. (B) Temporal responses of individual subjects during LZD therapy. Individual subjects received three scans in total and were randomly allocated to different scanning times. “−2” refers to subjects enrolled in the delayed start arm who received a study entry exam but had no change to their failing regimen and also received a second scan immediately prior to the start of therapy. “0” (on the x-axis) refers to the scan collected prior to administration of LZD (up to one week prior to drug start). Scans were collected within a two-week period of the indicated time point. P=0.005 for the difference in mean total glycolytic activity (TGA) between month 0 and month 6.
Fig. 4.
Fig. 4.. CT findings of a patient showing an initial response to therapy followed by emergence of LZD resistance.
This subject presented with bilateral, apical disease with the major site of FDG avidity being the left upper lung (yellow and see fig. S5). At one month (left bottom shows the isolated left lung) this site of disease showed a modest reduction in metabolic activity and a slight resolution of CT features consistent with a positive response to therapy but at six months (bottom right) a new lesion (red) emerged anterior and inferior to the initial large apical cavity in the left upper lobe. The patient initially converted their sputum smear and culture to negative but subsequently developed LZD-resistant bacteria that was confirmed genetically to map to the LZD binding site.
Fig. 5.
Fig. 5.. Comparison of radiologic response rates in humans and macaques by PET.
(Top) Baseline extents of disease in individual animals by treatment group showing the total glycolytic activity (TGA) in all areas of FDG uptake. (Bottom) Longitudinal changes in average log2-fold change (and 95% confidence intervals) in TGA relative to baseline by treatment group for non-human primates and humans (linezolid treatment only). Colored asterisks indicate statistical significance relative to control arm mean (*P<0.05). Dotted line connecting human linezolid values indicates that different subjects were represented by their mean values at months 1, 2 and 3.

References

    1. Zumla A, George A, Sharma V, Herbert N, Baroness Masham of I, WHO’s 2013 global report on tuberculosis: successes, threats, and opportunities. Lancet 382, 1765–1767 (2013). - PubMed
    1. World Health Organization, in Treatment of Tuberculosis: Guidelines. 4th edition. (Geneva, 2010). - PubMed
    1. Christian KA, Ijaz K, Dowell SF, Chow CC, Chitale RA, Bresee JS, Mintz E, Pallansch MA, Wassilak S, McCray E, Arthur RR, What we are watching--five top global infectious disease threats, 2012: a perspective from CDC’s Global Disease Detection Operations Center. Emerging health threats journal 6, 20632 (2013). - PMC - PubMed
    1. Franzblau SG, DeGroote MA, Cho SH, Andries K, Nuermberger E, Orme IM, Mdluli K, Angulo-Barturen I, Dick T, Dartois V, Lenaerts AJ, Comprehensive analysis of methods used for the evaluation of compounds against Mycobacterium tuberculosis. Tuberculosis 92, 453–488 (2012). - PubMed
    1. Dartois V, Barry CE 3rd, A medicinal chemists’ guide to the unique difficulties of lead optimization for tuberculosis. Bioorganic & medicinal chemistry letters 23, 4741–4750 (2013). - PMC - PubMed

Publication types