. 2015 Feb;89(4):2121-35.
doi: 10.1128/JVI.02257-14. Epub 2014 Dec 3.

The amphipathic helix of adenovirus capsid protein VI contributes to penton release and postentry sorting

Affiliations

The amphipathic helix of adenovirus capsid protein VI contributes to penton release and postentry sorting

Ruben Martinez et al. J Virol. 2015 Feb.

Abstract

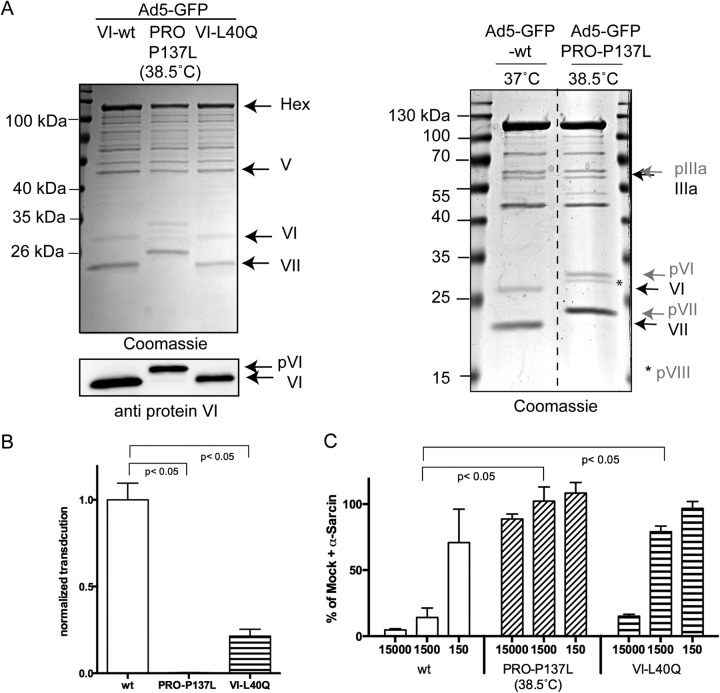
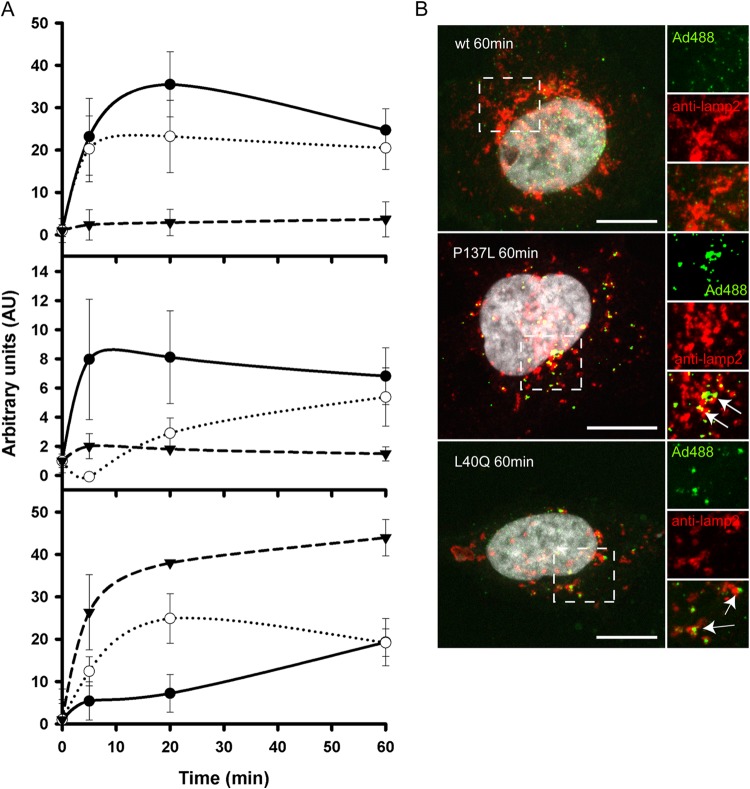
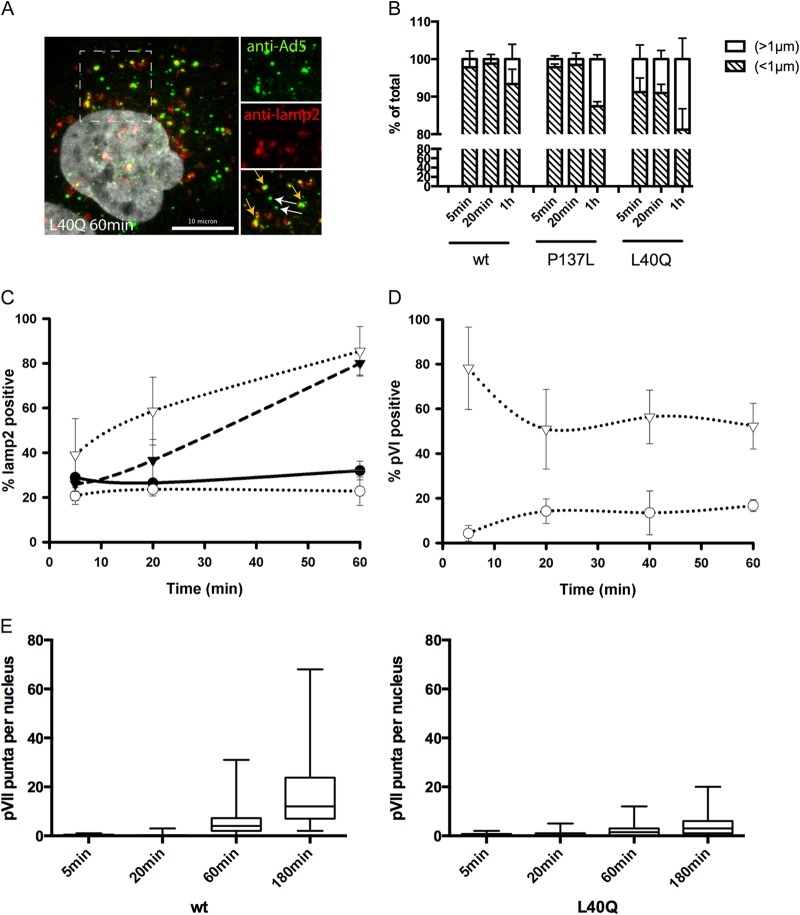
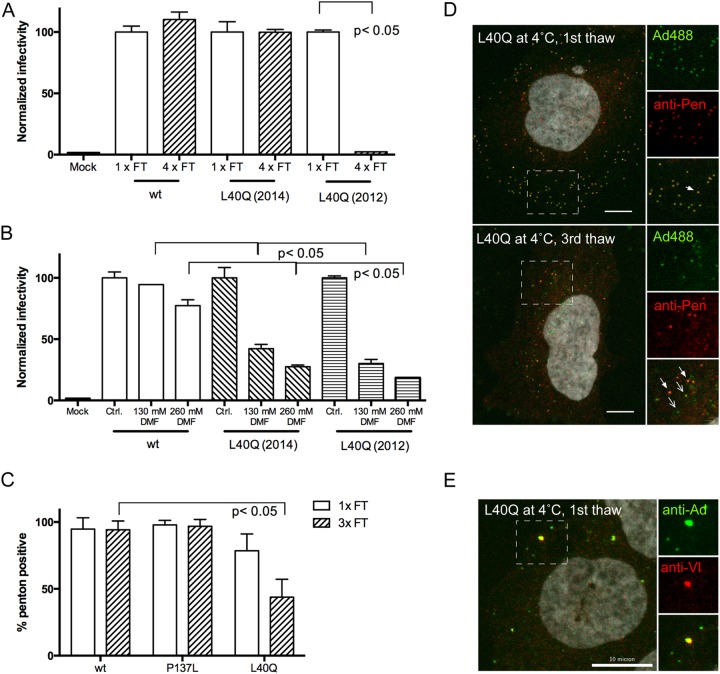
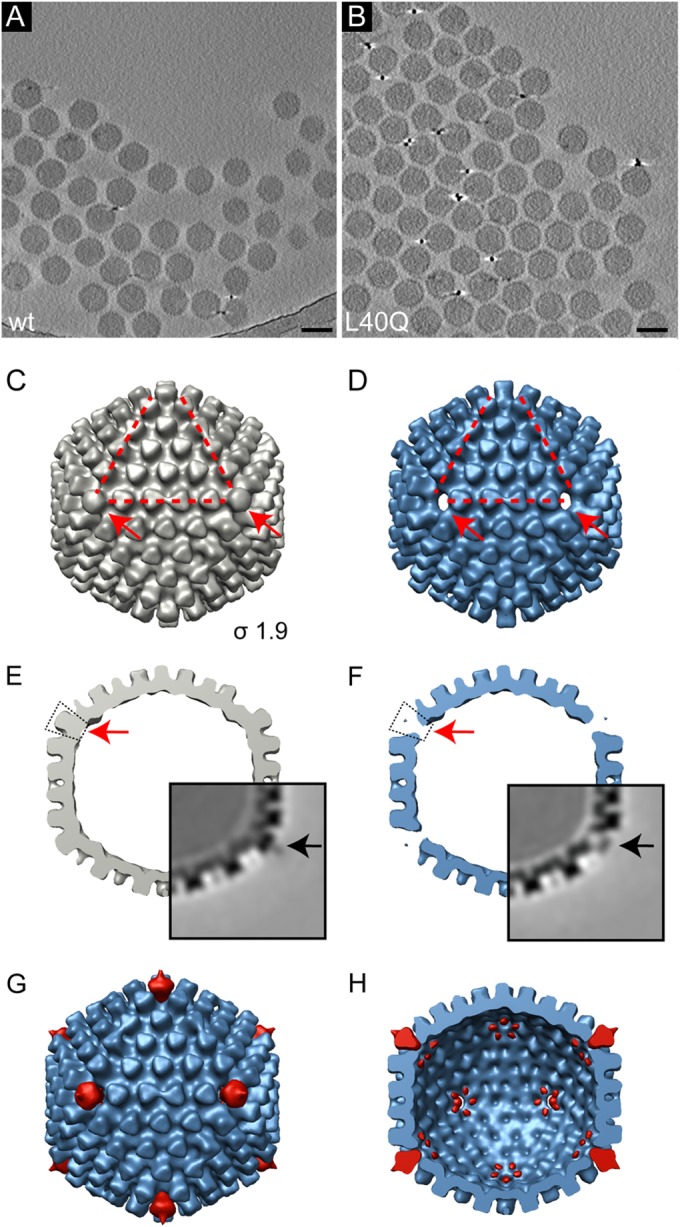
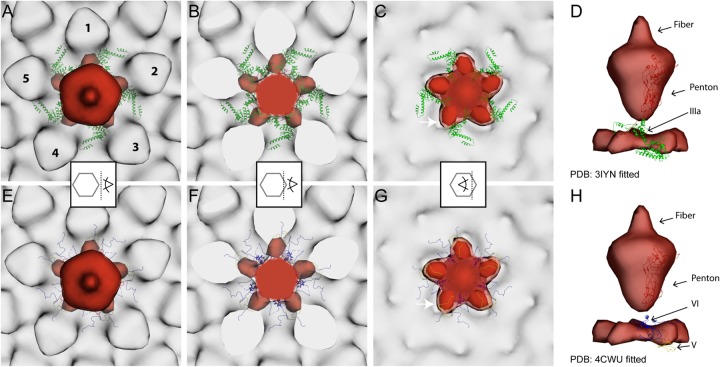
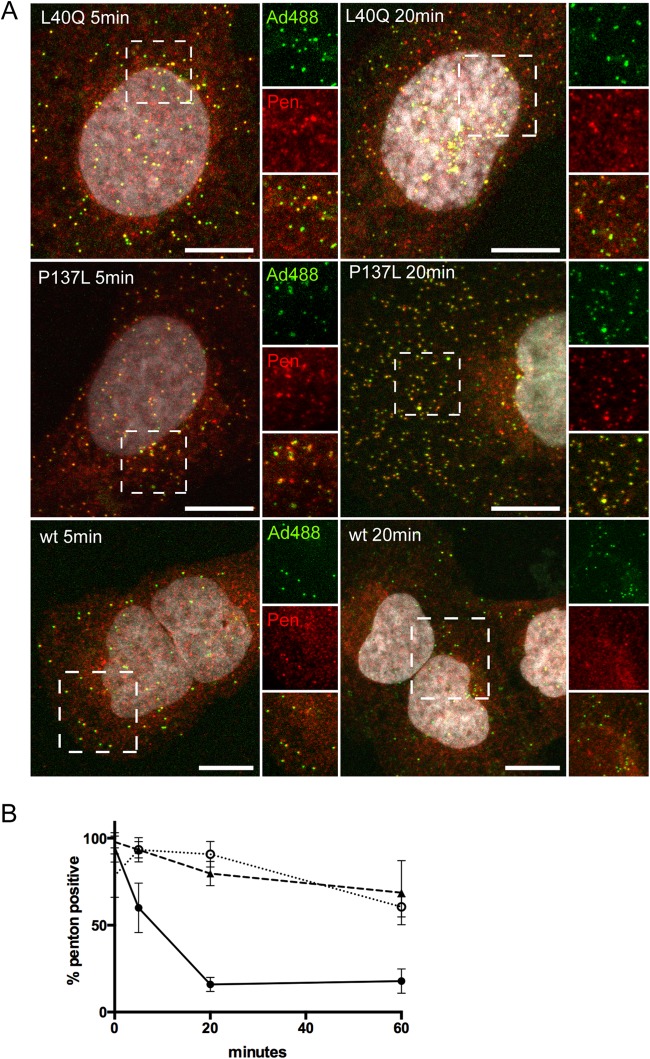
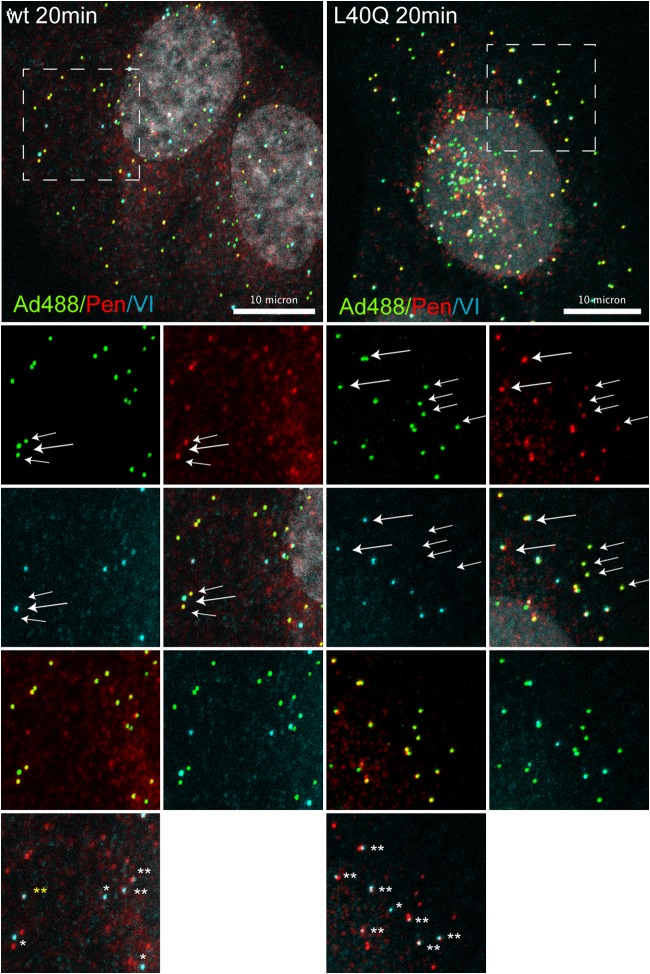
Nuclear delivery of the adenoviral genome requires that the capsid cross the limiting membrane of the endocytic compartment and traverse the cytosol to reach the nucleus. This endosomal escape is initiated upon internalization and involves a highly coordinated process of partial disassembly of the entering capsid to release the membrane lytic internal capsid protein VI. Using wild-type and protein VI-mutated human adenovirus serotype 5 (HAdV-C5), we show that capsid stability and membrane rupture are major determinants of entry-related sorting of incoming adenovirus virions. Furthermore, by using electron cryomicroscopy, as well as penton- and protein VI-specific antibodies, we show that the amphipathic helix of protein VI contributes to capsid stability by preventing premature disassembly and deployment of pentons and protein VI. Thus, the helix has a dual function in maintaining the metastable state of the capsid by preventing premature disassembly and mediating efficient membrane lysis to evade lysosomal targeting. Based on these findings and structural data from cryo-electron microscopy, we suggest a refined disassembly mechanism upon entry.

Importance: In this study, we show the intricate connection of adenovirus particle stability and the entry-dependent release of the membrane-lytic capsid protein VI required for endosomal escape. We show that the amphipathic helix of the adenovirus internal protein VI is required to stabilize pentons in the particle while coinciding with penton release upon entry and that release of protein VI mediates membrane lysis, thereby preventing lysosomal sorting. We suggest that this dual functionality of protein VI ensures an optimal disassembly process by balancing the metastable state of the mature adenovirus particle.


Figures

FIG 1
FIG 1
Transduction efficiencies and membrane lysis of adenovirus mutants. (A) (Left, top) Coomassie gel of purified GFP-expressing adenoviruses as indicated above the lanes. The corresponding viral proteins are identified on the right. (Left, bottom) Western blot using antibodies against protein VI of the same viruses. Note the size shift of the VI signal for the PRO-P137L virus. (Right) Side-by-side comparison of wt virus and PRO-P137L (grown at the nonpermissive temperature) showing the selective migration differences of unprocessed precursor capsid proteins. Unprocessed precursor capsid proteins are labeled and indicated by arrows in gray and mature capsid proteins in black. (B) Relative transduction efficiency of the wt virus compared to the PRO-P137L and PVI-L40Q mutant virus. Cells were transduced with GFP-expressing viruses at 100 pp/c, and the transduction efficiency was normalized to 1 for the wt virus for comparison. (C) Membrane lysis assay. For each virus, cells were incubated with three different particle amounts (the x axis represents pp/c) in the presence of the membrane-impermeable translation inhibitor α-sarcin. 35S incorporation was measured and plotted against the incorporation efficiency in the presence of α-sarcin alone, arbitrarily set as a 100% incorporation rate. The shorter bars correspond to translational inhibition due to α-sarcin uptake following membrane lysis. The error bars correspond to SD for the results of two individual experiments, each performed in triplicate.
FIG 2
FIG 2
Quantitative analysis of protein VI release, membrane lysis, and lysosome association during virus entry. (A) (Top) Quantification of protein VI release over time. Cells were infected with Alexa 488-labeled wt virus (black circles), PVI-L40Q virus (open circles), or PRO-P137L virus (black triangles), and protein VI-positive viruses were identified by antibody staining at the indicated time points. The error bars indicate cell-to-cell variations (n ≥ 100 particles). (Middle) Quantification of galectin 3 association of viruses over time. Cells were infected with Alexa 488-labeled viruses as for the top graph, fixed, and stained for endogenous galectin 3 at the indicated time points. The error bars indicate cell-to-cell variations (n ≥ 100 particles). (Bottom) Quantification of virus association with lamp-2. Cells were infected with Alexa 488-labeled virus as for the top graph, and association of virus with lamp-2 was quantified at each time point. The error bars indicate cell-to-cell variations (n ≥ 100 particles). (B) Immunofluorescence analysis of virus association with lamp-2. Cells were infected with Alexa 488-labeled wt virus (top), PRO-P137L virus (middle), and PVI-L40Q virus (bottom) for 1 h and stained for lamp-2 association. Viruses are depicted in green, lamp-2 in red, and the DAPI signal in gray. Enlargements of the dashed boxes are depicted on the right. Clusters of virus colocalizing with lamp-2 appear yellow and are indicated by arrows. Scale bars, 10 μm.
FIG 3
FIG 3
Differential sorting of PVI-L40Q mutant virus into lysosomes. (A) Sorting of PVI-L40Q mutant virus into lysosomes. Cells were infected with unlabeled PVI-L40Q mutant virus and fixed at 60 min postinfection, followed by antibody detection of virus particles. Enlarged details from the dashed box are shown on the right, with the virus signal (top; green), antibody detection of lamp-2 (middle; red), and merged image (bottom). The white arrows indicate lamp-2-free viruses (small particles), and the orange arrows indicate virus associated with lamp-2 (large particles). (B) Particle detection by size. Cells were infected with unlabeled wt, PVI-L40Q, or PRO-P137L virus and fixed at the indicated times, and particles were detected using anti-Ad5 antibodies. The signals were quantified and scored according to size using the indicated cutoffs and are displayed as percentages of the total. The error bars indicate cell-to-cell variation. (C) PVI-L40Q mutant virus lamp-2 association by size. Infections were carried out as for panel B. Virus was detected using antibodies against Ad5 and lamp-2, and lamp-2-positive viruses were plotted over time. The black circles represent wt and the black triangles PRO-P137L virus. The open circles represent PVI-L40Q mutant viruses below the size cutoff (as in panel B) and the open triangles viruses above the size cutoff. (D) PVI-L40Q mutant virus protein VI association by size. The experiment was performed as for panel C. Virus was detected using antibodies against Ad5 and protein VI, and protein VI-positive viruses were plotted over time. The symbols are as in panel C. (E) Nuclear accumulation of protein VII dots. Cells were infected as for panel B, fixed at the indicated times, and stained with antibodies against protein VII. The distribution of protein VII signals per nucleus is shown as box-and-whisker plots (minimum to maximum). Shown are cells infected with the wt virus (left) and with the PVI-L40Q mutant virus (right).
FIG 4
FIG 4
Altered capsid stability for Ad-PVI-L40Q. (A) Freeze-thaw (FT) sensitivity. Aliquoted virus was used in transduction assays and refrozen as indicated below the bars. Transduction efficiency was normalized to the efficiency after the first thaw (100%). Two independent virus preparations were used. Only the PVI-L40Q preparation from 2012, which had been in storage for 2 years at −80°C, was sensitive to repeated freeze-thaw cycles. Error bars represent the mean for one representative experiment performed in triplicate. (B) Solvent sensitivity. Viruses, as indicated below the bars, were incubated with DMF at the indicated concentrations, and the relative transduction efficiency was compared to that of the wt virus in DMEM only (100%). Note that both PVI-L40Q preparations were sensitive to DMF treatment. Error bars represent the mean for one representative experiment performed in duplicate. (C) Penton association upon repeated freeze-thaw cycles. Viruses, as indicated below the bars, were subjected to one or three repeated freeze-thaw cycles and incubated with cells at 4°C for 30 min, followed by fixation and antibody staining for pentons. The percentages of penton-positive particles are indicated. Note the loss of penton association for the PVI-L40Q virus upon repeated freeze-thaw treatment. Error bars represent cell-to-cell variation. (D) As for C, comparing 2012 PVI-L40Q particles bound to cells after one (top) or three (bottom) freeze-thaw cycles. Details of the boxed areas, with viruses in green, penton antibody staining in red, and the overlaid images, are shown on the right. Penton-positive particles are indicated by solid arrows, and particles lacking penton staining are indicated by open arrows. (E) Premature protein VI exposure. Cells were incubated with unlabeled PVI-L40Q mutant virus (1 thaw) at 4°C and fixed, followed by immunofluorescence detection of virus particles and protein VI. Enlarged details from the dashed box are shown on the right, with the virus signal (top; green), immunofluorescence of protein VI (middle; red), and merged images (bottom). Viruses positive for protein VI appear yellow. Similar results were obtained for both PVI-L40Q virus preparations. Scale bars, 10 µm.
FIG 5
FIG 5
Cryo-ET and 3D reconstructions from subtomogram averaging of freeze-thaw-treated wt and PVI-L40Q mutant adenoviruses reveals loss of pentons. (A and B) Computational slices through a tomogram of frozen, hydrated preparations of freeze-thaw-treated (three times) Alexa 488-labeled wt viruses (A) and PVI-L40Q mutant viruses (B). Particles are intact, showing no apparent disruption. Scale bar, 100 nm. (C and D) Subtomogram averages of wt (C) (gray) and PVI-L40Q (D) (blue). The isosurface threshold was set 1.9σ above the mean density. The corners of the red triangles indicate the positions of 3 of the 12 vertices, which are also indicated by the arrows. (E and F) Same reconstruction as in panels C and D, but viewed as a central section. The red arrows indicate the vertex positions of the capsid, revealing the absence of penton bases in the mutant capsid (F). The insets show the central slice of the subvolume-averaged density map in grayscale. Higher density is shown in black. The electron density in light gray indicates the presence of fiber proteins in the wt average (E, black arrow) and few remaining penton bases in the PVI-L40Q virus (F, black arrow). (G and H) Difference maps (red) calculated between the wt and PVI-L40Q average superimposed on the PVI-L40Q average (blue) as seen from the outside (G) and as a cut open view into the inside of the capsid (H). The capsid reconstructions and difference maps are shown at the same threshold (1.9σ). The main difference is the loss of the penton base proteins, with starfish-shaped rearrangements of the peripentonal proteins located on the inner side of the capsid shell.
FIG 6
FIG 6
Difference maps between wt and PVI-L40Q mutant adenoviruses identify structural differences in the vertex region. Shown are difference maps (red) between the wt and the PVI-L40Q mutant superimposed onto the wt average (light gray). The isosurface threshold was set 1.9σ above the mean density. The two most recent, and contradictory, atomic models of wt capsid proteins (PDB 3IYN and 4CWU) were fitted into the wt subtomogram average map (A to D and E to H, respectively). Only penton proteins (red) and peripentonal cement proteins located inside the virion are displayed as ribbons: IIIa (green), V (yellow), and VI (blue). The positions of the peripentonal hexons are indicated by the numbers 1 to 5 in panel A. The superimposed maps are viewed from the outside, with a transparent surface rendering (A and E) or sliced through (B and F) or inside (C and G) the capsid vertex region, as indicated by the pictogram scheme in the middle of each column. (C and G) The difference map shown at a lower threshold of 1.6σ (lighter red) indicates that the structural differences between the wt and PVI-L40Q affects the whole peripentonal area (starfish-like density), with a maximum difference in the peripentonal hexons inner cavity (arrow). (D and H) Direct comparison between the locations of the atomic models and the difference map shows that the difference map includes part of V and is tightly associated with VI (H).
FIG 7
FIG 7
Entry-dependent penton release. (A) Cells were infected with Alexa 488-labeled VI-L40Q viruses (top row), PRO-P137L viruses (middle row), and wt viruses (bottom row); fixed after 5 min (left column) or 20 min (right column); and stained for pentons using specific antibodies. Viruses are depicted in green and penton antibody stain in red. The dashed boxes in each panel are enlarged on the right, depicting virus, pentons, and a merged image. Note that separation of the penton and virus signal for the wt virus occurs at 20 min, but not for the PRO-P137L or the L40Q virus. (B) The experiment was performed as for panel A. Cells were infected with Alexa 488-labeled wt virus (black circles), PVI-L40Q virus (open circles), or PRO-P137L virus (black triangles). Antibody staining was quantified at 5 min, 20 min, and 60 min postinfection, and penton-positive virions were plotted for each virus. The error bars are cell-to-cell variations (n > 100 virus particles). Scale bars, 10 μm.
FIG 8
FIG 8
Analysis of codeployment of pentons and protein VI from entering virus particles. Shown is immunofluorescence analysis of virus association with capsid protein VI and pentons. Cells were infected with Alexa 488-labeled wt virus (left) and PVI-L40Q virus (right) for 20 min and stained for capsid protein VI and penton association. Viruses are depicted in green, pentons in red, protein VI in light blue, and the DAPI signal in gray. Enlargements of the dashed boxes showing pairs of associations are depicted below. Viruses positive for pentons are indicated by small arrows, and viruses positive for protein VI are indicated by large arrows. In the bottom images, double-positive viruses are indicated with two white stars, protein VI-positive viruses with one white star, and penton/protein VI signal without viruses by two yellow stars. Scale bars, 10 μm.

References

    1. Greber UF, Willetts M, Webster P, Helenius A. 1993. Stepwise dismantling of adenovirus 2 during entry into cells. Cell 75:477–486. doi:10.1016/0092-8674(93)90382-Z. - DOI - PubMed
    1. Suomalainen M, Greber UF. 2013. Uncoating of non-enveloped viruses. Curr Opin Virol 3:27–33. doi:10.1016/j.coviro.2012.12.004. - DOI - PubMed
    1. Smith JG, Wiethoff CM, Stewart PL, Nemerow GR. 2010. Adenovirus. Curr Top Microbiol Immunol 343:195–224. doi:10.1007/82_2010_16. - DOI - PMC - PubMed
    1. Nemerow GR, Stewart PL, Reddy VS. 2012. Structure of human adenovirus. Curr Opin Virol 2:115–121. doi:10.1016/j.coviro.2011.12.008. - DOI - PMC - PubMed
    1. Stewart PL, Burnett RM. 1995. Adenovirus structure by X-ray crystallography and electron microscopy. Curr Top Microbiol Immunol 199:25–38. - PubMed

Publication types