

Assessment of airway microbiota and inflammation in cystic fibrosis using multiple sampling methods
- PMID: 25474078
- PMCID: PMC4342834
- DOI: 10.1513/AnnalsATS.201407-310OC
Assessment of airway microbiota and inflammation in cystic fibrosis using multiple sampling methods
Abstract
Rationale: Oropharyngeal (OP) swabs and induced sputum (IS) are used for airway bacteria surveillance in nonexpectorating children with cystic fibrosis (CF). Molecular analyses of these airway samples detect complex microbial communities. However, the optimal noninvasive sampling approach for microbiota analyses and the clinical relevance of microbiota, particularly its relationship to airway inflammation, is not well characterized.
Objectives: The goals of this study were to compare molecular analyses of concurrently collected saliva, OP swabs, IS, and expectorated sputum (ES) from children with CF and to determine the association between microbiota, lung function, and airway inflammation.
Methods: Saliva, OP swabs, IS, and ES were collected from 16 children with CF. Spirometry was performed.
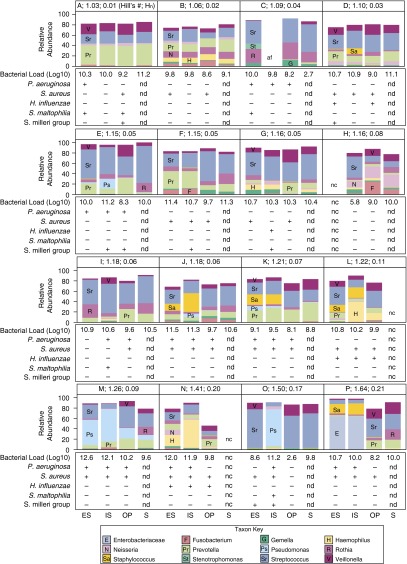
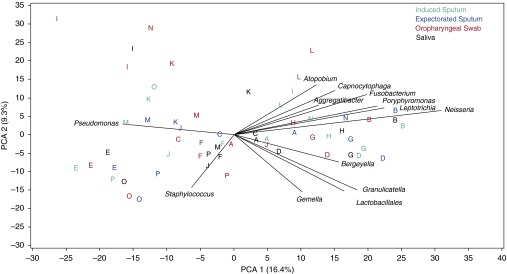
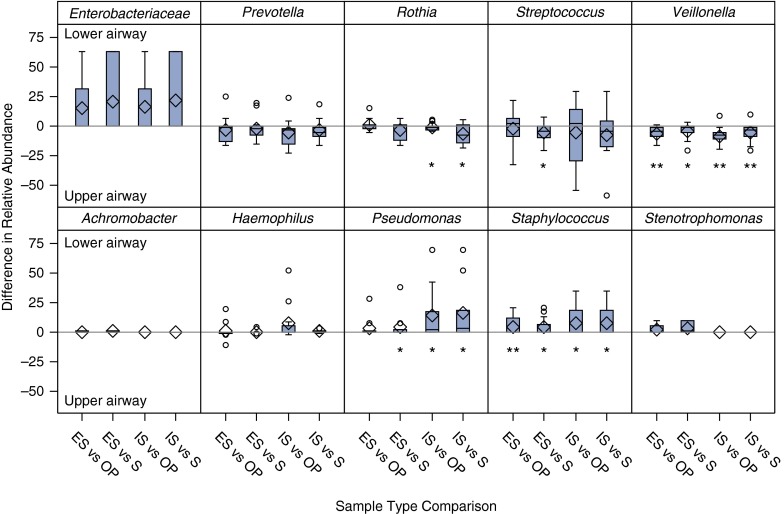
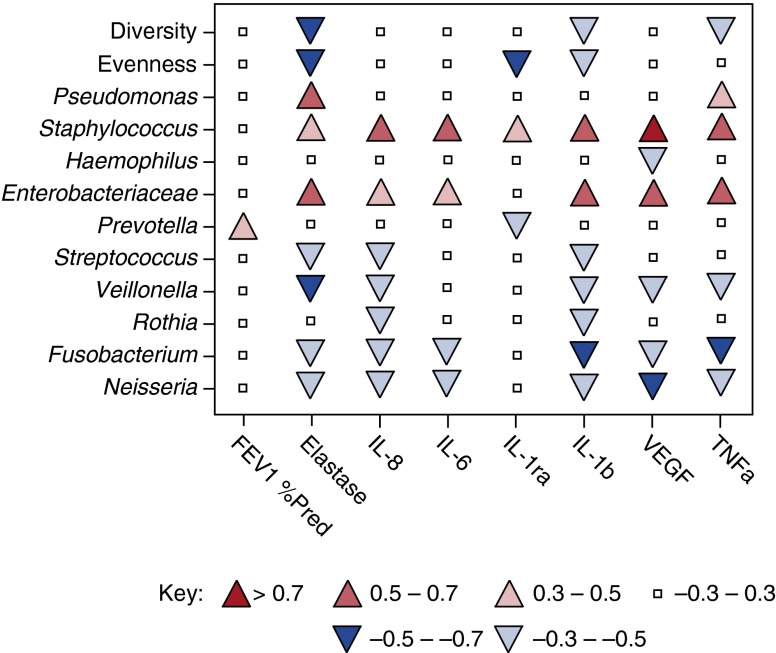
Measurements and main results: Respiratory and saliva samples (n = 61) were sequenced for bacterial microbial communities, and total and CF-specific bacterial quantitative PCR assays were performed. Airway samples underwent conventional culture for CF-specific pathogens. Neutrophil elastase, IL-1β, IL-1ra, IL-6, Il-8, TNF-α, and vascular endothelial growth factor were measured in ES and IS. Sequencing results from individual subjects were similar across samples, with greater between-subject than within-subject variation. However, Pseudomonas and Staphylococcus were detected in higher relative abundance from lower airways (ES and IS) compared with paired upper airway samples (OP and saliva). Pseudomonas, Staphylococcus, and Enterobacteriaceae correlated with increased airway inflammation. Divergence between microbiota in upper airway compared with lower airway samples, indicating greater differences between communities, was associated with increased sputum neutrophil elastase.
Conclusions: Bacteria detected in IS samples resemble ES samples, whereas OP samples may underrepresent bacteria associated with airway inflammation. Divergence of lower airway communities from upper airway was associated with airway inflammation and may portend disease progression.
Keywords: DNA sequencing; bacterial infection; microbiome; oropharyngeal swab; sputum.
Figures
References
-
- Gibson RL, Burns JL, Ramsey BW. Pathophysiology and management of pulmonary infections in cystic fibrosis. Am J Respir Crit Care Med. 2003;168:918–951. - PubMed
-
- Burns JL, Emerson J, Stapp JR, Yim DL, Krzewinski J, Louden L, Ramsey BW, Clausen CR. Microbiology of sputum from patients at cystic fibrosis centers in the United States. Clin Infect Dis. 1998;27:158–163. - PubMed
-
- Saiman L. Microbiology of early CF lung disease. Paediatr Respir Rev. 2004;5(Suppl A):S367–S369. - PubMed
-
- Sibley CD, Rabin H, Surette MG. Cystic fibrosis: a polymicrobial infectious disease. Future Microbiol. 2006;1:53–61. - PubMed
-
- Bittar F, Rolain JM. Detection and accurate identification of new or emerging bacteria in cystic fibrosis patients. Clin Microbiol Infect. 2010;16:809–820. - PubMed
Publication types
MeSH terms
Substances
Grants and funding
LinkOut - more resources
Full Text Sources
Other Literature Sources
Medical
Miscellaneous
