. 2014 Dec 4;10(12):e1004845.
doi: 10.1371/journal.pgen.1004845. eCollection 2014 Dec.

Association mapping across numerous traits reveals patterns of functional variation in maize

Affiliations

Association mapping across numerous traits reveals patterns of functional variation in maize

Jason G Wallace et al. PLoS Genet. .

Abstract

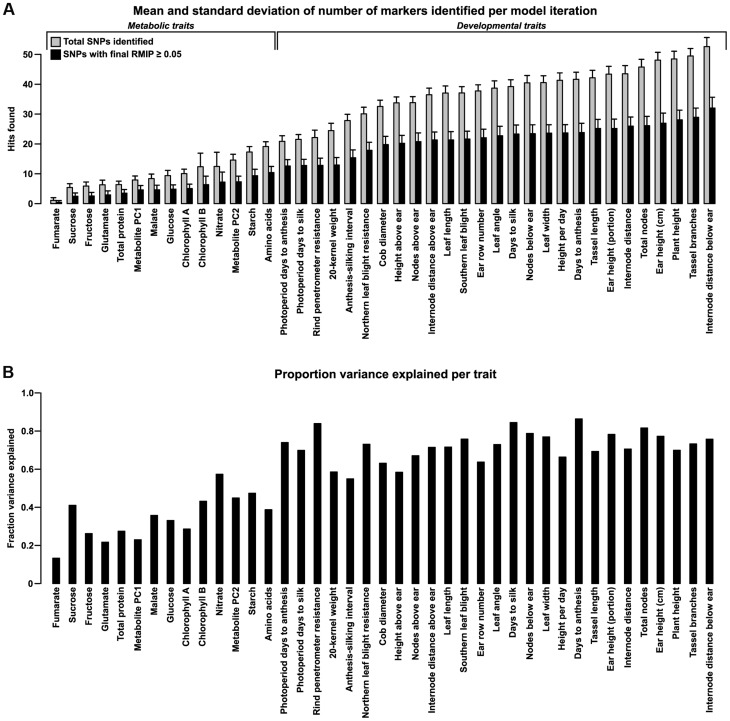
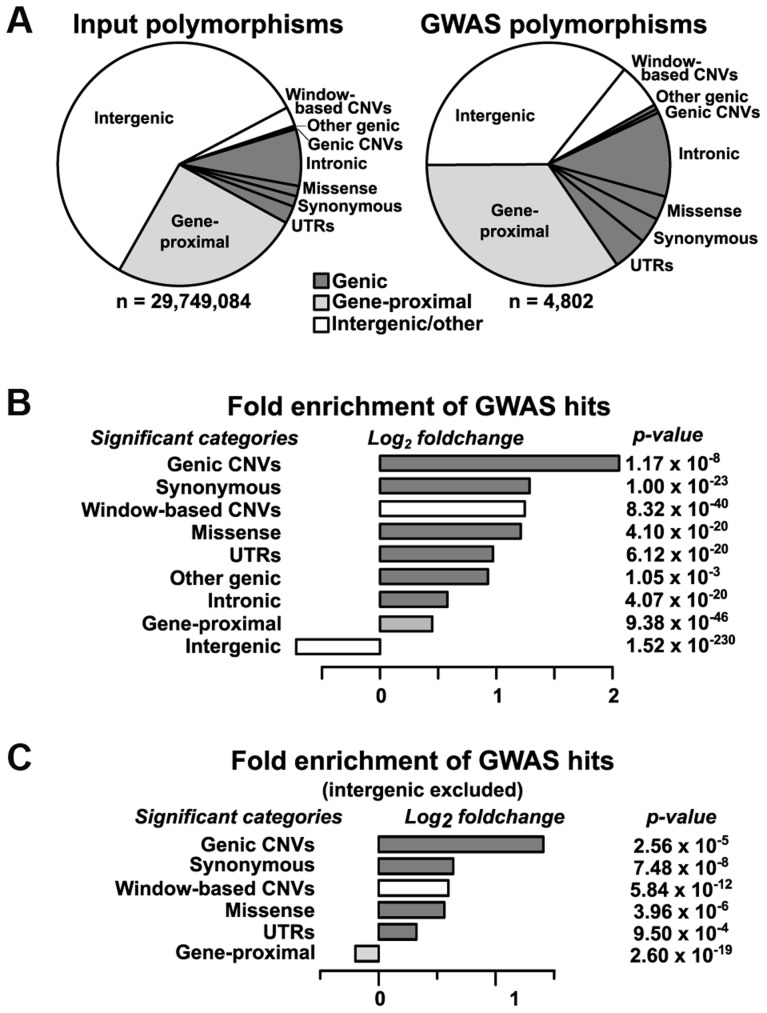
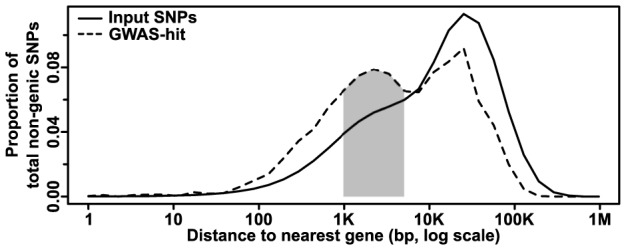
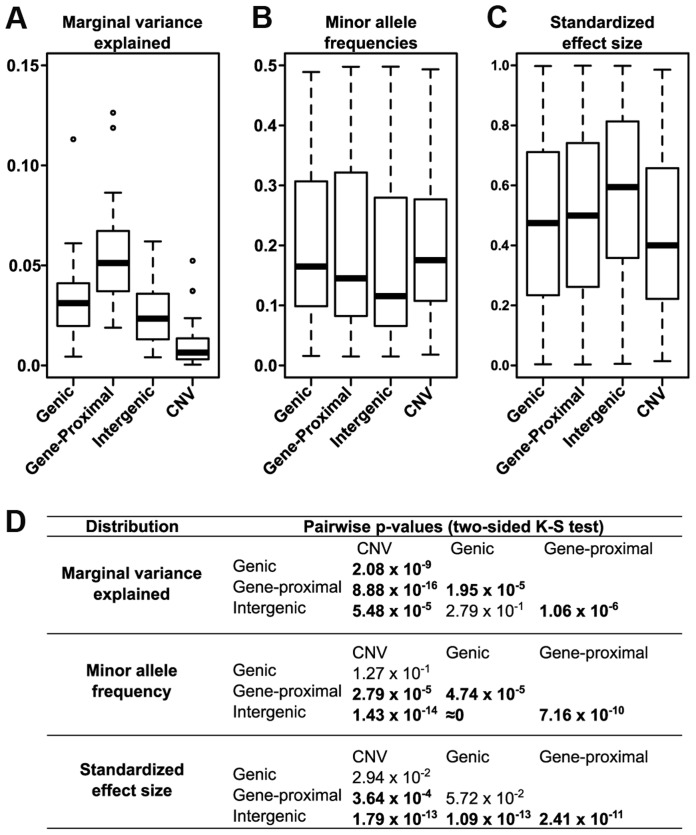
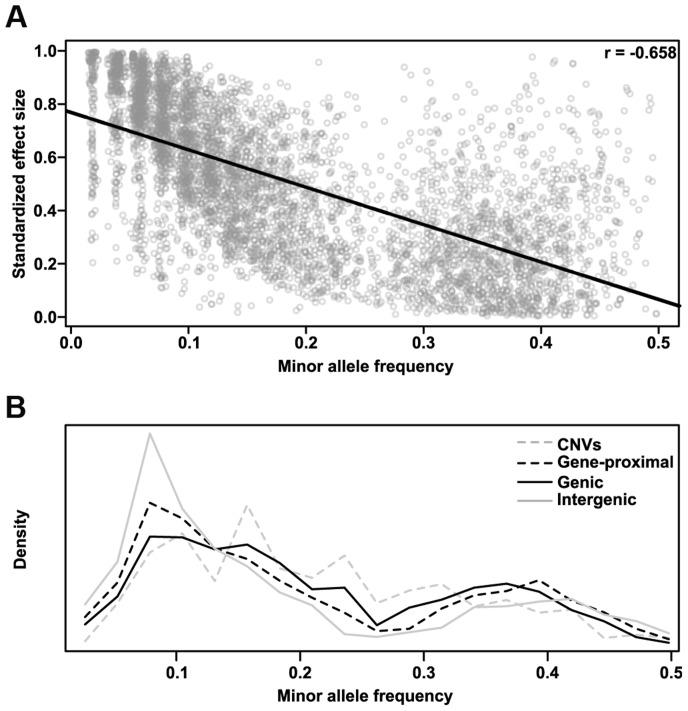
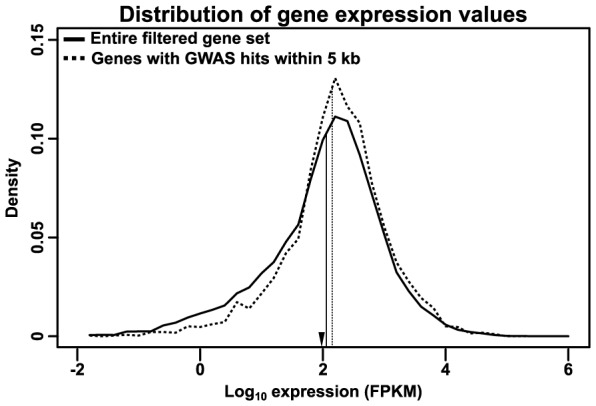
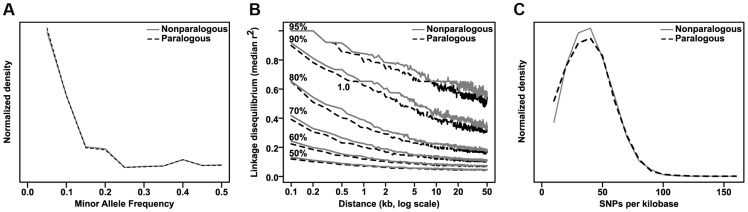
Phenotypic variation in natural populations results from a combination of genetic effects, environmental effects, and gene-by-environment interactions. Despite the vast amount of genomic data becoming available, many pressing questions remain about the nature of genetic mutations that underlie functional variation. We present the results of combining genome-wide association analysis of 41 different phenotypes in ∼ 5,000 inbred maize lines to analyze patterns of high-resolution genetic association among of 28.9 million single-nucleotide polymorphisms (SNPs) and ∼ 800,000 copy-number variants (CNVs). We show that genic and intergenic regions have opposite patterns of enrichment, minor allele frequencies, and effect sizes, implying tradeoffs among the probability that a given polymorphism will have an effect, the detectable size of that effect, and its frequency in the population. We also find that genes tagged by GWAS are enriched for regulatory functions and are ∼ 50% more likely to have a paralog than expected by chance, indicating that gene regulation and gene duplication are strong drivers of phenotypic variation. These results will likely apply to many other organisms, especially ones with large and complex genomes like maize.


Conflict of interest statement

The authors have declared that no competing interests exist.

Figures

Figure 1
Figure 1. Number of polymorphisms found and variance explained for each trait.
(A) Polymorphisms found per trait. Bars show the mean and standard deviation of markers found per iteration before (light bars) and after (dark bars) filtering for RMIP≥0.05 (see Methods). The number of markers found tends to broadly mirror the genetic complexity of each trait, with metabolic traits having fewer markers found than complex, polygenic traits like plant architecture. The relative complexity within each category is less certain, but the pattern still probably holds to a first degree of approximation. (B) Variance explained per trait. For each trait, a general linear model incorporating a family term (for each of the 25 biparental families in NAM) and all SNPs that passed filtering (dark bars in (A)) was fit to the original Best Linear Unbiased Predictors (BLUPs) for each trait. Bars show the portion of total variance explained by the fitted SNPs as measured by adjusted R2.
Figure 2
Figure 2. Relative enrichment of polymorphism classes in GWAS hits.
(A) The proportions of different polymorphism classes in the input dataset (left) and GWAS hits (right). The overall GWAS hit distribution is significantly different from the input at p = 8.74×10⁻³⁵ (Chi-square test). (B) The relative change in polymorphism classes in the GWAS dataset as compared to the input dataset, with the raw p-value of each class shown at right (two-sided exact binomial test). Only categories with Bonferroni-corrected p-values ≤0.01 are shown. The strong depletion of intergenic SNPs in the GWAS dataset drives almost all other categories to appear significantly enriched. Exact category counts and alternate p-values based on circular permutation are available in S1 Table. (C) The same analysis as in (B), but with intergenic regions excluded.
Figure 3
Figure 3. Distribution of non-genic GWAS hits as a function of gene distance.
The number of SNPs at increasing distances from the nearest gene is plotted; CNVs are excluded due to their large size and the difficulty determining where many (especially insertions) actually occur. The input (whole genome) dataset shows a single peak at ∼25 kb away from a gene. The GWAS dataset, however, shows an additional peak at ∼1–5 kb (shaded), where one would expect to find promoters and short-range regulatory elements. Note that due to the log scale, each bin contains successively more nucleotides that make it appear that most SNPs are far from genes, when the reverse is actually true.
Figure 4
Figure 4. Different effects of the polymorphism classes.
(A) Variance explained by polymorphism class. Genic and gene-proximal polymorphisms explain the largest amount of unique variation in each trait. Breaking the data into the two components that most influence variance explained—allele frequency (B) and polymorphism effect size (C)—reveals a negative correlation between them such that classes with larger effect sizes (e.g., intergenic) also tend to have rarer polymorphisms. (D) Pairwise p-values testing whether the distributions in (A-C) are significantly different from each other (two-sided Kolmogorov-Smirnov test); values <1×10⁻³ are bolded.
Figure 5
Figure 5. Polymorphism effect size and allele frequencies.
(A) The standardized effect size of a polymorphism (see Methods) is negatively correlated with minor allele frequency. This correlation is probably due to both biological factors (e.g., large effects are both more likely to deleterious (Fisher 1930; Orr 1998) and more easily selected against than small ones, and thus are more likely to remain rare) and statistical ones (e.g., in order for a rare variant to explain enough variance to be detected in GWAS, it must have a large effect). Similar results were found in a previous analysis of maize inflorescence traits . (B) Minor allele frequency distributions for the different polymorphism classes of GWAS hits. Intergenic hits are strongly enriched for rare alleles. The bimodal distribution in both parts is due to the way NAM was constructed; specifically, since B73 is a parent in all 25 families, any polymorphisms with the rare allele in B73 have their frequency artificially boosted toward 0.5.
Figure 6
Figure 6. Distribution of RNA expression.
Transcript-specific RNA expression values from the Maize Gene Atlas were summed to determine total expression for each gene. The log-transformed distribution of maximum expression values are shown for the entire filtered gene set (solid line) or just genes with GWAS hits within 5 kb of their primary transcripts (dashed line); vertical lines indicate the median of each distribution. The GWAS-hit genes show a slight depletion (∼20%) of low-expressed genes. For comparison, the median expression of maize transcription factors in this dataset (as annotated on Grassius, http://grassius.org/) is indicated by an arrowhead. FPKM, Fragments Per Kilobase of transcript per Million mapped reads.
Figure 7
Figure 7. Comparison of paralogous to nonparalogous genes.
Maize paralogous genes (identified by Schnable & Freeling [52]) were examined for any differences from nonparalogous genes that might spuriously contribute to their enrichment in GWAS analyses. There are no strong differences in either minor allele frequency distribution (A) or linkage disequilibrium decay (B), and the slightly lower SNP density (C) (median 32.8 SNPs/kb versus 33.4 SNPs/kb for nonparalogous genes) would be expected to actually decrease the probability of hitting paralogous genes, albeit by a very small amount.

References

    1. Haines JL, Hauser MA, Schmidt S, Scott WK, Olson LM, et al. (2005) Complement factor H variant increases the risk of age-related macular degeneration. Science 308: 419–421. - PubMed
    1. Wellcome Trust Case Control Consortium (2007) Genome-wide association study of 14,000 cases of seven common diseases and 3,000 shared controls. Nature 447: 661–678. - PMC - PubMed
    1. Ripke S, O'Dushlaine C, Chambert K, Moran JL, Kähler AK, et al. (2013) Genome-wide association analysis identifies 13 new risk loci for schizophrenia. Nat Genet 45: 1150–1159. - PMC - PubMed
    1. CARDIoGRAMplusC4D Consortium, Deloukas P, Kanoni S, Willenborg C, Farrall M, et al. (2013) Large-scale association analysis identifies new risk loci for coronary artery disease. Nat Genet 45: 25–33. - PMC - PubMed
    1. Morris AP, Voight BF, Teslovich TM, Ferreira T, Segrè AV, et al. (2012) Large-scale association analysis provides insights into the genetic architecture and pathophysiology of type 2 diabetes. Nat Genet 44: 981–990. - PMC - PubMed

Publication types

LinkOut - more resources