. 2014 Dec 4;10(12):e1003926.
doi: 10.1371/journal.pcbi.1003926. eCollection 2014 Dec.

ECOD: an evolutionary classification of protein domains

Affiliations

ECOD: an evolutionary classification of protein domains

Hua Cheng et al. PLoS Comput Biol. .

Abstract

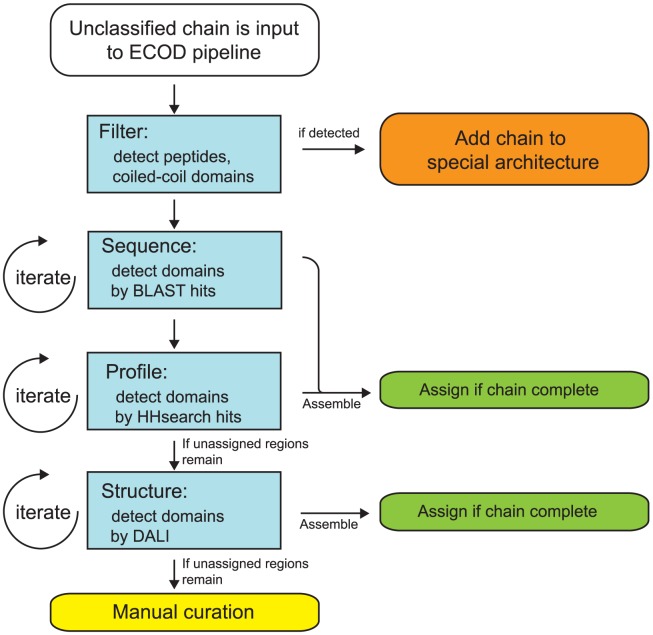
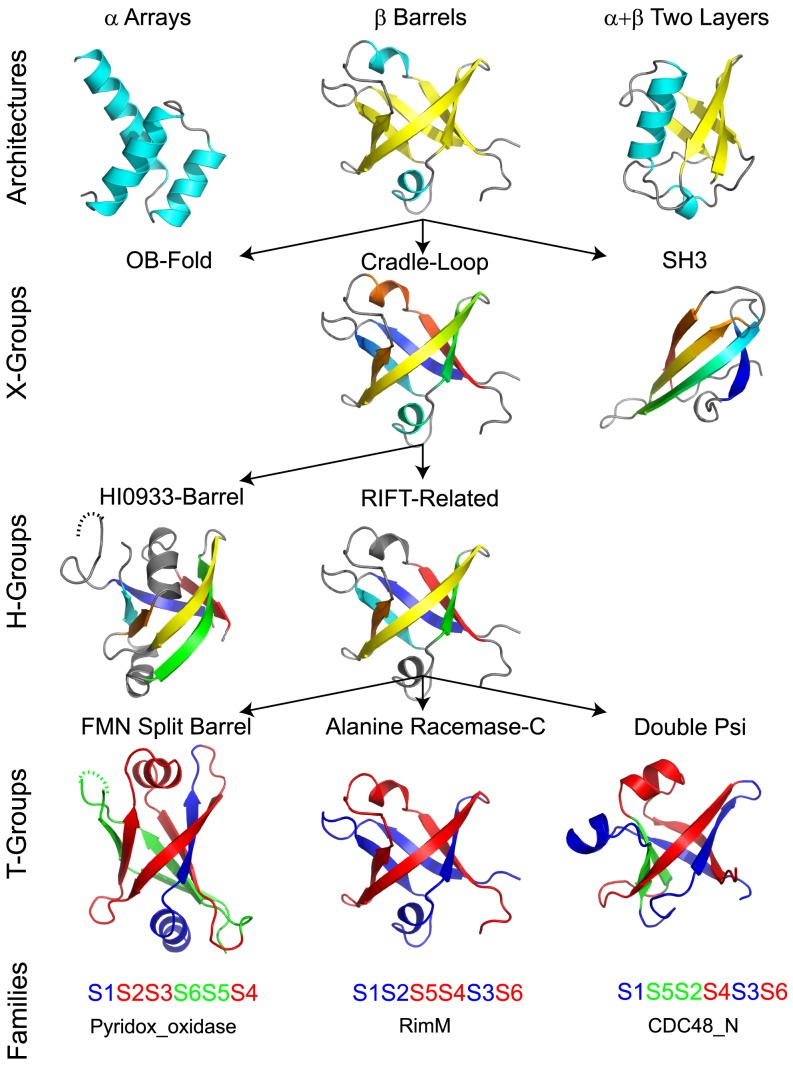
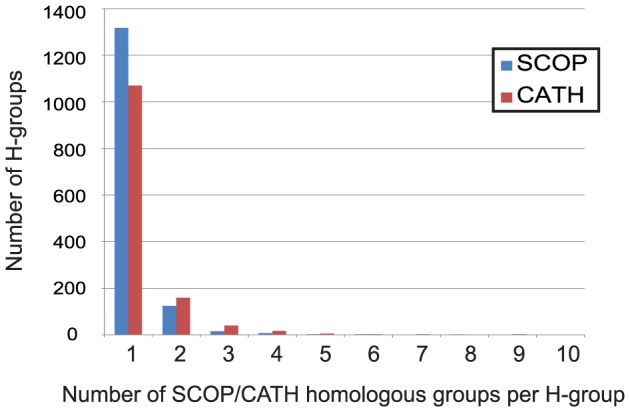
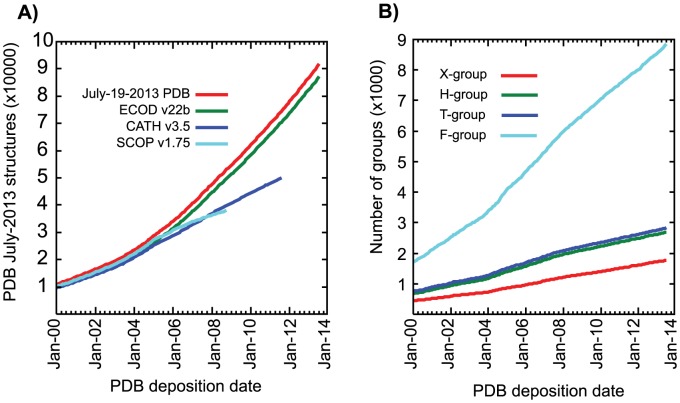
Understanding the evolution of a protein, including both close and distant relationships, often reveals insight into its structure and function. Fast and easy access to such up-to-date information facilitates research. We have developed a hierarchical evolutionary classification of all proteins with experimentally determined spatial structures, and presented it as an interactive and updatable online database. ECOD (Evolutionary Classification of protein Domains) is distinct from other structural classifications in that it groups domains primarily by evolutionary relationships (homology), rather than topology (or "fold"). This distinction highlights cases of homology between domains of differing topology to aid in understanding of protein structure evolution. ECOD uniquely emphasizes distantly related homologs that are difficult to detect, and thus catalogs the largest number of evolutionary links among structural domain classifications. Placing distant homologs together underscores the ancestral similarities of these proteins and draws attention to the most important regions of sequence and structure, as well as conserved functional sites. ECOD also recognizes closer sequence-based relationships between protein domains. Currently, approximately 100,000 protein structures are classified in ECOD into 9,000 sequence families clustered into close to 2,000 evolutionary groups. The classification is assisted by an automated pipeline that quickly and consistently classifies weekly releases of PDB structures and allows for continual updates. This synchronization with PDB uniquely distinguishes ECOD among all protein classifications. Finally, we present several case studies of homologous proteins not recorded in other classifications, illustrating the potential of how ECOD can be used to further biological and evolutionary studies.


Conflict of interest statement

The authors have declared that no competing interests exist.

Figures

Figure 1
Figure 1. Workflow of the ECOD automatic domain classification pipeline.
Unclassified structures enter from the top (white). Firstly, peptides, coiled-coils, and other unclassifiable regions are removed where possible and placed in their respective special architectures (orange). Secondly, unassigned regions of the input sequence are iteratively assigned by descending best hits from BLAST and HHsearch-based searches of ECOD databases. Assemblies of putative domains are optimized and assigned (green). If the chain is incomplete by sequence, a similar process occurs using DaliLite searches. If the query remains unclassified, it is manually curated (yellow).
Figure 2
Figure 2. Hierarchical levels of ECOD.
Domains placed within the same Architecture share similar secondary structure content (helix, cyan; sheet, yellow) and geometric arrangement. Domains placed within the same X-group share similar structure but lack a convincing argument for homology (vs. analogy), while those placed within the same H-groups are homologous. X- and H- group structures are colored in rainbow by consecutive secondary structure elements. T-groups distinguish homologous domains with notable differences in topology, such as the illustrated Rift-related metafold . Rift-related half-barrels (colored blue and red) are consistent among the domains, but permutations and strand swaps (green) modify the topology.
Figure 3
Figure 3. Number of ECOD H-groups containing 1 or more SCOP superfamily (blue) or CATH homologous superfamily(red).
The majority contain only a single SCOP superfamily(88%) or CATH homologous superfamily (81%). The most merged (not shown) ECOD H-group is the Immunoglobulin-related domains, which contains 47 SCOP superfamilies and 81 CATH homologous superfamiles.
Figure 4
Figure 4. Classification of ECOD and ECOD hierarchical levels with respect to the PDB and other classifications.
A) A cumulative sum of PDB release dates from Jan-2000 to Jan-2014 (red) compared to classified PDB depositions in ECOD (green), SCOP (cyan), and CATH (blue). Any deposition with at least one domain classified is counted. ECOD consistently classifies more structures than SCOP and CATH and is more up-to-date. b) The cumulative sum of PDB deposition dates in ECOD hierarchical levels. Each group is classified once by its oldest deposition. The number of new levels increases consistently over time over the 2000 to 2014 time period.
Figure 5
Figure 5. Classification methods used for non-redundant (NR) chains for weekly ECOD updates.
“Automatic” chains could be completely and confidently classified by domain pipeline and required no manual intervention. “Manual” chains were at best partly classified by software and required manual curation (i.e. some domain boundaries could not be properly detected or some domains could not be reliably classified using sequence methods). Non-domain” chains contained peptides, coiled-coils, or other cases requiring manual curation.
Figure 6
Figure 6. Distribution of H-groups in ECOD by architecture (a) and 95% representative domain population (b).
A) H-groups are colored by architecture and sized according to their representative domain population. H-groups smaller than 0.01 radians are not displayed. Those H-groups shown in bottom distributions are labeled. B) The most populated H-groups (>500 95% representative domains) are colored by architecture. The immunoglobulin-related, Rossmann-related, and helix-turn-helix (HTH) H-groups are the most populated H-groups in ECOD. The inset shows the most populated H-groups by number of F-groups.
Figure 7
Figure 7. Structure similarity distribution of domain pairs from SCOP superfamily, SCOP fold and ECOD H-group, measured by TM-score.
Data were grouped into three panels by sequence similarity in terms of HHsearch probability (Low: probability ≤20%, Medium: 20%
Figure 8
Figure 8. A) Distribution of domains per chain for ECOD(red), SCOP(green), and CATH(blue).
Both ECOD and SCOP allow for multi-chain domains (MC), but these are a small fraction of the classification. ECOD contains slightly more single-chain domains than CATH, but less than SCOP. B) ECOD slightly favors smaller domains over SCOP and longer domains over CATH.
Figure 9
Figure 9. Venn diagram of the shared homologous domain pairs among those ECOD (cyan), SCOP (green), and CATH (red) nonredundant domains with similar (80%) domain ranges.
A plurality of domain pairs are shared among all three classifications. A large fraction of domain pairs can solely be observed in ECOD. 11.4% of domain pairs are only shared between ECOD and CATH.
Figure 10
Figure 10. Growth of ECOD groups with no mapping to SCOP or CATH over time.
Growth of all groups increases as proportion of PDBs classified by SCOP or CATH decreases. Unmapped H-groups represent a significant fraction of total ECOD H-groups. Unmapped X-groups are potentially interesting cases of novelty.
Figure 11
Figure 11. Representative domains in ECOD classified by type (manual or provisional) and cluster type (Pfam, HH, or unclustered).
Manual representatives have been inspected by a curator and assignment to the hierarchy has been verified. Provisional representatives contain no close homologous link to a manual representative and cluster separately into a Pfam- or HH-based cluster. Unclustered representatives are either awaiting clustering or cannot be clustered due to some technical problem. The majority of representatives in ECOD are manual Pfam representatives (79%), followed by manual HH-clustered representatives (10%) and provisional Pfam representatives (8%).
Figure 12
Figure 12. SAM MTases and Rossmann domains.
(A) SAM MTases as represented by ribosomal protein L11 methyltransferase complexed with SAM (PDB 2nxe). (B) Rossmann domains as represented by formaldehyde dehydrogenase complexed with NAD (PDB 1kol). In (A) and (B), helices are colored in cyan, strands in yellow, and loops in white. The additional strand 7 in SAM-MTase is colored in orange. The respective cofactor, SAM or NAD, is shown in sticks. The Gly-rich loop beneath the cofactor is colored in magenta. The conserved Asp or Glu that forms hydrogen bonds with the adenosine ribose hydroxyls is shown in sticks. Diagrams are made by Pymol (The PyMOL Molecular Graphics System, Schrödinger, LLC. http://www.pymol.org/). (C) Manually modified DALI alignment between the two domains shown in (A) and (B). Starting and ending residue numbers are labeled before and after the alignment. β-strands and α-helices are labeled numerically and shown in arrows and cylinders respectively above the sequence alignment. The Gly-rich loop is highlighted in magenta, and the conserved Asp or Glu is highlighted in red.
Figure 13
Figure 13. Structures of homologous members of the FZ-CRD (A,B), glypican (C), folate receptor (D), and NPC1 (E).
Conserved disulfide bonds are shown in pink sticks with labels by their sides. Four core helices are labeled H1–H4. N- and C-termini are shown. Homology detected by distinct cysteine residue patterns was used as the basis for merging these families into a homologous group (H-group) in ECOD. F. Pairwise Dali Z- scores between pairs of the structures. G. Multiple sequence alignment of the structures shown, with conserved cysteines highlighted on black background. Cysteines forming a disulfide bond are labeled by the same sign for FZ-CRDs from Frizzled8 and MuSK (line above the sequences) and glypican, folate receptor and NPC1 (line below the sequences). Four core helices (H1–H4) are shown below the alignment in cylinder representation.
Figure 14
Figure 14. ECOD recognizes novel evolutionary relationships.
A) Duf371 (3cbn) forms an 8-stranded β-barrel from intertwined β-strands of a tandem structural duplication. The N-terminal half (blue shades) includes an overside connection between adjacent β-strands (blue) that follows a conserved His (black spheres). The symmetrically related C-terminal half (red shades) includes a similar overside connection (red) following a less conserved His (gray spheres). B) The Duf371 C-terminal repeat (salmon) is rotated about the Z-axis to superimpose (RMSD 1.3) with the N-terminal repeat (slate). C) The GutA-like PTS system IIA component (2f9h) forms a similar duplicated β-barrel. An invariant His in the C-terminal half likely represent the PTS IIA phosphorylation site. D) The PK β-barrel domain-like fold (1pkla1) displays a similar intertwined topology, but retains only a single overside connection (blue) in the N-terminal half. E) PSI-BLAST alignment of the Duf371 repeats detected with Mefer0473 sequence supports the duplication event, with sequence similarities indicated between N-terminal and C-terminal halves. A structure-based alignment of the 2F9H C-terminus is included below. Structural elements (arrow for strand and cylinder for helix) and conservations (calculated by Al2Co [59]) are indicated above/below the corresponding sequences. Conserved positions are highlighted yellow (mainly hydrophobic) and black (polar). Surface representations of F) PTSIIA in the same orientation as in panel C and G) Duf371 in the rotated orientation of panel B are colored in rainbow according to conservation, from blue (less) to red (more).

References

    1. Punta M, Coggill PC, Eberhardt RY, Mistry J, Tate J, et al. (2012) The Pfam protein families database. Nucleic Acids Res 40: D290–D301. - PMC - PubMed
    1. Marchler-Bauer A, Lu S, Anderson JB, Chitsaz F, Derbyshire MK, et al. (2011) CDD: a Conserved Domain Database for the functional annotation of proteins. Nucleic Acids Res 39: D225–229. - PMC - PubMed
    1. Holm L, Sander C (1996) Mapping the protein universe. Science 273: 595–603. - PubMed
    1. Murzin AG, Brenner SE, Hubbard T, Chothia C (1995) SCOP: a structural classification of proteins database for the investigation of sequences and structures. J Mol Biol 247: 536–540. - PubMed
    1. Orengo CA, Michie AD, Jones S, Jones DT, Swindells MB, et al. (1997) CATH–a hierarchic classification of protein domain structures. Structure 5: 1093–1108. - PubMed

Publication types