. 2014 Dec 4;10(12):e1004820.
doi: 10.1371/journal.pgen.1004820. eCollection 2014 Dec.

Chondrocytes transdifferentiate into osteoblasts in endochondral bone during development, postnatal growth and fracture healing in mice

Affiliations

Chondrocytes transdifferentiate into osteoblasts in endochondral bone during development, postnatal growth and fracture healing in mice

Xin Zhou et al. PLoS Genet. .

Abstract

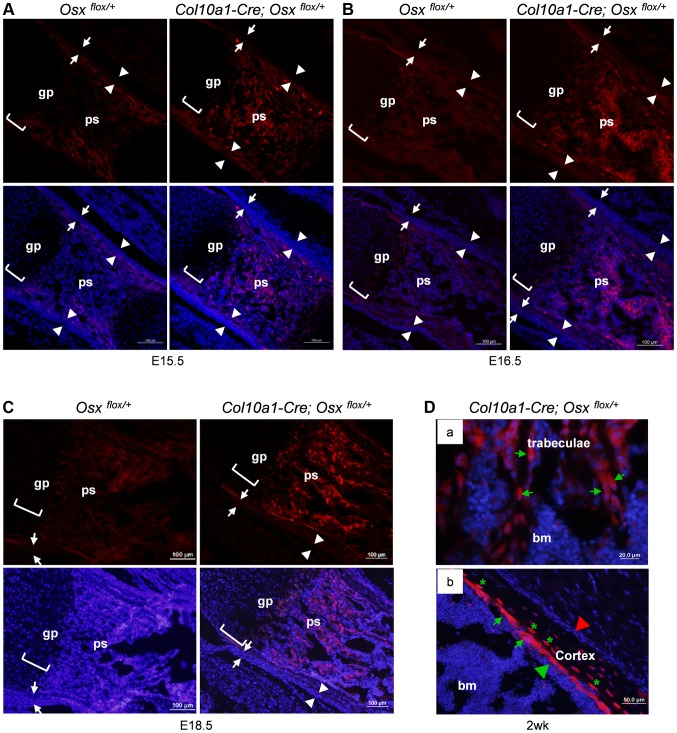
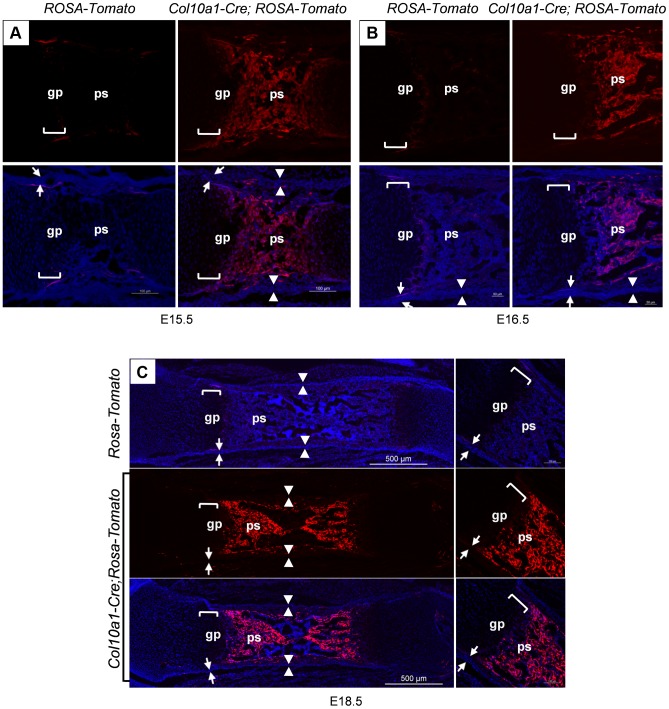
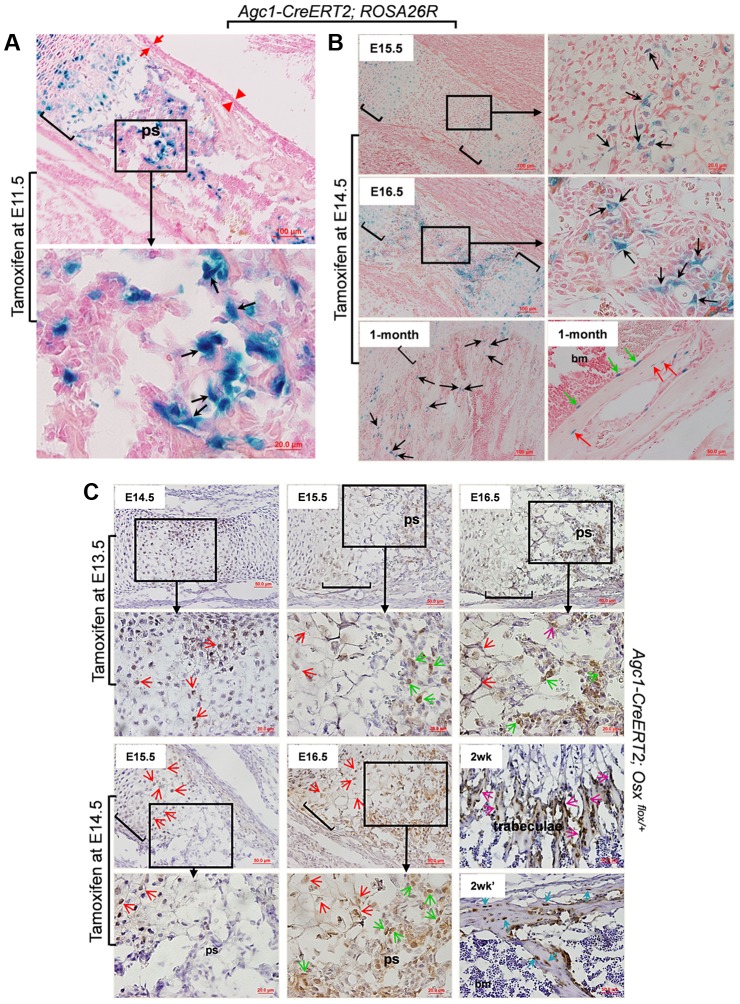
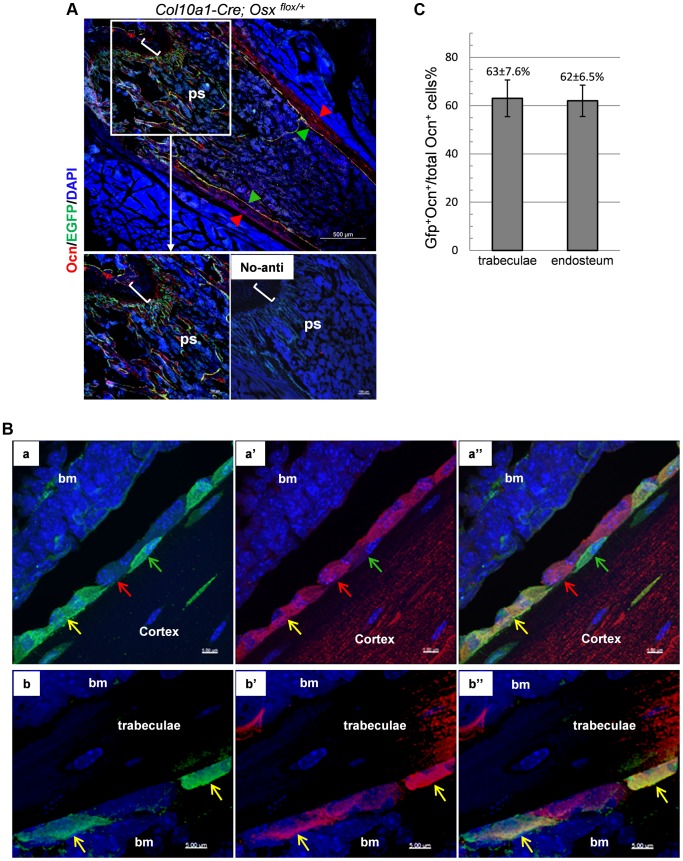
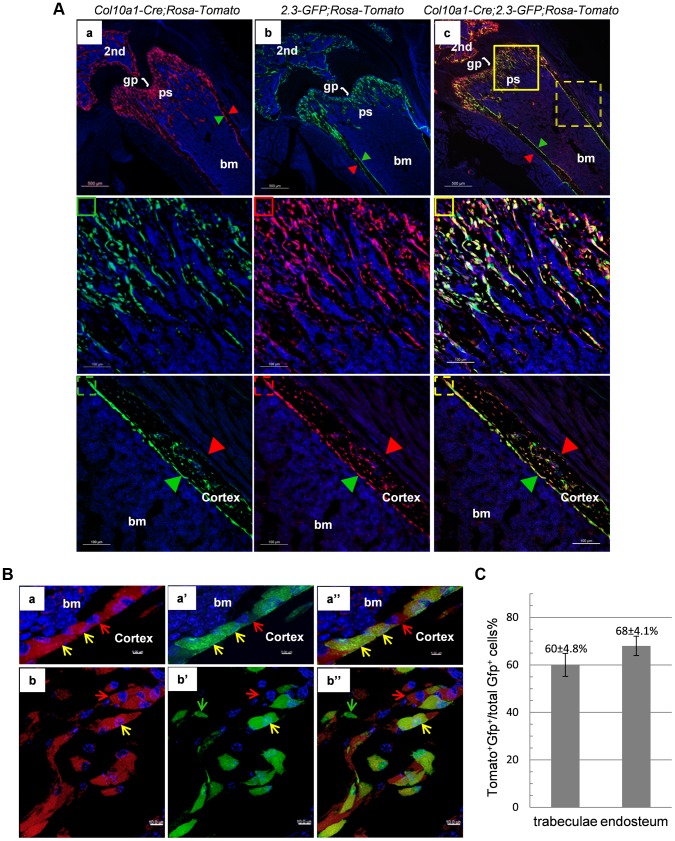
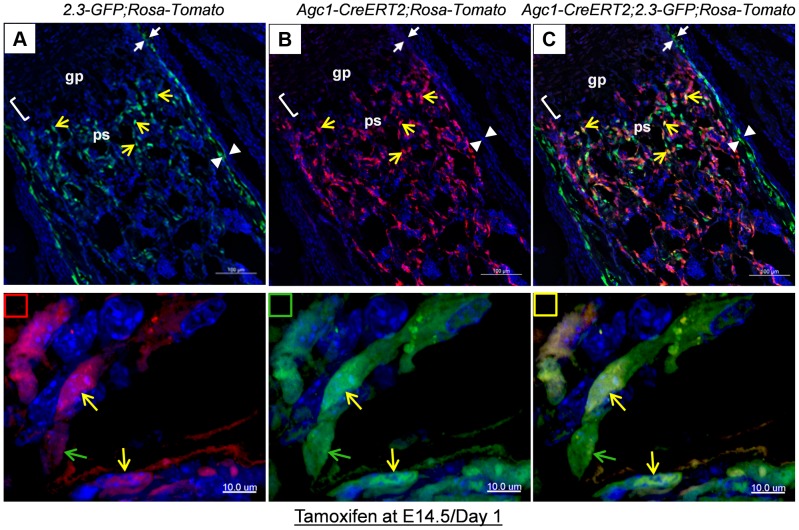
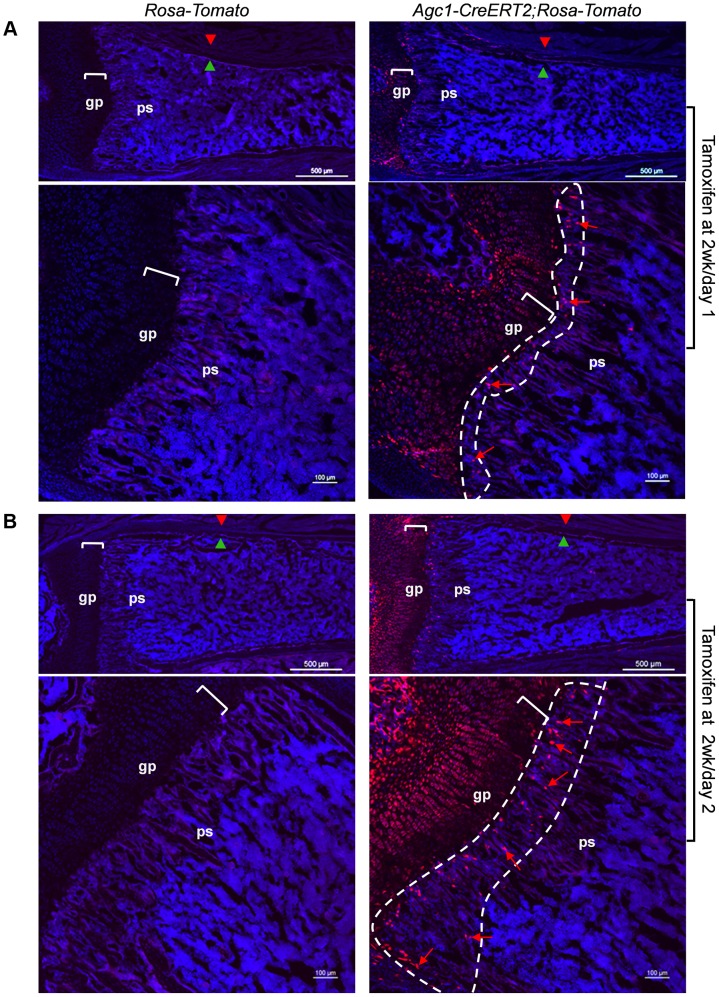
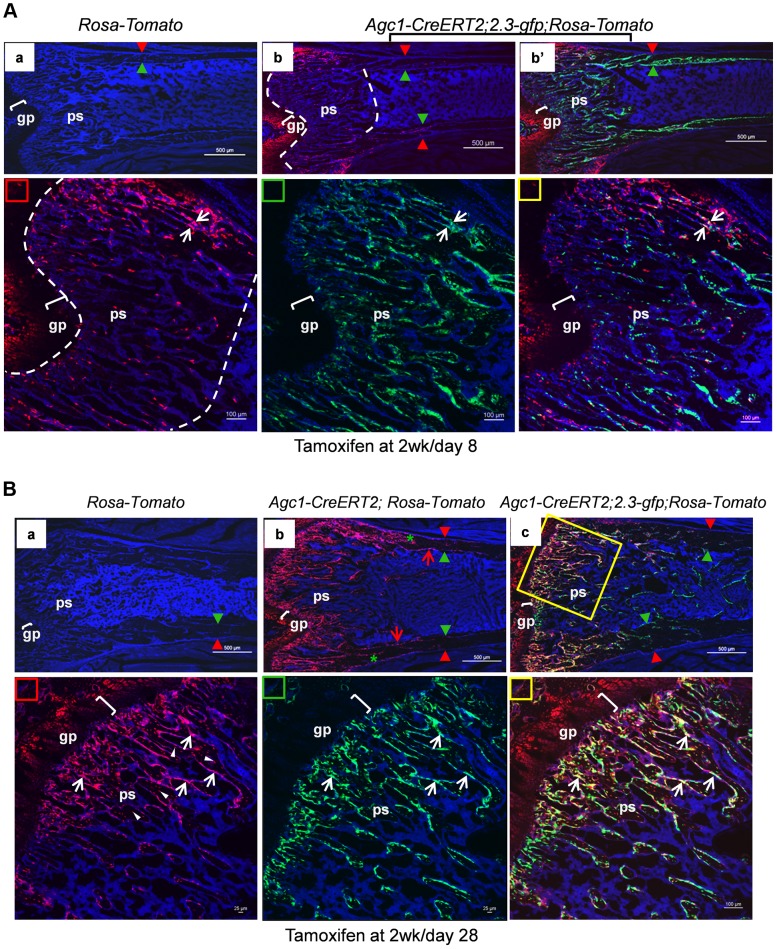
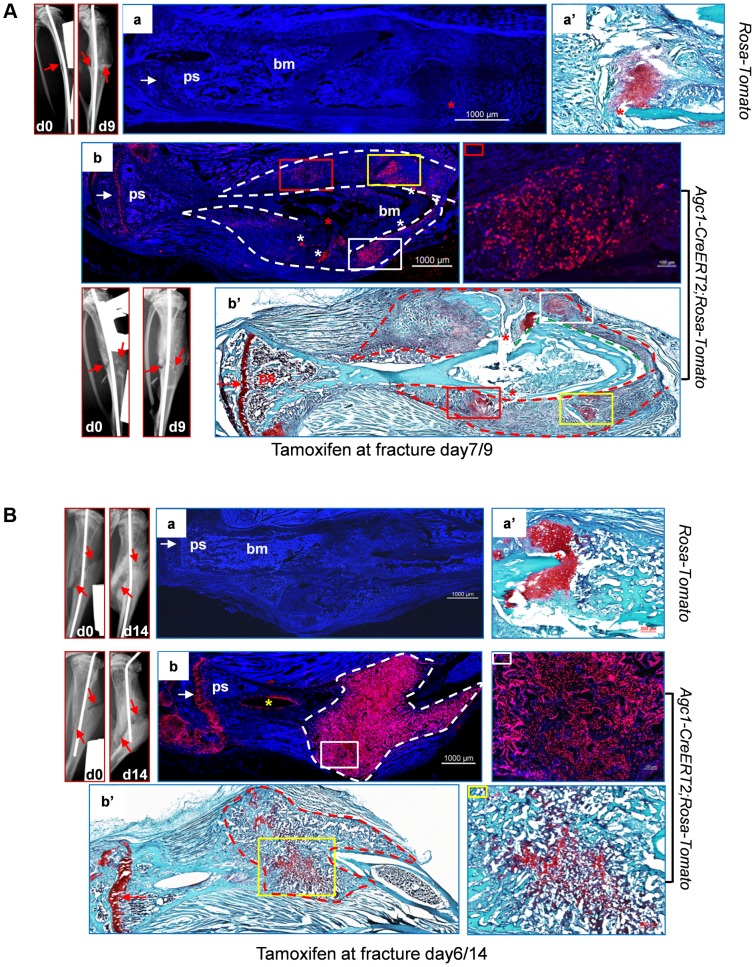
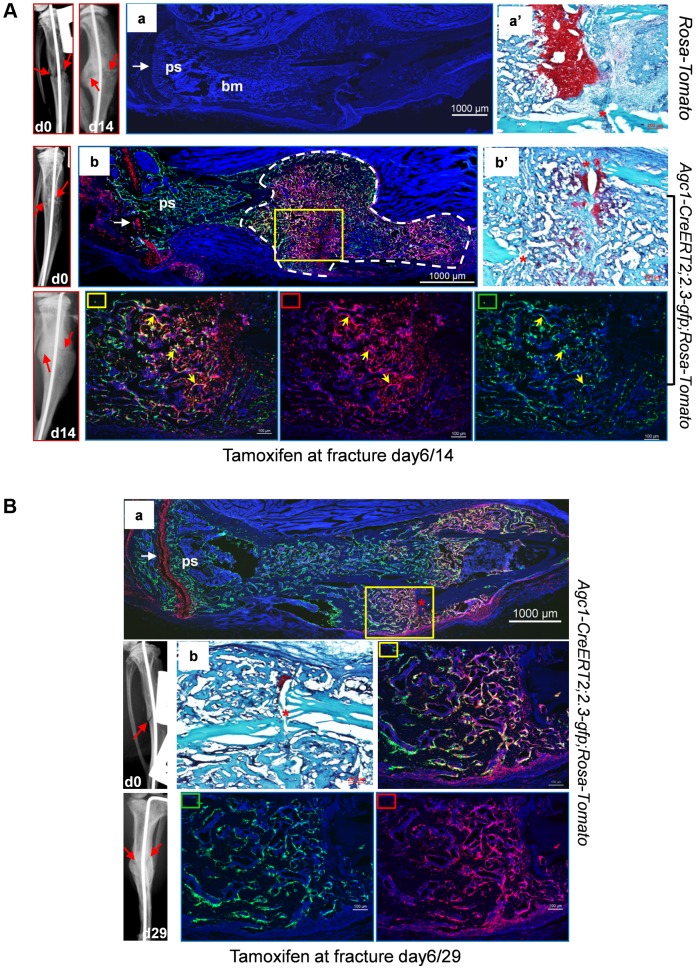
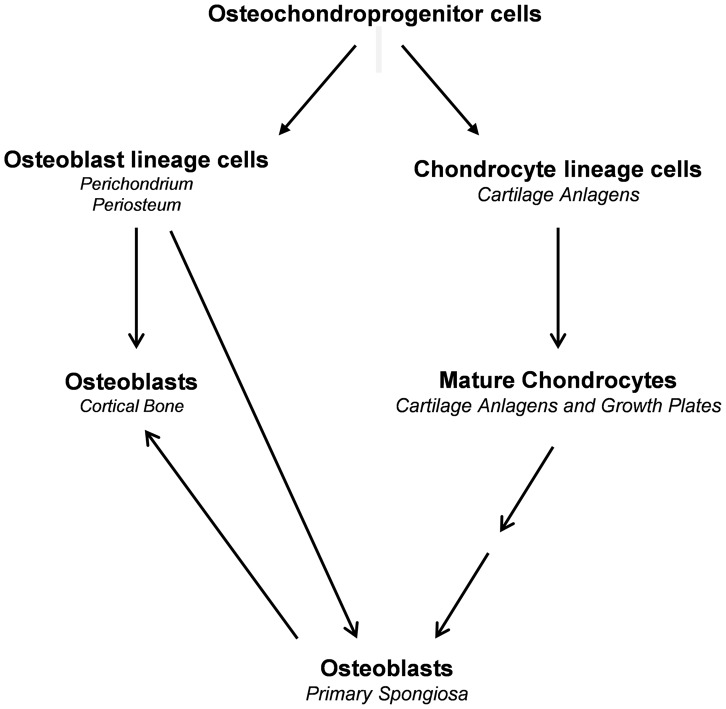
One of the crucial steps in endochondral bone formation is the replacement of a cartilage matrix produced by chondrocytes with bone trabeculae made by osteoblasts. However, the precise sources of osteoblasts responsible for trabecular bone formation have not been fully defined. To investigate whether cells derived from hypertrophic chondrocytes contribute to the osteoblast pool in trabecular bones, we genetically labeled either hypertrophic chondrocytes by Col10a1-Cre or chondrocytes by tamoxifen-induced Agc1-CreERT2 using EGFP, LacZ or Tomato expression. Both Cre drivers were specifically active in chondrocytic cells and not in perichondrium, in periosteum or in any of the osteoblast lineage cells. These in vivo experiments allowed us to follow the fate of cells labeled in Col10a1-Cre or Agc1-CreERT2 -expressing chondrocytes. After the labeling of chondrocytes, both during prenatal development and after birth, abundant labeled non-chondrocytic cells were present in the primary spongiosa. These cells were distributed throughout trabeculae surfaces and later were present in the endosteum, and embedded within the bone matrix. Co-expression studies using osteoblast markers indicated that a proportion of the non-chondrocytic cells derived from chondrocytes labeled by Col10a1-Cre or by Agc1-CreERT2 were functional osteoblasts. Hence, our results show that both chondrocytes prior to initial ossification and growth plate chondrocytes before or after birth have the capacity to undergo transdifferentiation to become osteoblasts. The osteoblasts derived from Col10a1-expressing hypertrophic chondrocytes represent about sixty percent of all mature osteoblasts in endochondral bones of one month old mice. A similar process of chondrocyte to osteoblast transdifferentiation was involved during bone fracture healing in adult mice. Thus, in addition to cells in the periosteum chondrocytes represent a major source of osteoblasts contributing to endochondral bone formation in vivo.


Conflict of interest statement

The authors have declared that no competing interests exist.

Figures

Figure 1
Figure 1. Presence of abundant EGFP+ (Osx−/+) cells throughout the primary spongiosa of Col10a1-Cre; Osxflox/+ embryos and mice.
Anti-EGFP immunofluorescence (IF) showed that EGFP+ (Osx−/+) cells (red) were found in the primary spongiosa of E15.5 (A), E16.5 (B) and E18.5 (C) Col10a1-Cre; Osx flox/+ femurs (right panels), but not in the Osx flox/+ control embryos (left panels). The controls showed auto-fluorescence produced by mineralized tissue and bone marrow cells, but no EGFP+ cells. Upper panels: anti-EGFP (red); Lower panels: anti-EGFP and DAPI (blue). There were virtually no EGFP+ cells in the perichondrium (between white arrows) or periosteum (between white arrowheads) of the Col10a1-Cre; Osx flox/+ embryos. D: In the femurs of 2-week-old Col10a1-Cre; Osxflox/+ mice, EGFP+ (Osx−/+) cells (green arrows) were found throughout the trabeculae (panel a), on the endosteum surface (panel b), and embedded within the cortex (green asterisks). Red arrowhead: periosteum; Green arrowhead: endosteum; gp: growth plate (white brackets); ps: primary spongiosa; bm: bone marrow. In the Osx flox/+ control embryos, weak EGFP+ cells were present in the perichondrium and periosteum area (also in Fig. 3C), indicating that there was a low level read through of EGFP independent of Cre-mediated excision of floxed Osx allele.
Figure 2
Figure 2. Presence of abundant Tomato+ cells throughout the primary spongiosa of Col10a1-Cre; ROSA-tdTomato embryos.
Col10a1-Cre;ROSA-tdTomato embryos were generated to verify the observations made in the Col10a1-Cre;Osx flox/+ embryos. Abundant Tomato+ non-chondrocytic cells (red) were present throughout the primary spongiosa in femurs of E15.5 (A), E16.5 (B) and E18.5 (C) Col10a1-Cre;ROSA-tdTomato embryos (right panels). Tomato+ non-chondrocytic cells were completely absent from the ROSA-tdTomato control embryos in all stages evaluated (left panels in A and B, upper panel in C). Upper panels in A and B and middle panel in C: red channel; Lower panels: red and blue channels. Right panels in C: magnified images. There were virtually no Tomato+ cells within the perichondrium (between white arrows) or periosteum (between white arrowheads) of the Col10a1-Cre; ROSA-tdTomato embryos. gp: growth plate (white brackets); ps: primary spongiosa; bm: bone marrow.
Figure 3
Figure 3. The non-chondrocytic reporter+ cells in the primary spongiosa of tamoxifen-treated Agc1-CreERT2 embryos and mice are derived from mature chondrocytes.
A: The LacZ stained femur section of E16.5 Agc1-CreERT2; ROSA26R embryo treated with tamoxifen at E11.5. The black arrows indicate the non-chondrocytic LacZ+ cells in the primary spongiosa. Black brackets: hypertrophic zone. No LacZ+ cells were detected within the perichondrium (red arrows) and periosteum (red arrowheads). B: LacZ staining of Agc1-CreERT2; ROSA26R femurs treated with tamoxifen at E14.5 and euthanized 1 and 2 days after injections or at 1 month postnatally. At E15.5, LacZ+ non-chondrocytic cells (black arrows) were only present right beneath the growth plates, while at E16.5, the number of LacZ+ non-chondrocytic cells was increased. At 1 month, LacZ+ cells were still present on the trabecular surfaces (black arrows), endosteum (green arrows) and within bone matrix (red arrows). Black brackets: hypertrophic zone. C: Anti-EGFP Immunohistochemical analysis (IHC) of Agc1-CreERT2; Osx flox/+ mice treated with tamoxifen at E13.5 or E14.5 and euthanized 1, 2 and 3 days after injections or 2 weeks postnatally. The data show that there were abundant non-chondrocyte EGFP+ (Osx−/+) cells in the primary spongiosa of the femur of E15.5 Agc1-CreERT2; Osx flox/+ embryos treated with tamoxifen at E13.5. However, there were almost no non-chondrocyte EGFP+ cells in the primary spongiosa of E15.5 Agc1-CreERT2; Osx flox/+ embryos treated with tamoxifen at E14.5. Red arrows: EGFP+ (Osx−/+) hypertrophic chondrocytes. Green arrows: preosteoblast-like EGFP+ (Osx−/+) cells. Purple arrows: mature osteoblast-like EGFP+ (Osx−/+) cells. Blue arrows: EGFP+ (Osx−/+) osteocytes. Black brackets: hypertrophic zone; ps: primary spongiosa.
Figure 4
Figure 4. A double Immunofluorescence experiment revealed that the EGFP+ (Osx−/+) cells in the primary spongiosa and endosteum of Col10a1-Cre; Osxflox/+ mice are mature osteoblasts.
A, B and C: DIF experiment with anti-Ocn and anti-GFP using femur frozen sections of 1-month-old Col10a1-Cre; Osxflox/+ mice. A: Lower right panel: no primary antibodies control. Upper and lower left panels: DIF experiment with anti-Ocn and anti-GFP. Anti-Ocn (red), anti-GFP (green) and DAPI (blue). White brackets indicate growth plate. ps: primary spongiosa. Red arrowhead: periosteum; Green arrowhead: endosteum. B: Magnified cell images of part of the upper panel in A. Panels a, a′ and a″: magnified cortical region. a: blue and green channels; a′: blue and red channels; a″: blue, green and red channels. Panels b, b′ and b″: magnified trabecular region. b: blue and green channels; b′: blue and red channels; b″: blue, green and red channels. Red arrows indicate Ocn+EGFP cells. Green arrows indicate EGFP+Ocn cells. Yellow arrows indicate Ocn+EGFP+ cells. Bm: bone marrow. Blue channel: 405 nm; Green channel: 488 nm; Red channel: 555 nm. C: Percent of Ocn+ mature osteoblasts which were derived from Col10a1-expressing mature chondrocytes in trabeculae and endosteum regions.
Figure 5
Figure 5. Cellular colocalization of the chondrocyte-derived tomato marker and a 2.3Col1-GFP osteoblast specific marker in femur sections of Col10a1-Cre;2.3Col1-GFP;ROSA-tdTomato triple transgenic mice.
A: The femur fluorescence images of 3-week-old Col10a1-Cre;2.3Col1-GFP;ROSA-tdTomato mouse and Col10a1-Cre; ROSA-tdTomato and 2.3Col1-GFP;ROSA-tdTomato control mice. Panel a: only Tomato+ cells (red) no EGFP+ (green) cells were present in Col10a1-Cre; ROSA-tdTomato control mice. Panel b: only EGFP+ cells no Tomato+ cells were present in 2.3Col1-GFP; ROSA-tdTomato control mice. Panel c: Tomato+, EGFP+ and Tomato+EGFP+ cells were distributed in the trabecular region, on the endosteum and in the secondary ossification center. The solid square in panel c indicates the enlarged trabeculae region; The dashed square in panel c indicates the enlarged cortical region; The green squares: blue and green channels; The red squares: blue and red channels; The yellow squares: blue, green and red channels; Red arrowhead: periosteum; Green arrowhead: endosteum. 2nd: secondary ossification center. B: Magnified images of cells in A-c. Panels a, a′ and a″: magnified cortical region. a: blue and red channels; a′: blue and green channels; a″: blue, red and green channels. Panels b, b′ and b″: magnified trabecular region. b: blue and red channels; b′: blue and green channels; b″: blue, red and green channels. Red arrows indicate Tomato+EGFP cells. Green arrows indicate TomatoGFP+ cells. Yellow arrows indicate Tomato+EGFP+ cells. Bm: bone marrow. C: The percent quantitation of EGFP+ cells which were derived from Col10a1-expressing mature chondrocytes in trabecular and cortical regions respectively.
Figure 6
Figure 6. Cellular colocalization of the chondrocyte-derived tomato marker and the osteoblast-specific 2.3Col1-GFP marker in femurs of tamoxifen treated Agc1-CreERT2;2.3Col1-GFP;ROSA-tdTomato triple transgenic mice.
The femur fluorescence images of postnatal day 1 Agc1-CreERT2;2.3Col1-GFP;ROSA-tdTomato mouse treated with tamoxifen at E14.5. Panel a: blue and green channels; Panel b: blue and red channels; Panel c: blue, red and green channels; The lower panels indicated by small squares represent magnified images of cells from top panels. Red square: red and blue channels; Green square: green and blue channels; Yellow square: red, green and blue channels; The green arrows indicate the TomatoEGFP+ cells. The yellow arrows indicate the Tomato+EGFP+ cells. Only EGFP+ cells no Tomato+ cells were present in the perichondrium (between white arrows) and periosteum (between white arrow heads).
Figure 7
Figure 7. Presence in the primary spongiosa of non-chondrocytic cells derived from postnatal growth plate mature chondrocytes.
Agc1-CreERT2; ROSA-tdTomato and control mice were treated with tamoxifen at 2 weeks postnatally and were sacrificed at day 1 (A) and day 2 (B) post injection. All images in this figure are images of femur sections. Left panels (A and B): Tomato+ cells were completely absent in ROSA-Tomato control mice. Right panels (A and B): Tomato+ non-chondrocytic cells (red arrows) were present in the primary spongiosa under the growth plate. More Tomato+ non-chondrocytic cells were seen in the primary spongiosa in the post injection day 2 mouse, and these Tomato+ non-chondrocytic cells of the post injection day 2 mouse were distributed in a wider area than in the day 1 mouse. The white dotted lines outlines the area within which non-chondrocytic Tomato+ cells were present. Red arrowhead: periosteum; Green arrowhead: endosteum; gp: growth plate (white brackets); ps: primary spongiosa.
Figure 8
Figure 8. Growth plate mature chondrocytes contribute to the osteoblast pool during postnatal growth.
Two-week-old Agc1-CreERT2; ROSA-tdTomato, Agc1-CreERT2; 2.3-GFP;ROSA-tdTomato and control mice were treated with tamoxifen and sacrificed 8 days (A) and 28 days post injection (B). All images in this figure are images of femur sections. A: Panel a: neither Tomato nor EGFP signals were detected in the ROSA-tdTomato control. Panel b (blue and red channels): the fluorescence image revealed that there were more Tomato+ cells in the primary spongiosa in the post injection day 8 Agc1-CreERT2; 2.3-GFP;ROSA-tdTomato mouse compared to the post injection day 2 mouse (Fig. 7B right panels), and the Tomato+ cells in the day 8 mouse were distributed in an even broader area than in the day 2 mouse. Very few Tomato+ cells were found on the endosteum and within the cortex. Panel b′: blue, red and green channels. Lower panels: magnified images of primary spongiosa in b′. Lower left (red rectangle): red and blue channels; Lower middle (green rectangle): green and blue channels; Lower right (yellow rectangle): red, green and blue channels: a few Tomato+EGFP+ cells (white arrows) were present in the primary spongiosa especially in proximity of the periosteum. B: Panel a: no Tomato or GFP signals were detected in the post tamoxifen day 28 ROSA-tdTomato control. Panel b: in the post tamoxifen day 28 Agc1-CreERT2; ROSA-tdTomato mouse, not only was the number of Tomato+ cells in the primary spongiosa increased compared to the post injection day 8 mouse, but some of these Tomato+ cells were on the endosteum (red arrows) and embedded within the cortex (green asterisk). Panel c: there were many more Tomato+EGFP+ cells (white arrows in magnified lower right panel) in the day 28 Agc1-CreERT2; ROSA-tdTomato mouse than in the day 8 mouse (Fig. 8A). Lower left panel: magnified trabecular area of panel c (red and blue channels) showed that there were many Tomato+ cells on the trabecular surfaces (white arrows) and embedded within the trabeculae (white arrowheads). Red arrowhead: periosteum; Green arrowhead: endosteum; gp: growth plate (white brackets); ps: primary spongiosa.
Figure 9
Figure 9. Abundant Agc1-CreERT2 labeled Tomato+ cells were present in the repair callus during fracture healing.
A: The left tibia of 2.5-month-old Agc1-CreERT2; ROSA-tdTomato mouse and ROSA-tdTomato control mouse were subjected to semi-stabilized fracture surgery. At 7 days after surgery, these mice were treated with tamoxifen and were sacrificed 2 days post tamoxifen. The panels left to panel a: X-ray images of fractured tibiae of ROSA-tdTomato control mouse. day0: right after surgery; day9: 9 days after surgery. Red arrows indicate the fractures. Panel a: the fluorescence image of fractured tibiae of ROSA-tdTomato mouse. Panel a′: Saf-O staining indicates the presence of chondrocytes (red staining) in the repair callus of ROSA-tdTomato fractured tibiae. Panel b: fluorescence image of the fractured tibiae of Agc1-CreERT2; ROSA-tdTomato mouse, Tomato+ cells were present specifically in the growth plate (white arrow) and in the repair callus outlined by the dotted lines. The colored rectangles indicate the locations of Tomato+ cells in the callus. The panel right to panel b: magnified fluorescence image of the area marked by a red rectangle in b. White asterisks indicate non-specific fluorescence signals. The white arrow indicates the growth plates. Panel b′: Saf-O staining of the fractured tibiae. The red dotted lines outline the repair callus. The colored rectangles mark the areas of red staining. The matching areas in b and b′ are marked by the same colored rectangles. Red asterisks: fracture sites. The red arrow indicates the growth plate. B: The left tibia of 2-month-old Agc1-CreERT2; ROSA-tdTomato mouse and ROSA-tdTomato control mouse were subjected to semi-stabilized fracture surgery. At 6 days after surgery, these mice were treated with tamoxifen and were sacrificed 8 days post tamoxifen. Panel a: fluorescence image of fractured tibiae of ROSA-tdTomato mouse. Panel a′: Saf-O staining of repair callus in fractured tibiae in panel a. The panels left to panel a: X-ray images of fractured tibiae of ROSA-tdTomato. Panel b: fluorescence image of fractured tibiae of Agc1-CreERT2; ROSA-tdTomato mouse. Almost all cells in the callus outlined by the white dotted lines were Tomato+ cells. The panel right to panel b: magnified fluorescence image of the area marked by the white rectangle. The white arrow indicates the growth plates. Panel b′: Saf-O staining of the fractured tibiae. The red stippled line outlines the repair callus. The image right to b′: the Saf-O staining of area marked by a yellow rectangle in b′. The red arrow indicates the growth plate.
Figure 10
Figure 10. Osteoblasts derived from mature chondrocytes in the repair callus are involved in bone fracture healing.
A: Left tibia of a 2.5-month-old Agc1-CreERT2; 2.3-GFP;ROSA-tdTomato mouse and a ROSA-tdTomato control mouse were subjected to semi-stabilized fracture surgery. At 6 days after surgery, these mice were treated with tamoxifen and were scarified 8 days post tamoxifen. Panel a: fluorescence image shows no Tomato and GFP signals in the fractured tibiae of ROSA-tdTomato control. Panel a′: Saf-O staining of the repair callus in a. Images left to a: X-ray images of fractured tibia of control mouse. Panel b: in the fractured tibiae of Agc1-CreERT2; 2.3-GFP;ROSA-tdTomato mouse, Tomato+ cells are present specifically in growth plate (white arrow) and in the repair callus outlined by dotted white lines. Some of the Tomato+ cells were also positive for GFP (Tomato+EGFP+ indicated by yellow arrows). The white arrow indicates the growth plate, which was partly broken by the pin inserted into the fractured tibia. Panel b′: Saf-O staining of the callus in b. B: The left tibia of 2.5-month-old Agc1-CreERT2; 2.3-GFP;ROSA-tdTomato mouse was subjected to semi-stabilized fracture surgeries. At 6 days after surgery, the mouse was treated with tamoxifen and scarified 23 days post tamoxifen. Panel a: the fluorescence image revealed that there were more Tomato+EGFP+ cells in the callus compared to the callus collected 14 days after surgery (Fig. 10A). Rectangle marked panels: magnified images corresponding to the yellow rectangle in panel a. Middle right panel: blue, red and green channels; Bottom middle panel: blue and green channels; Bottom right panel: blue and red channels. Panel b: Saf-O staining shows very little red tissue, suggesting that the callus was almost all ossified.
Figure 11
Figure 11. Proposed model illustrating the sources of osteoblasts in endochondral bone.

References

    1. Akiyama H, de Crombrugghe B (2009) Transcription control of chondrocyte differentiation. The skeletal system: Cold spring harbor laboratory press. pp. 147–170.
    1. Mackie EJ, Ahmed YA, Tatarczuch L, Chen KS, Mirams M (2008) Endochondral ossification: how cartilage is converted into bone in the developing skeleton. Int J Biochem Cell Biol 40: 46–62. - PubMed
    1. Maes C, Kobayashi T, Selig MK, Torrekens S, Roth SI, et al. Osteoblast precursors, but not mature osteoblasts, move into developing and fractured bones along with invading blood vessels. Dev Cell 19: 329–344. - PMC - PubMed
    1. Clarkin C, Olsen BR On bone-forming cells and blood vessels in bone development. Cell Metab 12: 314–316. - PMC - PubMed
    1. Gerstenfeld LC, Shapiro FD (1996) Expression of bone-specific genes by hypertrophic chondrocytes: implication of the complex functions of the hypertrophic chondrocyte during endochondral bone development. J Cell Biochem 62: 1–9. - PubMed

Publication types