. 2014 Dec 5:4:7341.
doi: 10.1038/srep07341.

In vivo flow mapping in complex vessel networks by single image correlation

Affiliations

In vivo flow mapping in complex vessel networks by single image correlation

Laura Sironi et al. Sci Rep. .

Abstract

We describe a novel method (FLICS, FLow Image Correlation Spectroscopy) to extract flow speeds in complex vessel networks from a single raster-scanned optical xy-image, acquired in vivo by confocal or two-photon excitation microscopy. Fluorescent flowing objects produce diagonal lines in the raster-scanned image superimposed to static morphological details. The flow velocity is obtained by computing the Cross Correlation Function (CCF) of the intensity fluctuations detected in pairs of columns of the image. The analytical expression of the CCF has been derived by applying scanning fluorescence correlation concepts to drifting optically resolved objects and the theoretical framework has been validated in systems of increasing complexity. The power of the technique is revealed by its application to the intricate murine hepatic microcirculatory system where blood flow speed has been mapped simultaneously in several capillaries from a single xy-image and followed in time at high spatial and temporal resolution.


Figures

Figure 1
Figure 1. Cross-correlation on raster-scanned xy-images.
(a)–(e) Confocal xy-images acquired by detecting the signal of 1-μm fluorescent beads undergoing laminar flow in a square borosilicate capillary (inner section, 720 μm); λexc = 514 nm, detection bandwidth = 530–600 nm, fline = 1000 Hz, δx = 0.04 μm; scale bar, 3 μm. The angle γ between the flow velocity vector v and the scan path (pointing as the positive x-axis) was varied in the four quadrants of the Cartesian xy-plane. In (a), (b) and (c) v (in green) points in the positive x-direction: the diagonal lines due to the beads motion keep the same orientation irrespectively of the angle γ, which affects their length and slope. In (d) and (e) v points in the negative x-direction (i.e., opposite to the scan path) and the orientation of the diagonal lines is reversed. In each image γ is reported according to the definition of panel (h). (f) A raster-scanned image (or a region of interest) is a matrix of NxxNy pixels, representing a series of intensity measurements from many adjacent confocal excitation volumes (sampled along the red pattern). The sketch highlights (dark green) two arbitrary pixels involved in the computation of the forth cross-correlation between two columns (light green) l = J-I pixels apart. (g) Exemplary CCF computed on panel (a) for (J–I)δx = 7.4 μm. (h) Definition of the angle γ between the vector v and the scan axis (positive x-axis); the range of its possible values and four arbitrarily-directed vectors for the flow velocity are shown.
Figure 2
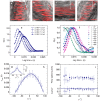
Figure 2. Validation measurements in Zebrafish embryos (3 days post fertilization d.p.f.).
(a)–(d) Confocal xy-images acquired by detecting the fluorescence signal (shown in red) of DsRed-expressing RBCs (λexc = 561 nm, detection bandwidth = 575–650 nm), overlaid to (non-confocal) transmitted-light images. fline = 1000 Hz, δx = 0.04 μm, scale bar, 10 μm; γ = 90°, 50°, 0°, −50° in (a), (b), (c) and (d), respectively. γ and v are sketched in the reference Cartesian xy-plane. (e) Exemplifying experimental CCFs for increasing column distance, showing the expected decrease of the peak time for lower (J-I)δx values. (f) Normalized CCFs for γ ∈ [0°, 90°] and (J-I)δx = 6.6 μm, fitted to equation (3); errors are within the size of data points. (g), (h) Experimental CCF peak amplitude (in g) and peak time (in h) for γ ∈ [−90°, 90°] (mean ± standard deviation (s.d.), from n = 7 xy-images), fitted to equation (S.44) and equation (4) (derived in the approximation D = 0 in Supplementary Note 2). Best-fit parameters a = 6.3 ± 0.2 μm in (f) and |v| = 424 ± 11 μm/s in (g). (i) Flow speed |v| recovered from the CCFs fit (open circles, mean ± s.d., n = 4) and |v|0 recovered directly from the CCFs peak time (filled squares, weighted average ± s.d., n = 7). In the lower panel, |v|/|v|0 is shown for γ ∈ [−80°, 80°]. For γ = ± 90°, |v|0 has not been recovered since the CCF turns into a decay (see panel f).
Figure 3
Figure 3. Measurement in time of the blood flow speed in the hepatic microcirculation.
(a) xy-image acquired by detecting the photoluminescence (shown in white) of 5-nm QDs (λexc = 900 nm, detection bandwidth = 640–690 nm); fline = 850 Hz, δx = 0.051 μm, scale bar, 10 μm. CCFs have been derived on the evidenced ROIs (ROI 1: 240 × 210 pixels; ROI 2: 450 × 120 pixels; ROI 3: 145 × 250 pixels) for (J-I)δx = 0.5–2 μm and fitted (equation (3)), leading to |v| = 235 ± 4 μm/s, 235 ± 3 μm/s and 229 ± 8 μm/s for ROIs 1, 2 and 3, respectively. A color coding is assigned for the speed |v|, while the arrows indicate the flow direction. γ, fixed to 50°, −4° and 80° in ROIs 1, 2 and 3, is sketched in the reference xy-plane. (b), (c) The xy-image in (a) is one out of ten frames of an xyt-stack (Δt = ti + 1ti = 0.88 s is the interval between the sampling of the same pixel in two consecutive frames i and i + 1). The first five frames, each identified by its sampling time ti = iΔt, are shown for ROIs 1 (b) and 2 (c). The same color code of panel (a) is adopted for the centreline. Scale bar, 5 μm; same calibration bar (in arbitrary units) in (b) and (c). (d), (e) Estimates for |v| (triangles) and |v|0 (squares) versus time in ROIs 1 (d) and 2 (e). The average ratio |v|/|v|0 is 0.92 and 0.95 in ROIs 1 and 2, respectively.
Figure 4
Figure 4. Measurement of the blood flow speed in the hepatic microcirculation on a wide field of view.
(a) xy-image acquired by detecting the photoluminescence (shown in white) of 5-nm QDs (λexc = 900 nm, detection bandwidth = 640–690 nm); the lower right corner corresponds to the same region analysed in Figure 3. fline = 627 Hz, δx = 0.102 μm, scale bar, 15 μm. CCFs have been derived on the selected ROIs (~ 100 × 50–200 × 100 pixels) for (J-I)δx = 0.51–2.55 μm; the estimated |v| and |v|0, recovered by the fit (equation (3)) and from the peak time (equation (4)) of the experimental CCFs, are reported in Table 1. (b) Schematic of the vessel centrelines for the image in (a). In each ROI, the arrow defines the flow direction and the color codes for the speed value |v|. Vessels not analysed are shown in grey. (c) CCFs computed for (J-I)δx = 2.04 μm in ROIs 5, 6 and 11 (errors are within the size of data points). The fit (equation (3)) led to |v| = 499 ± 18 μm/s in ROI 5, |v| = 187 ± 2 μm/s in ROI 6 and |v| = 396 ± 3 μm/s in ROI 11; as expected, the CCF peak shifts toward shorter lag times as the flow speed increases.

References

    1. Tuma R. F., Duran W. N. & Ley K. Microcirculation. Handbook of Physiology. Second Edition, Elsevier Science. (2008).
    1. Carmeliet P. et al. Angiogenesis in health and disease. Nat. Med. 9, 653–660 (2003). - PubMed
    1. Jain R. K. et al. Molecular regulation of vessel maturation. Nat. Med. 9, 685–693 (2003). - PubMed
    1. Adams R. H. & Alitalo K. Molecular regulation of angiogenesis and lymphangiogenesis. Nat. Rev. Mol. Cell. Biol. 8, 464–478 (2007). - PubMed
    1. Briers J. D. Laser Doppler, speckle and related techniques for blood perfusion mapping and imaging. Physiol. Meas. 22, R35–R66 (2001). - PubMed

Publication types

LinkOut - more resources