. 2015 May;64(5):1743-59.
doi: 10.2337/db14-0719. Epub 2014 Dec 4.

Semaphorin3a promotes advanced diabetic nephropathy

Affiliations

Semaphorin3a promotes advanced diabetic nephropathy

Pardeep K Aggarwal et al. Diabetes. 2015 May.

Abstract

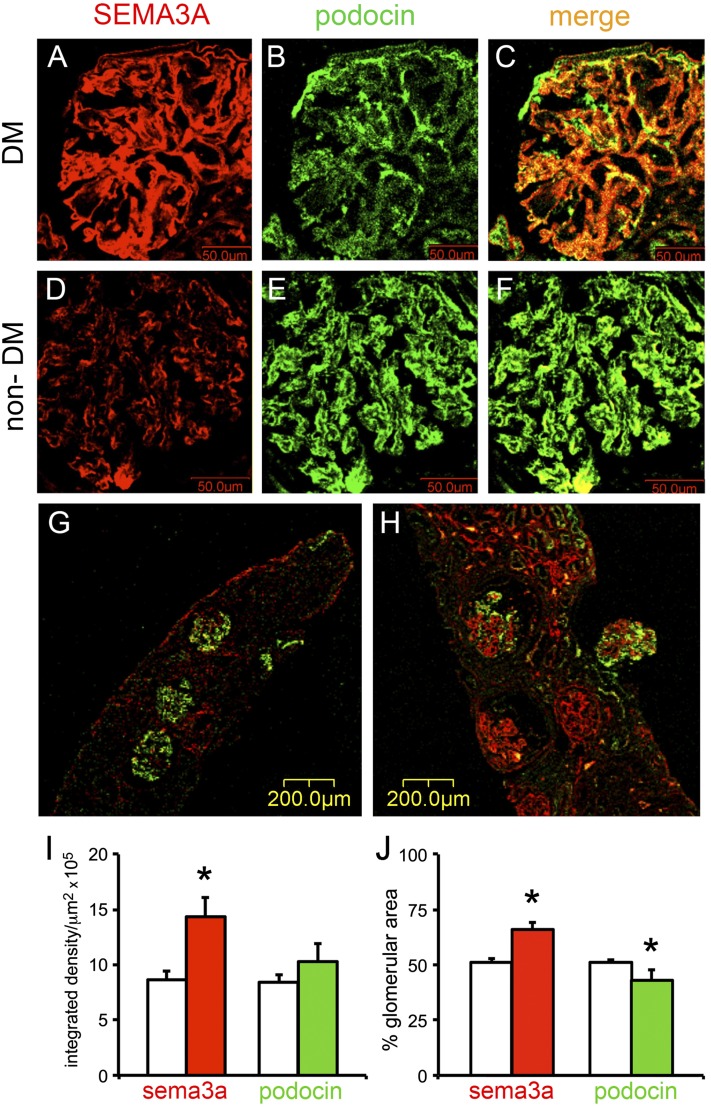
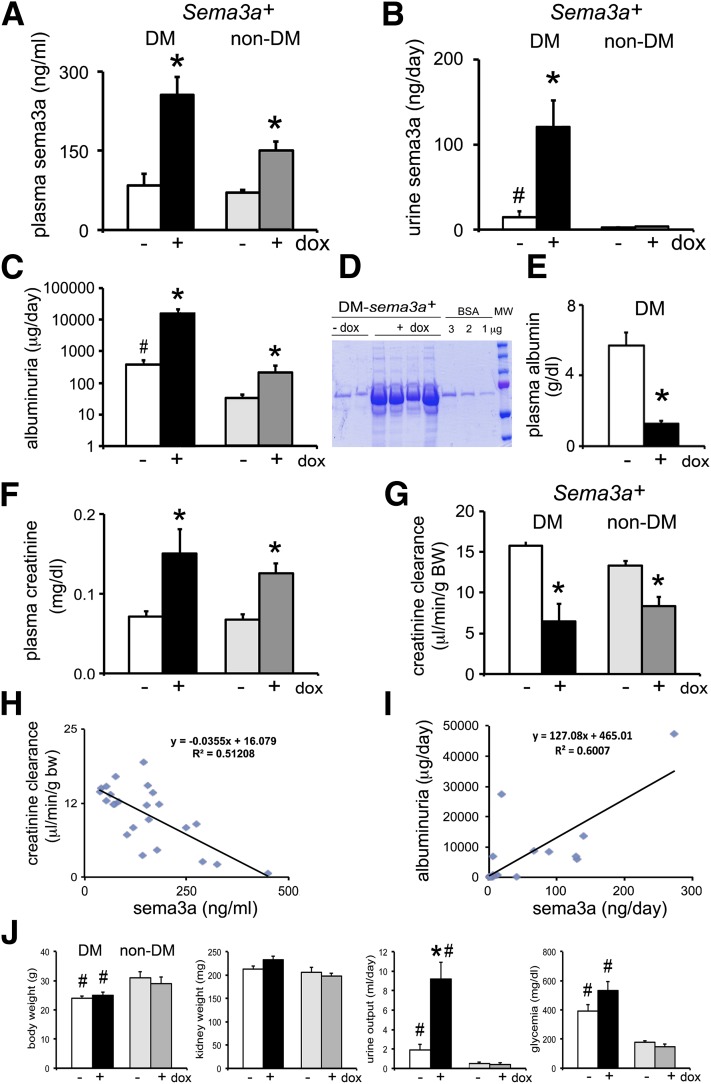
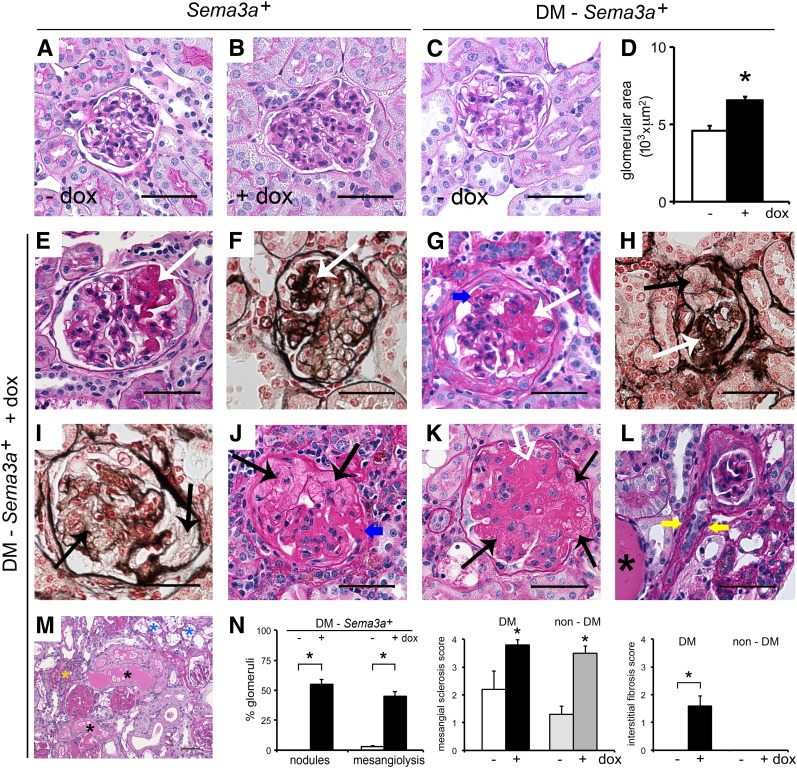
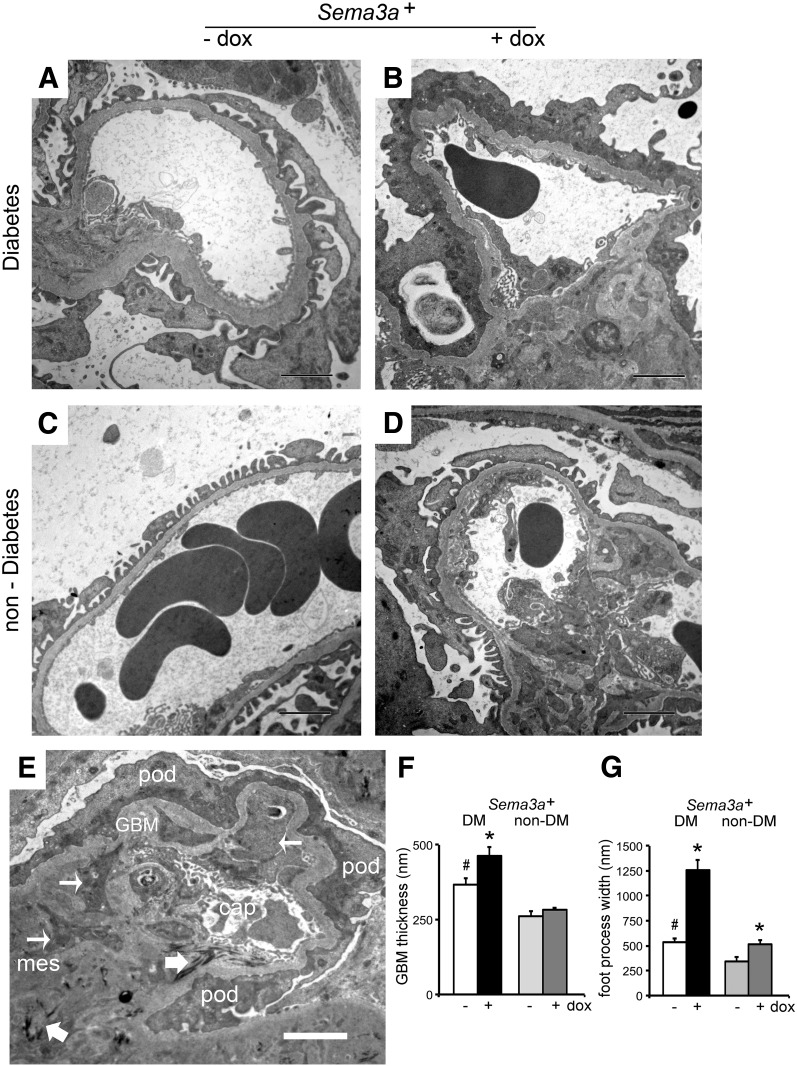
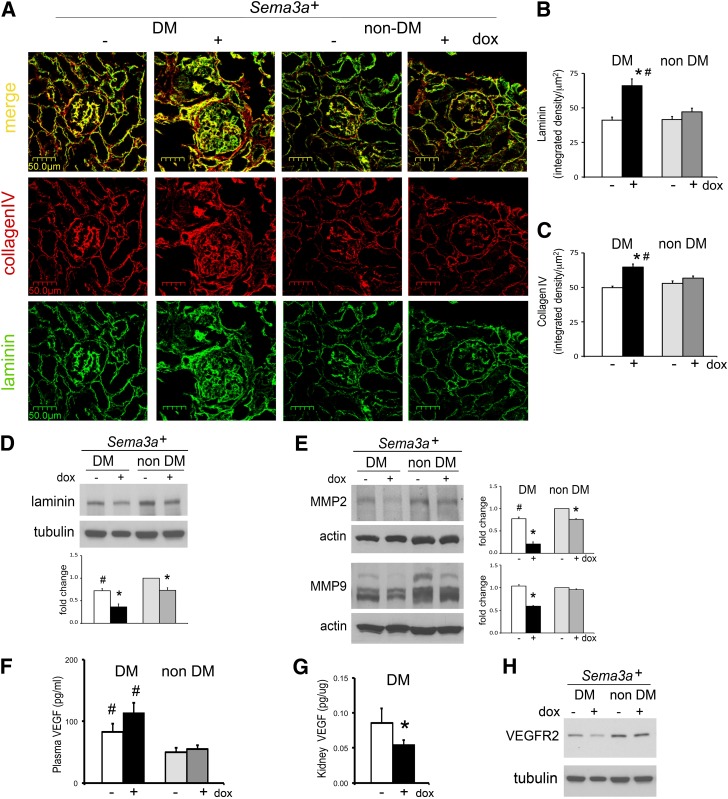
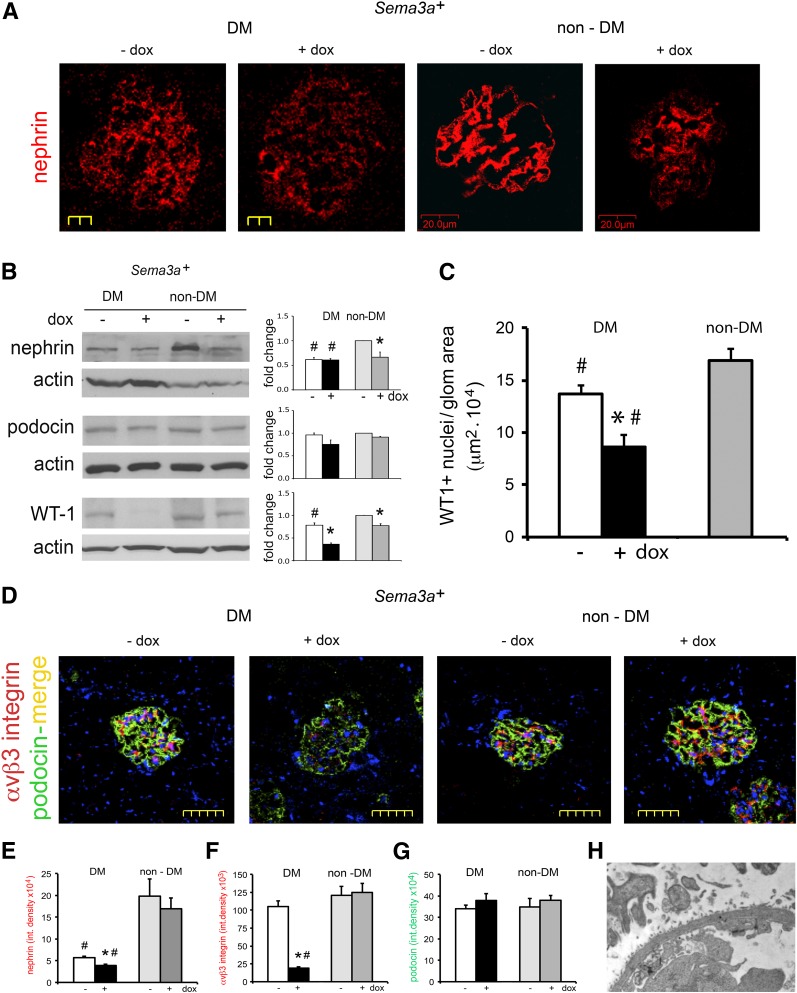
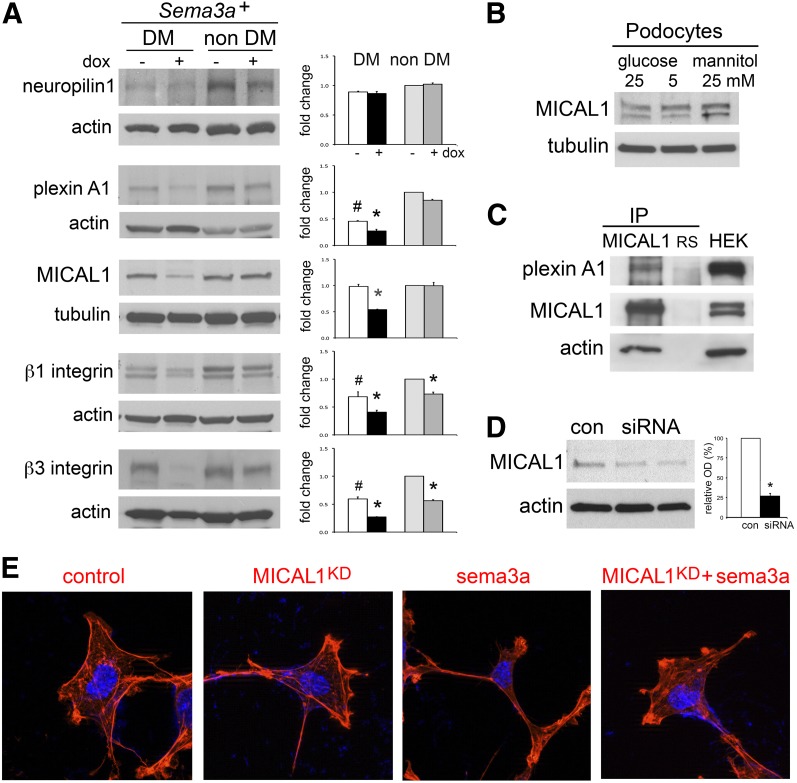
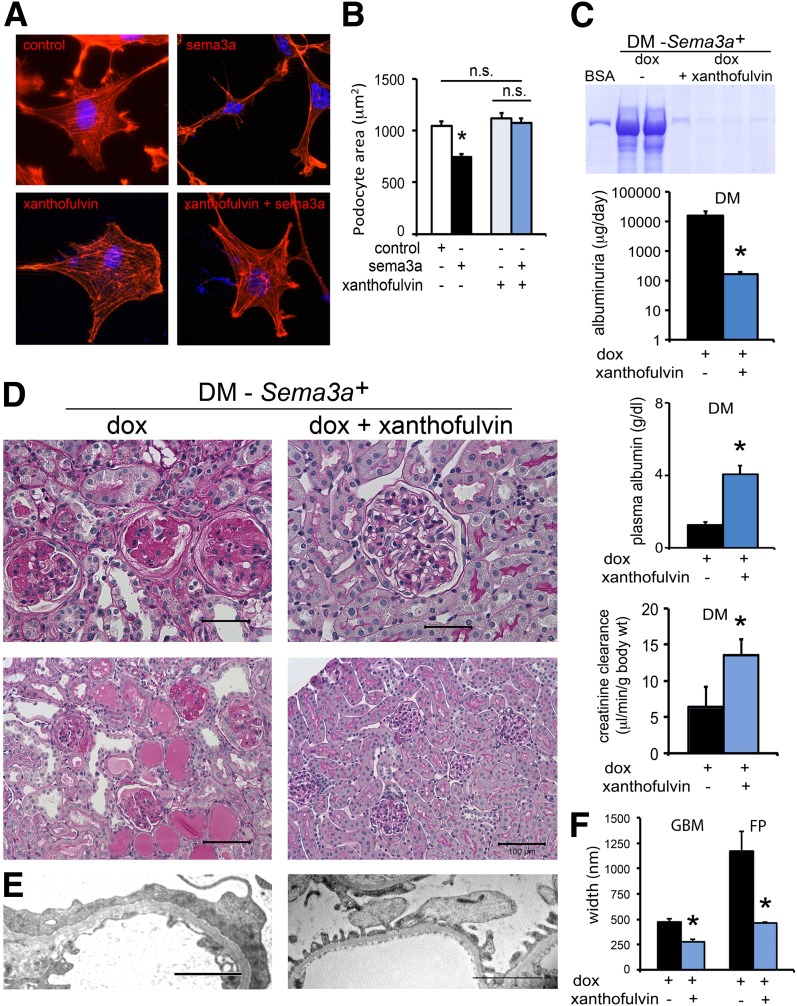
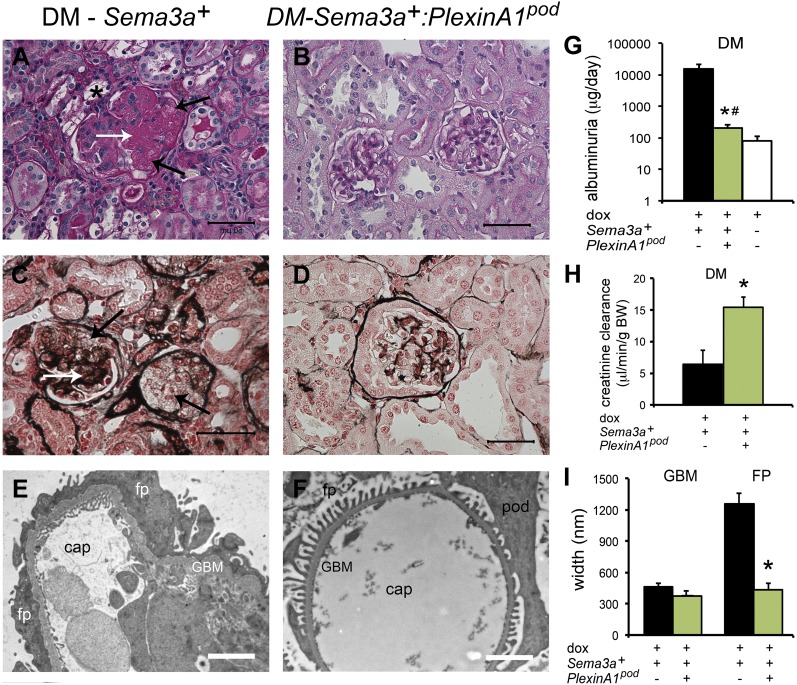
The onset of diabetic nephropathy (DN) is highlighted by glomerular filtration barrier abnormalities. Identifying pathogenic factors and targetable pathways driving DN is crucial to developing novel therapies and improving the disease outcome. Semaphorin3a (sema3a) is a guidance protein secreted by podocytes. Excess sema3a disrupts the glomerular filtration barrier. Here, using immunohistochemistry, we show increased podocyte SEMA3A in renal biopsies from patients with advanced DN. Using inducible, podocyte-specific Sema3a gain-of-function (Sema3a(+)) mice made diabetic with streptozotocin, we demonstrate that sema3a is pathogenic in DN. Diabetic Sema3a(+) mice develop massive proteinuria, renal insufficiency, and extensive nodular glomerulosclerosis, mimicking advanced DN in humans. In diabetic mice, Sema3a(+) exacerbates laminin and collagen IV accumulation in Kimmelstiel-Wilson-like glomerular nodules and causes diffuse podocyte foot process effacement and F-actin collapse via nephrin, αvβ3 integrin, and MICAL1 interactions with plexinA1. MICAL1 knockdown and sema3a inhibition render podocytes not susceptible to sema3a-induced shape changes, indicating that MICAL1 mediates sema3a-induced podocyte F-actin collapse. Moreover, sema3a binding inhibition or podocyte-specific plexinA1 deletion markedly ameliorates albuminuria and abrogates renal insufficiency and the diabetic nodular glomerulosclerosis phenotype of diabetic Sema3a(+) mice. Collectively, these findings indicate that excess sema3a promotes severe diabetic nephropathy and identifies novel potential therapeutic targets for DN.


Figures

Figure 1
Figure 1
Podocyte SEMA3A is increased in human diabetic nephropathy. Dual fluorescent immunohistochemistry with SEMA3A and NPH2 antibodies was performed in frozen sections from human renal biopsies. A–C: Representative images from a biopsy with class IV diabetic nephropathy show a strong SEMA3A signal (A, red) localized to podocytes, as indicated by colocalization with podocin (B, green) shown in a merge (C, yellow/orange). Scale bars = 50 μm. D–F: Representative images from a nondiabetic kidney biopsy (a patient with hypertension and no evidence of renal pathology) show minimal SEMA3A signal localized to podocytes. Scale bars = 50 μm. G: Representative low-magnification image from nondiabetic kidney biopsy (MCD) shows minimal SEMA3A in three glomeruli, whereas podocin expression is intact. Scale bar = 200 μm. H: Representative low-magnification image from a diabetic kidney biopsy shows strong glomerular SEMA3A expression and variable colocalized podocin expression. Scale bar = 200 μm. I and J: Quantitation of immunofluorescent signals shows that SEMA3A increases approximately twofold in diabetic glomeruli (red bars) compared with nondiabetic glomeruli (white bars), whereas podocin (green bars) does not change or decreases slightly. Data are expressed as mean ± SEM immunofluorescent integrated density/μm2 (I) and percentage of glomerular area stained on immunofluorescence (J). All glomeruli present in the biopsies were included in this quantitative analysis. DM, diabetes mellitus.
Figure 2
Figure 2
Excess Sema3a in diabetic mice causes massive proteinuria and renal failure. A: Sema3a+ gain of function and diabetes have additive effects, increasing plasma concentrations of sema3a. B: Diabetes increases sema3a excretion, and Sema3a+ gain of function induces a synergistic increase. C: Quantification of albuminuria by ELISA (notice the logarithmic scale): Sema3a+ gain of function in diabetic mice causes massive albuminuria, ∼40-fold higher than in control diabetic mice. D: Coomassie blue stain of urine resolved by SDS-PAGE illustrates proteinuria (in the nephrotic range) in diabetic mice with Sema3a+ gain of function (DM-Sema3a+ +dox). E: Diabetic mice with Sema3a+ gain of function develop hypoalbuminemia. F–H: Sema3a+ gain of function in diabetic mice induces renal failure. F: Sema3a+ gain of function induces a doubling of plasma creatinine in diabetic mice and a lesser increase in nondiabetic mice. Creatinine clearance decreases ∼60% in diabetic mice with Sema3a+ gain of function (G) and correlates inversely with plasma sema3a concentration (H). I: Albuminuria correlates directly with urine sema3a excretion. J: Bar graphs show body weight, kidney weight, urine output, and blood glucose in all experimental groups. Notice severe polyuria in Sema3a+ gain-of-function diabetic compared with control diabetic mice, without a significant change in random blood glucose. *P < 0.05 vs. corresponding control. #P < 0.05 vs. nondiabetic control. White bars are diabetic controls (-dox); black bars are diabetic sema3a gain-of-function (+dox); light gray are nondiabetic (-dox); dark gray are nondiabetic sema3a gain-of-function (+dox). BW, body weight; DM, diabetes mellitus; dox, doxycycline; MW, molecular weight.
Figure 3
Figure 3
Sema3a+ gain of function in diabetic mice causes advanced diabetic nephropathy. Periodic acid Schiff (PAS) stain of nondiabetic kidneys (Sema3a+) shows normal histology in control kidney (-dox) (A), whereas a kidney from a mouse receiving doxycycline (+dox) shows mesangial expansion (B). C: PAS staining of a biopsy sample from a control diabetic kidney (diabetes mellitus [DM]-Sema3a+ -dox) shows mild mesangial expansion. D: Quantification of glomerular area indicates that Sema3a+ gain of function in diabetic mice induces glomerulomegaly (DM-Sema3a+ +dox vs. DM-Sema3a+ -dox; n = 4 kidneys each, 34 ± 2 glomeruli/kidney). E–M: PAS and Jones’ silver stains of Sema3a+ gain-of-function diabetic kidneys (DM-Sema3a+ +dox) show nodular Kimmelstiel-Wilson-like glomerulosclerosis (white arrows), mesangiolysis (black arrows), diffuse glomerulosclerosis (white open arrow), fibrin caps (blue arrows), arteriolar hyalinosis (yellow arrows), foam cells (blue asterisks), protein casts (black asterisks), and interstitial infiltrates (yellow asterisk). N: Quantification of glomerular nodules and mesangiolysis, shown as a percentage of glomeruli with nodules or mesangiolysis per kidney in diabetic Sema3a+ gain-of-function (+dox) vs. diabetic control mice (-dox) (134 ± 6 and 121 ± 5 glomeruli/kidney were counted in n = 5 and n = 4 kidneys, respectively; P < 0.05). Semiquantitative pathology score shows significantly increased mesangial sclerosis in all Sema3a+ gain-of-function kidneys, whereas interstitial fibrosis occurs exclusively in Sema3a+ gain-of-function diabetic mice (black bars). Scale bars = 50 μm (A–C, E–L). *P < 0.05, Sema3a+ gain-of-function vs. diabetic control mice.
Figure 4
Figure 4
Sema3a+ gain of function in diabetic mice causes diffuse foot process effacement (FPE), mesangial sclerosis, and endothelial injury. A: TEM shows focal FPE and a thick GBM in control diabetic glomeruli. B: TEM of Sema3a+ gain-of-function diabetic glomeruli shows diffuse FPE, podocyte vacuolization, and absence of slit diaphragms, GBM thickening, mesangial sclerosis, and endothelial injury (endothelial cell swelling and expansion of the subendothelial space). C: TEM of nondiabetic control glomeruli show normal glomerular ultrastructure. D: TEM of nondiabetic Sema3a+ gain-of-function glomeruli shows focal FPE, mild endothelial swelling, and mesangial sclerosis. E: Sema3a+ gain-of-function diabetic glomerulus shows complete FPE with collapsed F-actin (darker gray), thick GBM, mesangial matrix (mes) interposition (thin arrows), extensive mesangial matrix accumulation with electron-dense fibrillar material (thick arrows), and narrow capillary lumen (cap). pod, podocyte. F: Quantitation of GBM thickness shows that excess sema3a exacerbates GBM thickening in diabetic mice (black bar vs. white bar), whereas it does not alter GBM in nondiabetic mice (gray bars). G: Quantitation of foot process width shows mild FPE in control mice with diabetes (DM) (white bar) and nondiabetics (non-DM) with excess sema3a (dark gray bar) and massive FPE (approximately threefold vs. control mice with diabetes) in Sema3a+ gain-of-function mice with diabetes (black bar). Scale bars = 2 μm. dox, doxycycline.
Figure 5
Figure 5
Laminin and collagen IV are increased in diabetic (DM)-Sema3a+ glomerular nodules. A: Dual-fluorescent immunohistochemistry shows increased laminin (green) and collagen IV (red) colocalized to glomeruli from diabetic Sema3a+ gain-of-function mice (DM-Sema3a+ + doxycycline [dox]). Quantitation of immunoreactive laminin (B) and collagen IV (C) signals demonstrates a significant increase in glomeruli from diabetic Sema3a+ gain-of-function mice. D: Western blotting shows decreased total kidney laminin in diabetic Sema3a+gain-of-function kidneys. E: MMP-2 and -9 are downregulated in Sema3a+ gain-of-function diabetic kidneys. F–H: Renal VEGF-A signaling is not upregulated in diabetic mice with Sema3a+ gain of function. F: Plasma VEGF-A is elevated in all diabetic mice compared with nondiabetic mice, irrespective of Sema3a+ gain-of-function induction. G: Kidney VEGF-A protein expression measured by ELISA is downregulated in diabetic mice with Sema3a+ gain of function. H: VEGFR2 kidney protein expression is decreased in diabetic mice with Sema3a+ gain of function. *P < 0.05 vs. corresponding control. #P < 0.05 vs. nondiabetic control.
Figure 6
Figure 6
Combined nephrin, WT1, and αvβ3 integrin downregulation accentuates podocytopenia in diabetic Sema3a+ gain-of-function mice. Nephrin downregulation is shown by immunofluorescence (IF) (A) and Western blotting (B) in all diabetic (DM) mice and in nondiabetic (non-DM) mice with excess sema3a; IF shows the least immunoreactive nephrin in Sema3a+ gain-of-function diabetic glomeruli (A and E). Podocin immunoblotting and IF are not significantly changed by diabetic nephropathy or excess sema3a (B and G), except in severely damaged glomeruli (diabetic-Sema3a+ + doxycycline [dox]; D). WT1 downregulation shown by immunoblotting (B) and IF WT1+ podocyte counts (C) in diabetic Sema3a+ gain-of-function kidneys (black bar), indicating podocytopenia; -dox and +dox nondiabetic WT1+ podocyte counts were not different and were pooled (gray bar). D: Dual-IF shows αvβ3 integrin downregulation in diabetic Sema3a+ gain-of-function glomeruli. Quantitation of glomerular IF signals for nephrin (E), αvβ3 integrin (F), and podocin (G). H: TEM from a Sema3a+ gain-of-function diabetic glomerulus shows an open capillary loop with GBM “denuded” of podocytes, illustrating the severe podocytopenia assessed by low podocyte (WT1+) counts shown in C. *P < 0.05 vs. corresponding control. #P < 0.05 vs. nondiabetic control. Scale bars = 20 μm (A), 50 μm (D), and 2 μm (H).
Figure 7
Figure 7
Sema3a signals in podocytes are mediated by MICAL1. A: Western blots show that the sema3a signaling pathway is expressed in the kidney. PlexinA1, MICAL1, and β3 integrin are downregulated in Sema3a+ gain-of-function diabetic (DM) mice (black bar). Quantitation by densitometry is shown in adjacent bar graphs. Data are expressed as mean ± SEM from three or more independent experiments. B: MICAL1 is expressed in cultured podocytes and is not altered by 4-h exposure to high glucose. C: Coimmunoprecipitation (IP) demonstrates an endogenous plexinA1–MICAL1 interaction in podocytes; actin coprecipitates with the plexinA1–MICAL1 complex. Rabbit serum (RS) and whole-cell lysate from HEK cells transiently transfected with full-length MICAL1 (HEK) were used as controls. D: Immunoblot shows MICAL1 knockdown of ∼75% by siRNA, confirmed by densitometric analysis. E: MICAL1 knockdown (KD) prevents sema3a-induced podocyte contraction and F-actin collapse, assessed by rhodamine-phalloidin staining. Data from three or more independent experiments are shown. *P < 0.05 vs. corresponding control. #P < 0.05 vs. nondiabetic control. OD, optical density.
Figure 8
Figure 8
The sema3a inhibitor xanthofulvin ameliorated the sema3a-induced diabetic nephropathy phenotype in vivo and prevented podocyte contraction in vitro. Pretreatment with 0.1 μmol/L xanthofulvin for 60 min abrogates sema3a-induced podocyte F-actin collapse, shape change, and contraction as assessed by rhodamine-phalloidin staining (A) and cell area morphometric analysis (B). Scale bars = 20 μm. C–E: Constant subcutaneous infusion of xanthofulvin for 30 days (weeks 8–12 after diabetes onset) to Sema3a+ gain-of-function diabetic (DM) mice (DM-Sema3a+ + doxycycline [dox] + xanthofulvin) resulted in improved albuminuria, normalized plasma albumin and creatinine clearance (C, blue bars), mild mesangial hypercellularity, and extracellular matrix expansion (D, right panels) similar to control diabetic mice, a dramatic improvement from the diabetic nephropathy phenotype of Sema3a+ gain-of-function diabetic mice (DM-Sema3a+ +dox; left panels). Scale bars = 50 μm (top panels) and 100 μm (bottom panels). E: TEM: the left panel shows a thick GBM and complete foot process effacement (FPE) in Sema3a+ gain-of-function diabetic glomerulus (+dox); the right panel shows focal FPE with a quite normal GBM in a glomerulus from a Sema3a+ gain-of-function diabetic mouse receiving xanthofulvin infusion (+dox + xanthofulvin). Scale bars = 2 μm. F: Morphometry confirmed the improvement of GBM and foot process (FP) width (blue bars). Black bars are diabetic sema3a gain-of-function (+dox); blue bars are diabetic sema3a gain-of-function receiving xanthofulvin (+dox + xanthofulvin). *P < 0.05 vs. Sema3a+ gain-of-function diabetic mice. n.s., not significant.
Figure 9
Figure 9
Deletion of podocyte plexinA1 attenuates diabetic nephropathy in mice. A–D: Periodic acid Schiff and Jones’ silver stains show severe diabetic (DM) nodular glomerulosclerosis in Sema3a+ gain-of function kidneys (A and C) and mild mesangial expansion and otherwise normal histology in diabetic Sema3a+:plexinA1pod kidneys (B and D). A: *, foam cell; A and C: white arrows, nodule; black arrows, mesangiolysis. Scale bars = 50 μm. TEM shows complete foot process (FP) effacement, thickened GBM, and endothelial swelling in Sema3a+ gain-of-function diabetic glomeruli (E), whereas TEM of Sema3a+:plexinA1pod mice shows very mild GBM thickening and virtually no FP effacement (F), as confirmed by morphometric analysis (n = 4 per group; I). Scale bars = 2 μm. G and H: Deletion of podocyte plexinA1 in diabetic mice results in mild albuminuria and normal creatinine clearance (green bars), similar to that in wild-type diabetic mice (white bar), whereas Sema3a+ gain of function causes massive albuminuria and renal insufficiency (black bars). Black bars are diabetic sema3a gain-of-function (+dox); green bars are diabetic plexinA1 knockout + sema3a gain-of-function (+dox); white bars are diabetic controls (-dox). *P < 0.05 vs. Sema3a+ gain of function. #P < 0.05 vs. wild-type diabetic mice. BW, body weight; cap, capillary lumen; dox, doxycycline; pod, podocyte.

Similar articles

Cited by

References

    1. Fineberg D, Jandeleit-Dahm KA, Cooper ME. Diabetic nephropathy: diagnosis and treatment. Nat Rev Endocrinol 2013;9:713–723 - PubMed
    1. Forbes JM, Cooper ME. Mechanisms of diabetic complications. Physiol Rev 2013;93:137–188 - PubMed
    1. Badal SS, Danesh FR. New insights into molecular mechanisms of diabetic kidney disease. Am J Kidney Dis 2014;63(Suppl 2):S63–S83 - PMC - PubMed
    1. Breyer MD. Drug discovery for diabetic nephropathy: trying the leap from mouse to man. Semin Nephrol 2012;32:445–451 - PubMed
    1. Mogensen CE, Christensen CK, Vittinghus E. The stages in diabetic renal disease. With emphasis on the stage of incipient diabetic nephropathy. Diabetes 1983;32(Suppl. 2):64–78 - PubMed

Publication types

MeSH terms