

Sixty-five common genetic variants and prediction of type 2 diabetes
- PMID: 25475436
- PMCID: PMC4407866
- DOI: 10.2337/db14-1504
Sixty-five common genetic variants and prediction of type 2 diabetes
Abstract
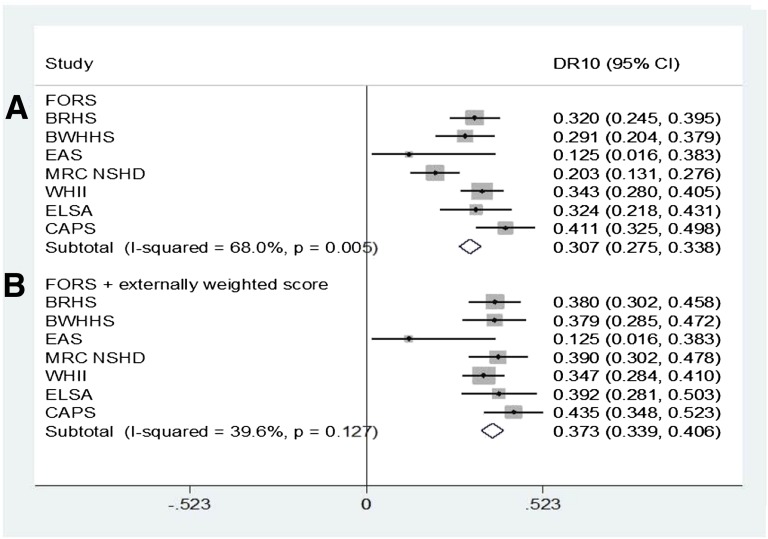
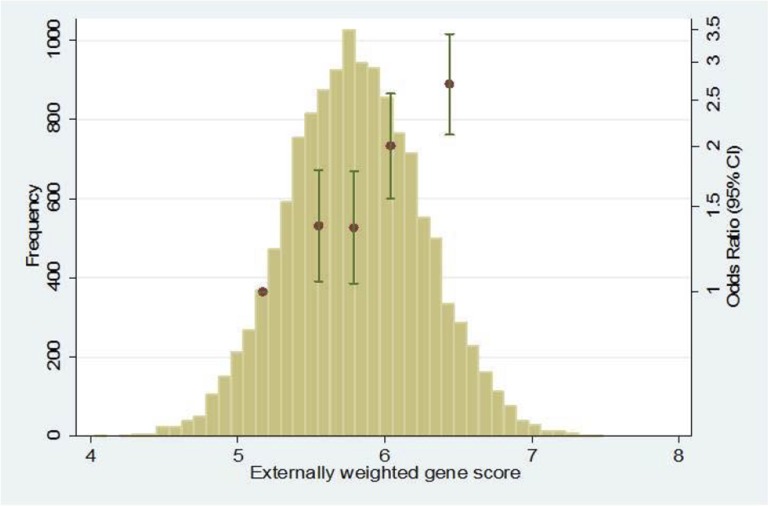
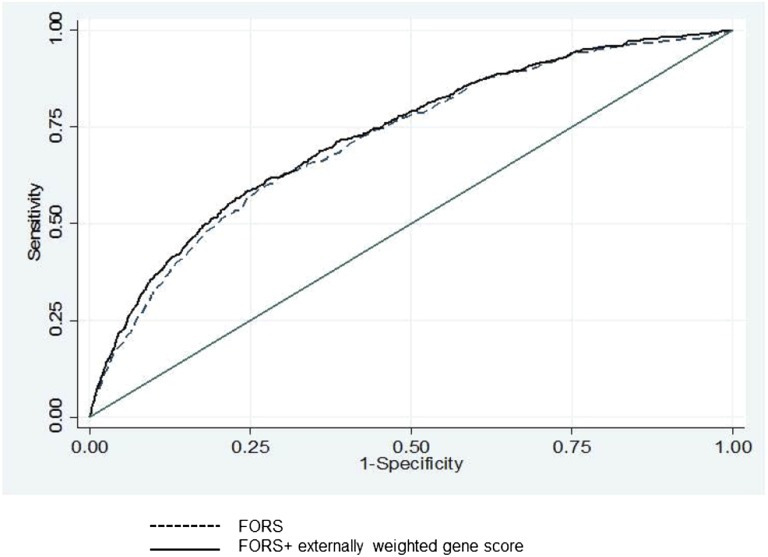
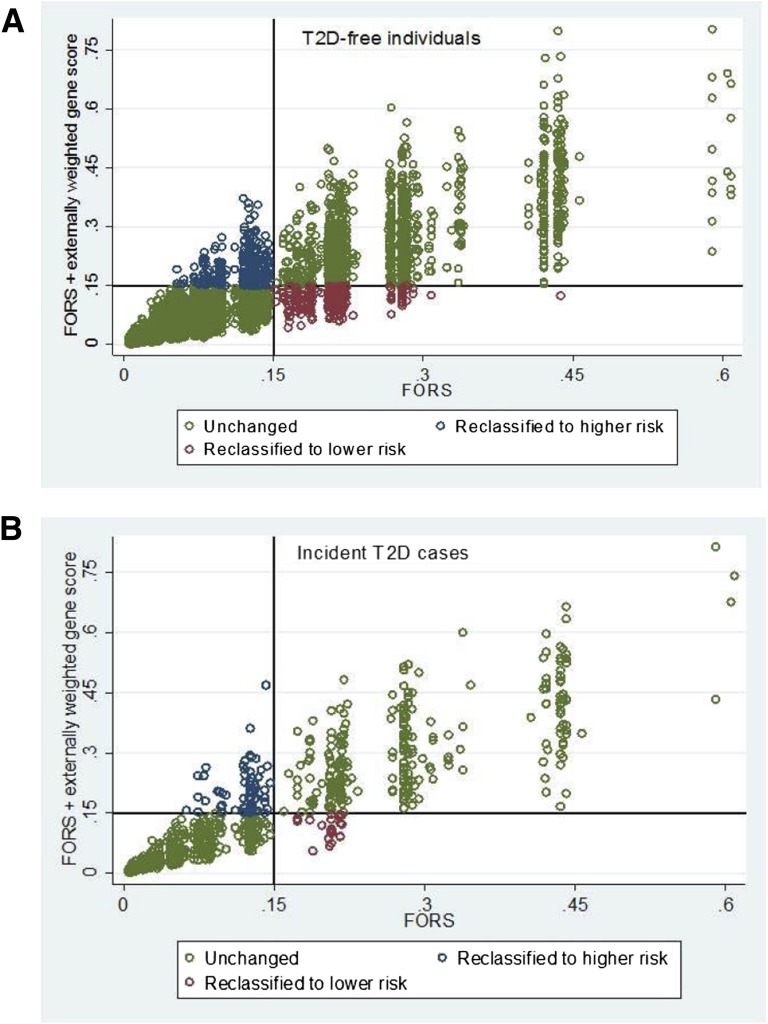
We developed a 65 type 2 diabetes (T2D) variant-weighted gene score to examine the impact on T2D risk assessment in a U.K.-based consortium of prospective studies, with subjects initially free from T2D (N = 13,294; 37.3% women; mean age 58.5 [38-99] years). We compared the performance of the gene score with the phenotypically derived Framingham Offspring Study T2D risk model and then the two in combination. Over the median 10 years of follow-up, 804 participants developed T2D. The odds ratio for T2D (top vs. bottom quintiles of gene score) was 2.70 (95% CI 2.12-3.43). With a 10% false-positive rate, the genetic score alone detected 19.9% incident cases, the Framingham risk model 30.7%, and together 37.3%. The respective area under the receiver operator characteristic curves were 0.60 (95% CI 0.58-0.62), 0.75 (95% CI 0.73 to 0.77), and 0.76 (95% CI 0.75 to 0.78). The combined risk score net reclassification improvement (NRI) was 8.1% (5.0 to 11.2; P = 3.31 × 10(-7)). While BMI stratification into tertiles influenced the NRI (BMI ≤24.5 kg/m(2), 27.6% [95% CI 17.7-37.5], P = 4.82 × 10(-8); 24.5-27.5 kg/m(2), 11.6% [95% CI 5.8-17.4], P = 9.88 × 10(-5); >27.5 kg/m(2), 2.6% [95% CI -1.4 to 6.6], P = 0.20), age categories did not. The addition of the gene score to a phenotypic risk model leads to a potentially clinically important improvement in discrimination of incident T2D.
© 2015 by the American Diabetes Association. Readers may use this article as long as the work is properly cited, the use is educational and not for profit, and the work is not altered.
Figures
Comment in
-
Advances in risk prediction of type 2 diabetes: integrating genetic scores with Framingham risk models.Diabetes. 2015 May;64(5):1495-7. doi: 10.2337/db15-0033. Diabetes. 2015. PMID: 25908872 Free PMC article. No abstract available.
References
-
- Færch K, Witte DR, Tabák AG, et al. Trajectories of cardiometabolic risk factors before diagnosis of three subtypes of type 2 diabetes: a post-hoc analysis of the longitudinal Whitehall II cohort study. Lancet Diabetes Endocrinol 2013;1:43–51 - PubMed
-
- Sinharoy K, Mandal L, Chakrabarti S, Paul UK, Bandyopadhyay R, Basu AK. A study on clinical and biochemical profile of low body weight type 2 diabetes mellitus. J Indian Med Assoc 2008;106:747–750 - PubMed
-
- Wilson PW, Meigs JB, Sullivan L, Fox CS, Nathan DM, D’Agostino RB Sr. Prediction of incident diabetes mellitus in middle-aged adults: the Framingham Offspring Study. Arch Intern Med 2007;167:1068–1074 - PubMed
Publication types
MeSH terms
Grants and funding
- K013351/MRC_/Medical Research Council/United Kingdom
- RG/08/008/25291/BHF_/British Heart Foundation/United Kingdom
- RG/10/12/28456/BHF_/British Heart Foundation/United Kingdom
- AG1764406S1/AG/NIA NIH HHS/United States
- RG/08/013/25942/BHF_/British Heart Foundation/United Kingdom
- MC_UU_12015/2/MRC_/Medical Research Council/United Kingdom
- rg/07/008/23674/BHF_/British Heart Foundation/United Kingdom
- MC_UU_12013/1/MRC_/Medical Research Council/United Kingdom
- 5R01-AG-13196/AG/NIA NIH HHS/United States
- RG/13/16/30528/BHF_/British Heart Foundation/United Kingdom
- MC_UU_12013/8/MRC_/Medical Research Council/United Kingdom
- G1001799/MRC_/Medical Research Council/United Kingdom
- CZB/4/672/CSO_/Chief Scientist Office/United Kingdom
- MC_UU_12019/1/MRC_/Medical Research Council/United Kingdom
- PG/13/66/30442/BHF_/British Heart Foundation/United Kingdom
- ID85374/MRC_/Medical Research Council/United Kingdom
- G0802432/MRC_/Medical Research Council/United Kingdom
- R01 HL036310/HL/NHLBI NIH HHS/United States
- MR/K006215/1/MRC_/Medical Research Council/United Kingdom
- HL 33014/HL/NHLBI NIH HHS/United States
- HS-06516/HS/AHRQ HHS/United States
- MC_UU_12015/1/MRC_/Medical Research Council/United Kingdom
- G0801414/MRC_/Medical Research Council/United Kingdom
- BHFPG08/008/BHF_/British Heart Foundation/United Kingdom
- MC_U106179472/MRC_/Medical Research Council/United Kingdom
- MR/K006584/1/MRC_/Medical Research Council/United Kingdom
- MR/K013351/1/MRC_/Medical Research Council/United Kingdom
- R01 AG013196/AG/NIA NIH HHS/United States
- PG07/133/24260/BHF_/British Heart Foundation/United Kingdom
- MC_UU_12013/5/MRC_/Medical Research Council/United Kingdom
- RG/98002/BHF_/British Heart Foundation/United Kingdom
- HL-036310/HL/NHLBI NIH HHS/United States
- RG/07/008/23674/BHF_/British Heart Foundation/United Kingdom
LinkOut - more resources
Full Text Sources
Other Literature Sources
Medical
Molecular Biology Databases
