. 2015 Jan;167(1):102-17.
doi: 10.1104/pp.114.247767. Epub 2014 Dec 4.

Consequences of a deficit in vitamin B6 biosynthesis de novo for hormone homeostasis and root development in Arabidopsis

Affiliations

Consequences of a deficit in vitamin B6 biosynthesis de novo for hormone homeostasis and root development in Arabidopsis

Svetlana Boycheva et al. Plant Physiol. 2015 Jan.

Abstract

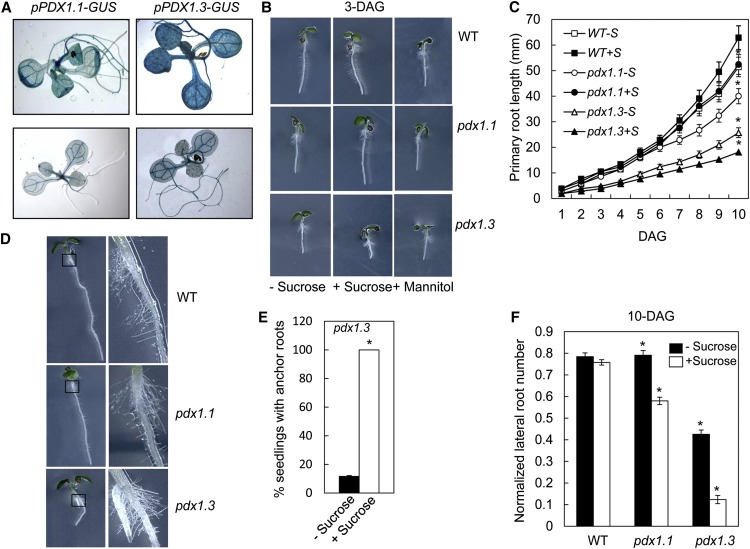
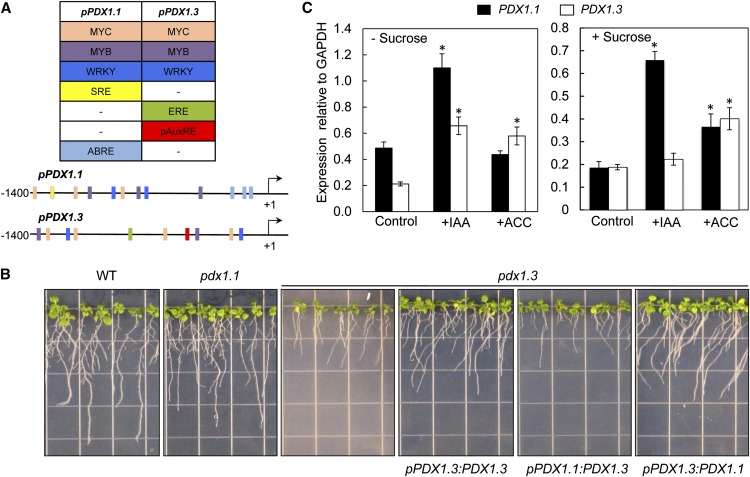
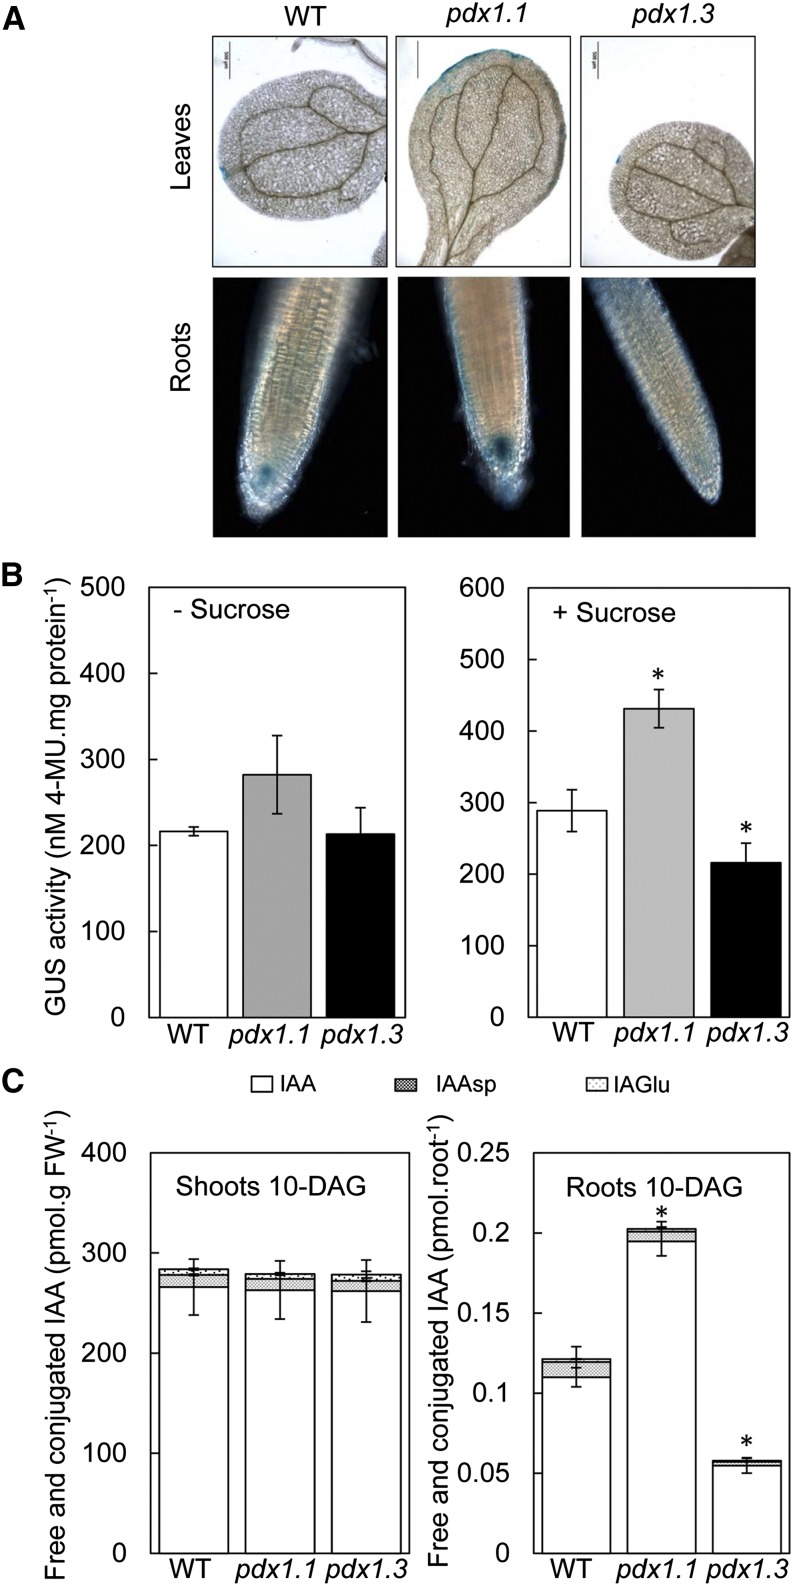
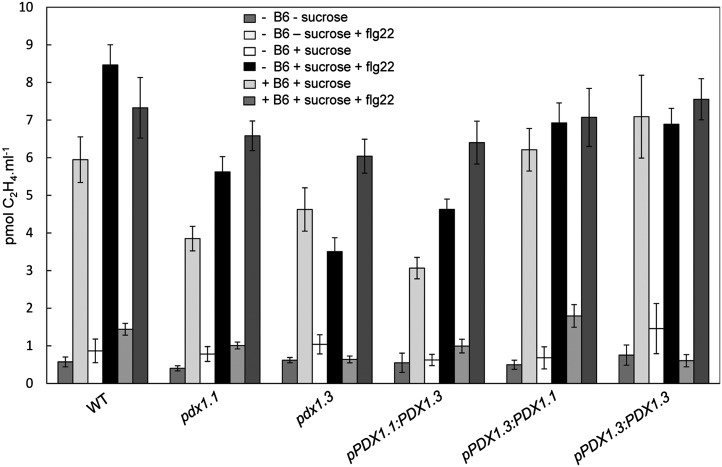
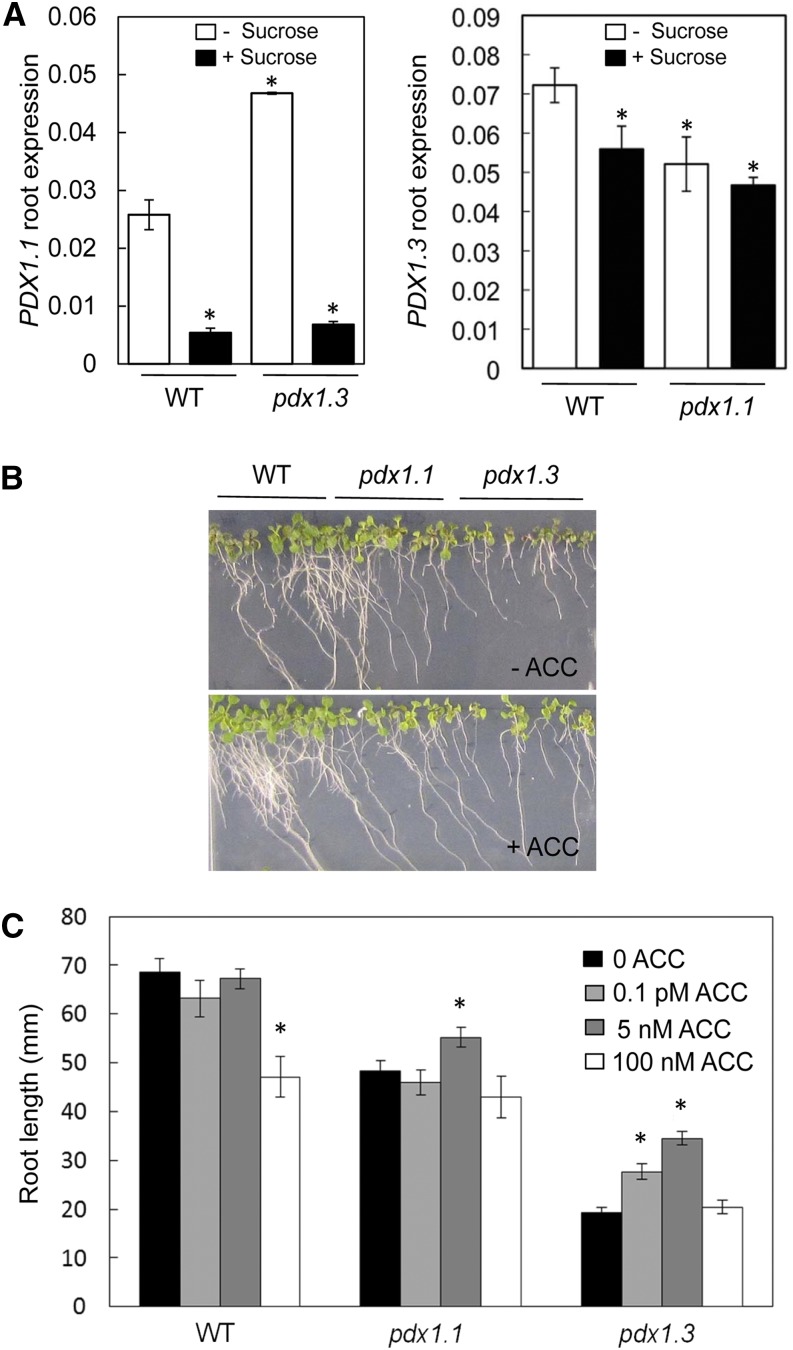
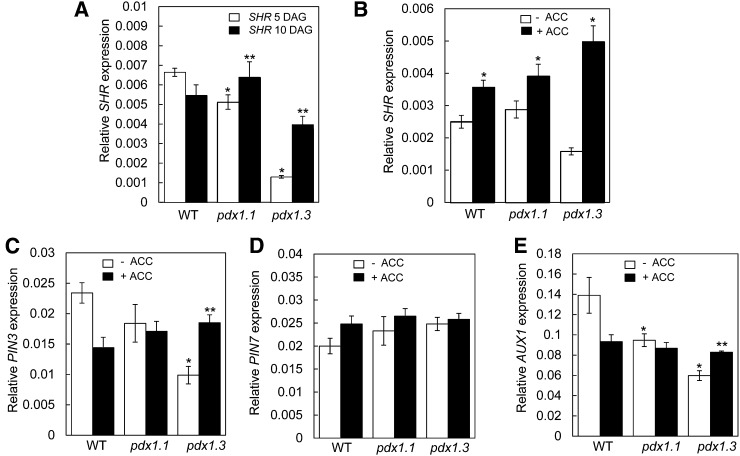
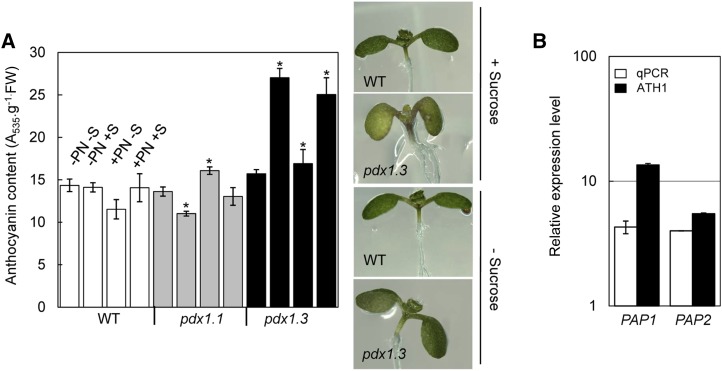
Vitamin B(6) (pyridoxal 5'-phosphate) is an essential cofactor of many metabolic enzymes. Plants biosynthesize the vitamin de novo employing two enzymes, pyridoxine synthase1 (PDX1) and PDX2. In Arabidopsis (Arabidopsis thaliana), there are two catalytically active paralogs of PDX1 (PDX1.1 and PDX1.3) producing the vitamin at comparable rates. Since single mutants are viable but the pdx1.1 pdx1.3 double mutant is lethal, the corresponding enzymes seem redundant. However, the single mutants exhibit substantial phenotypic differences, particularly at the level of root development, with pdx1.3 being more impaired than pdx1.1. Here, we investigate the differential regulation of PDX1.1 and PDX1.3 by identifying factors involved in their disparate phenotypes. Swapped-promoter experiments clarify the presence of distinct regulatory elements in the upstream regions of both genes. Exogenous sucrose (Suc) triggers impaired ethylene production in both mutants but is more severe in pdx1.3 than in pdx1.1. Interestingly, Suc specifically represses PDX1.1 expression, accounting for the stronger vitamin B6 deficit in pdx1.3 compared with pdx1.1. Surprisingly, Suc enhances auxin levels in pdx1.1, whereas the levels are diminished in pdx1.3. In the case of pdx1.3, the previously reported reduced meristem activity combined with the impaired ethylene and auxin levels manifest the specific root developmental defects. Moreover, it is the deficit in ethylene production and/or signaling that triggers this outcome. On the other hand, we hypothesize that it is the increased auxin content of pdx1.1 that is responsible for the root developmental defects observed therein. We conclude that PDX1.1 and PDX1.3 play partially nonredundant roles and are differentially regulated as manifested in disparate root growth impairment morphologies.


Figures

Figure 1.
Figure 1.
Gross divergence in the morphology of pdx1.1 and pdx1.3. A, Staining of the promoter-GUS fusion lines pPDX1.1:GUS and pPDX1.3:GUS at 37°C (top row) and 25°C (bottom row) in the Col-0 background. B, Root growth at 3 DAG of pdx1.1 and pdx1.3 plants grown in the presence of 1% (w/v) Suc compared with wild-type (WT) Col-0; pdx1.3 seedlings grown in the presence of the osmoticum mannitol (1%) are also shown. C, Kinetics of root growth of pdx1.1 and pdx1.3 seedlings in the presence or absence of Suc (S) compared with the wild type. The data are from three biological repetitions. Error bars indicate se. Asterisks indicate statistically significant differences (P < 0.001) in comparison with the wild type grown on Suc. D, Morphology of pdx1.1 and pdx1.3 compared with the wild type at 5 DAG. Adventitious roots can be seen in pdx1.3. The black squares outline the areas magnified on the right. E, Number of pdx1.3 seedlings that develop anchor roots in the presence or absence of Suc. The data are derived from three independent experiments. Values display statistically significant differences for P < 0.001. F, Number of lateral roots normalized against the length of the branching zone for each plant. Plants were grown until 10 DAG in the presence or absence of Suc. The data are from three biological repetitions. Error bars indicate se. Asterisks indicate statistically significant differences (P < 0.001) when compared with the wild type.
Figure 2.
Figure 2.
Evidence for differential regulation of PDX1.1 compared with PDX1.3. A, The scheme depicts elements found in the upstream regions of PDX1.1 (pPDX1.1) and PDX1.3 (pPDX1.3). WRKY, MYB, and MYC correspond to elements recognized by the respective transcription factors. ABRE, Abscisic acid response element; pAuxRE, partial AuxRE; SRE, sugar response element; +1, transcriptional start site. B, Control of the expression of PDX1.3 by the upstream region of PDX1.1 cannot complement the impaired root growth of pdx1.3. Seedlings of wild-type (WT) Col-0, pdx1.1, and pdx1.3 are compared with the pdx1.3 line carrying swapped promoters: the upstream region of PDX1.1 fused to PDX1.3 (pPDX1.1:PDX1.3), the upstream region of PDX1.3 fused to PDX1.1 (pPDX1.3:PDX1.1), and the upstream region of PDX1.3 fused to PDX1.3 (pPDX1.3:PDX1.3) as a control. Seedlings were grown vertically in the presence of 1% (w/v) Suc. Images were captured at 10 DAG. C, Relative expression levels of PDX1.1 and PDX1.3 in Col-0 control plants (whole seedlings) after treatment with IAA and the ethylene precursor 1-aminocyclopropane-1-carboxylic acid (ACC) in the presence or absence of Suc in the growth medium. Values are relative to GAPDH (At1g13440). The data are from at least three biological repetitions. Error bars represent se. Asterisks indicate statistically significant differences (P < 0.05) when treatments are compared with the respective controls.
Figure 3.
Figure 3.
Levels of auxin in roots of pdx1.1 and pdx1.3. A, GUS staining of leaves and roots of pdx1.1 and pdx1.3 compared with wild-type (WT) Col-0 carrying the auxin-responsive promoter DR5 fused to GUS. Seedlings were grown in the presence of 1% (w/v) Suc, and images were captured at 10 DAG. B, Quantitative GUS analysis performed with 4-methylumbelliferyl glucuronide (4-MU) in the absence (left) or presence (right) of Suc. Plant lines are at the same age as in A. The data are from at least three biological repetitions. Error bars represent se. Asterisks indicate statistically significant differences (P < 0.05) when compared with the wild type. C, Quantification of free and conjugated auxin in shoots and roots of pdx1.1 and pdx1.3 compared with the wild type. Seedlings were grown on medium in the presence of 1% (w/v) Suc and were analyzed at 10 DAG. The data are from at least three biological repetitions. Error bars represent se. Asterisks indicate statistically significant differences (P < 0.05) when compared with the wild type. FW, Fresh weight.
Figure 4.
Figure 4.
Ethylene production is impaired in pdx1 mutants. Production of ethylene (C2H4) was induced in the presence of the flg22 peptide elicitor. Seedlings used were grown in the presence or absence of Suc and pyridoxine (B6) as indicated until 10 DAG. The lines used are the wild type (WT), pdx1.1, pdx1.3, the upstream region of PDX1.1 fused to PDX1.3 (pPDX1.1:PDX1.3), the upstream region of PDX1.3 fused to PDX1.1 (pPDX1.3:PDX1.1), and the upstream region of PDX1.3 fused to PDX1.3 (pPDX1.3:PDX1.3). The data are from at least five biological repetitions. Error bars represent se.
Figure 5.
Figure 5.
Exogenous Suc represses PDX1.1 expression, but application of ACC can partially rescue the pdx1 root phenotype. A, Expression of PDX1.1 (left) and PDX1.3 (right) in roots of wild-type (WT) Col-0 and pdx1.3 or pdx1.1 in the absence or presence of 1% (w/v) Suc. Seedlings were allowed to grow until 10 DAG. The data are from at least three biological repetitions. Error bars represent se. Asterisks indicate statistically significant differences (P < 0.05) when treatments are compared with the wild type grown in the absence of Suc. B, Growth of the wild type, pdx1.1, and pdx1.3 in the presence of 1% (w/v) Suc as well as in the absence (top) or presence (bottom) of 5 nm ACC. The experiment was done three times, yielding similar results; images were captured at 10 DAG. C, Root length of wild-type, pdx1.1, and pdx1.3 seedlings at 10 DAG grown on 1% (w/v) Suc in the presence or absence of ACC (0–100 nm as indicated). The data are averages of three biological replicates; measurements were performed using ImageJ software (http://imagej.nih.gov/ij/). Error bars represent se. Asterisks indicate statistically significant differences (P < 0.05) when compared with the wild type in the absence of ACC.
Figure 6.
Figure 6.
The altered expression levels of SHR and selected auxin transporters is partially rescued by application of ACC. A, SHR transcript abundance in roots of wild-type (WT) Col-0, pdx1.1, and pdx1.3 seedlings grown in the presence of 1% (w/v) Suc at either 5 or 10 DAG. The data represent means from at least three biological replicates. Error bars represent se. Statistically significant differences (P < 0.05) between plants at different ages compared with the wild type are indicated with asterisks (*, 5 DAG; **, 10 DAG). B, Relative expression of SHR in root tips (10–12 mm) of seedlings grown in the presence of Suc for 10 DAG and in the presence or absence of 5 nm ACC. The data represent means from at least three biological replicates. Error bars represent se. Statistically significant differences (P < 0.05) of treatment groups compared with nontreated controls are indicated by asterisks. C to E, Transcript abundance of PIN3 (C), PIN7 (D), and AUX1 (E) in root tips (10–12 mm) grown on medium containing 1% (w/v) Suc and in the presence or absence of 5 nm ACC. The expression data for each gene were normalized against GAPDH (At1g13440). The data represent means from at least three biological replicates. Error bars represent se. Statistically significant differences (P < 0.05) between wild-type and mutant lines with (**) and without (*) ACC treatment are indicated.
Figure 7.
Figure 7.
Anthocyanin accumulation in pdx1.3. A, Anthocyanin levels in pdx1.1 and pdx1.3 compared with wild-type (WT) Col-0 in the presence or absence of pyridoxine (PN) and/or Suc (S). Seedlings were grown until 10 DAG. The data represent means from at least three biological replicates. Error bars represent se. Asterisks indicate statistically significant differences (P < 0.001) of mutant lines compared with the corresponding control wild-type line. The morphology of pdx1.3 in the presence or absence of Suc at this stage of growth is shown on the right compared with the wild type. B, Expression levels of PAP1 and PAP2 transcription factors involved in anthocyanin biosynthesis in pdx1.3 compared with wild-type Col-0. Transcript abundance was determined by both an ATH1 microarray (see text) and qPCR. In the case of the qPCR, the data are results of three biological replicates. Error bars represent se.
Figure 8.
Figure 8.
Consequences of a deficit in PLP for hormone homeostasis and root development in Arabidopsis. The top scenario indicates that, in the presence of sufficient PLP levels (yellow), as supplied by the catalytic action of PDX1.1 and PDX1.3, homeostasis of the two phytohormones auxin and ethylene is maintained for normal root development. The region around the root tip is amplified, part of which is shaded in blue to reflect arbitrary auxin levels at this stage of growth. The promoter regions of PDX1.1 and PDX1.3 are depicted by differently colored lines, to reflect their differential expression, while coding regions are shown as black boxes. The middle scenario illustrates observations in the pdx1.1 mutant. In this scenario, there is a mild deficit in the production of PLP (paler yellow; note that PDX1.3 is still expressed), which in turn affects ethylene production. However, auxin levels are much higher (shaded dark blue) than in the wild type, induced by the presence of Suc. The loss of PDX1.1 contributes to the inability to repress the accumulation of auxin as a function of Suc and may be related to the misregulation of PIF proteins. Overall, this results in impaired primary and lateral root growth. The bottom scenario depicts the situation in pdx1.3. In the presence of Suc, the expression of PDX1.1 is down-regulated and anthocyanins accumulate. The decrease in expression of both PDX1.3 and PDX1.1 leads to a major deficit in PLP production (pale yellow), which represses ethylene production. The combined deficit in ethylene production and the accumulation of anthocyanins negatively affects auxin biosynthesis (shaded pale blue) and its distribution. The expression of SHR is also decreased. Root apical meristem (RAM) activity is impaired, as reported (Chen and Xiong, 2005), leading to primary and lateral root growth defects and the appearance of anchor roots (dark gray).

Similar articles

Cited by

References

    1. Abe H, Urao T, Ito T, Seki M, Shinozaki K, Yamaguchi-Shinozaki K (2003) Arabidopsis AtMYC2 (bHLH) and AtMYB2 (MYB) function as transcriptional activators in abscisic acid signaling. Plant Cell 15: 63–78 - PMC - PubMed
    1. Benfey PN, Linstead PJ, Roberts K, Schiefelbein JW, Hauser MT, Aeschbacher RA (1993) Root development in Arabidopsis: four mutants with dramatically altered root morphogenesis. Development 119: 57–70 - PubMed
    1. Benková E, Michniewicz M, Sauer M, Teichmann T, Seifertová D, Jürgens G, Friml J (2003) Local, efflux-dependent auxin gradients as a common module for plant organ formation. Cell 115: 591–602 - PubMed
    1. Besseau S, Hoffmann L, Geoffroy P, Lapierre C, Pollet B, Legrand M (2007) Flavonoid accumulation in Arabidopsis repressed in lignin synthesis affects auxin transport and plant growth. Plant Cell 19: 148–162 - PMC - PubMed
    1. Blilou I, Xu J, Wildwater M, Willemsen V, Paponov I, Friml J, Heidstra R, Aida M, Palme K, Scheres B (2005) The PIN auxin efflux facilitator network controls growth and patterning in Arabidopsis roots. Nature 433: 39–44 - PubMed

Publication types

MeSH terms