

Identification of Biomarkers for PKD1 Using Urinary Exosomes
- PMID: 25475747
- PMCID: PMC4483583
- DOI: 10.1681/ASN.2014040354
Identification of Biomarkers for PKD1 Using Urinary Exosomes
Abstract
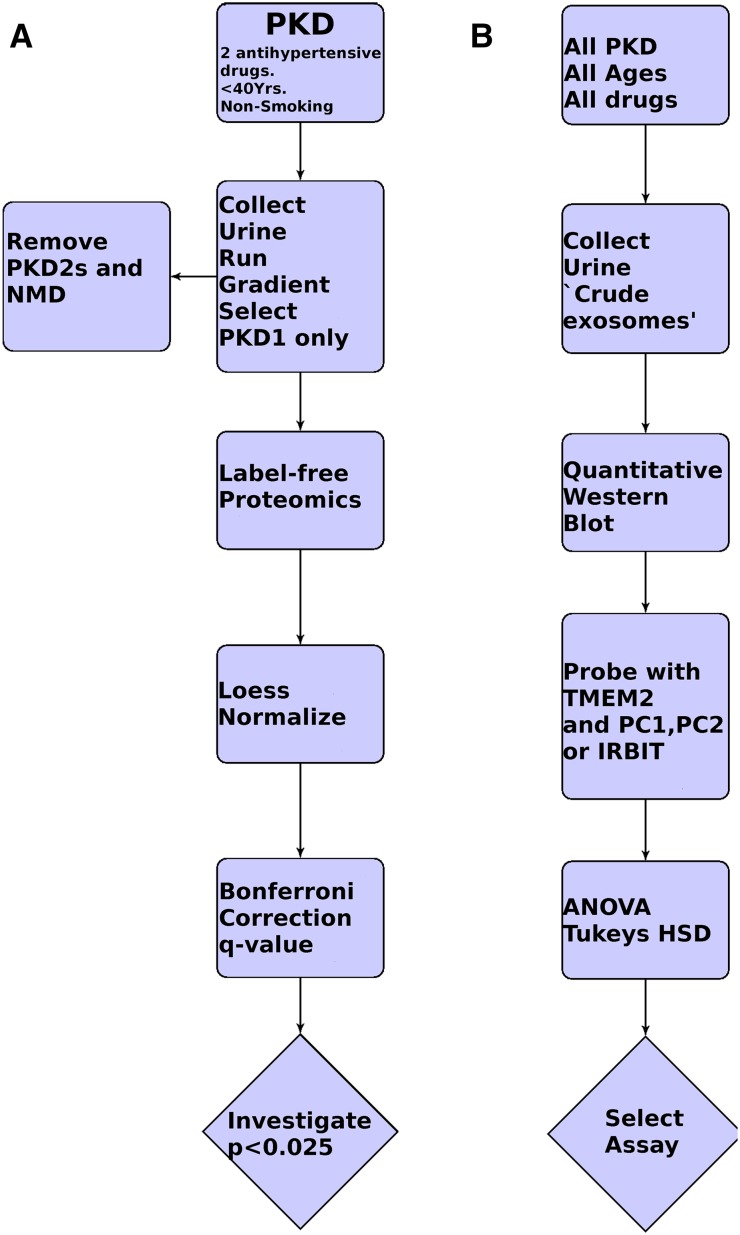
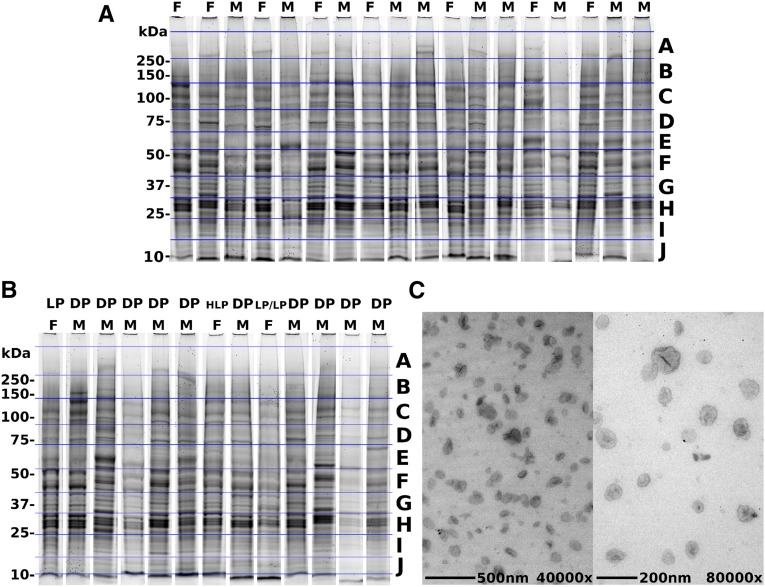
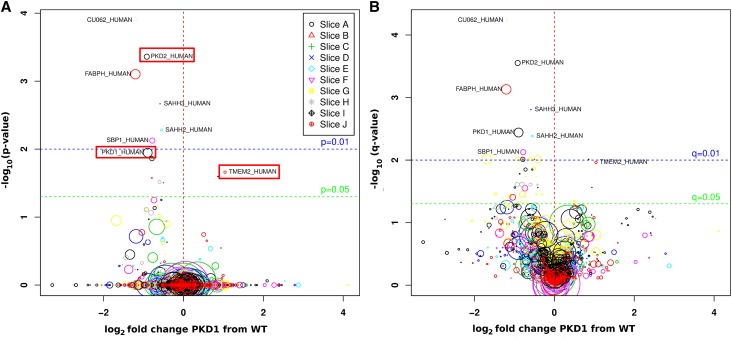
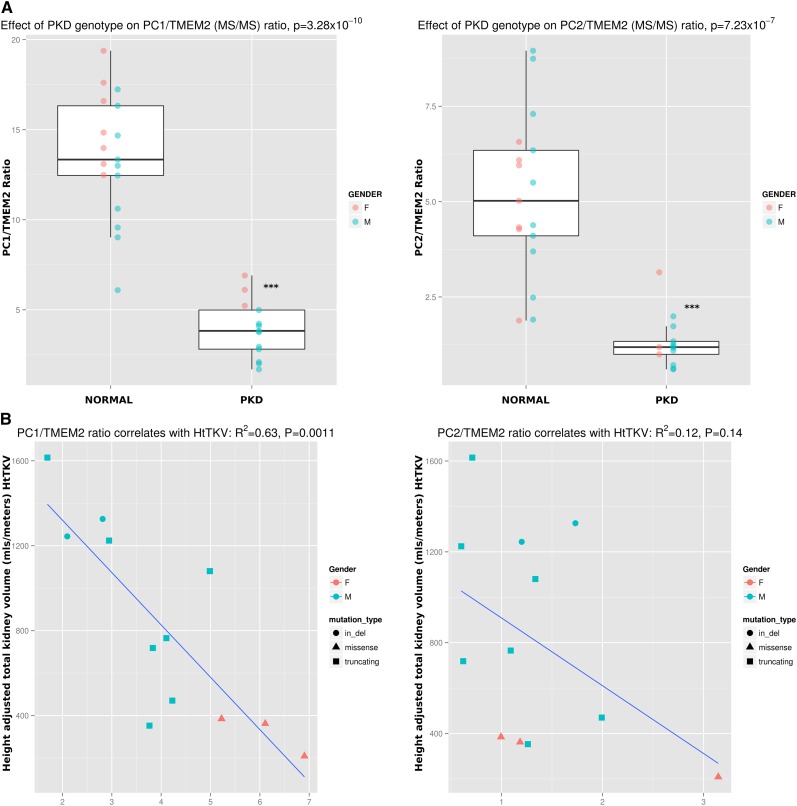
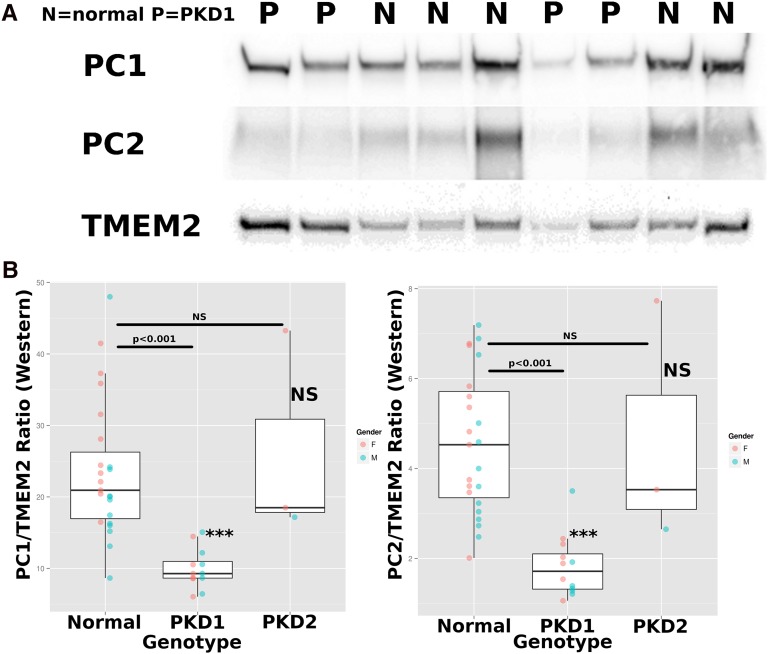
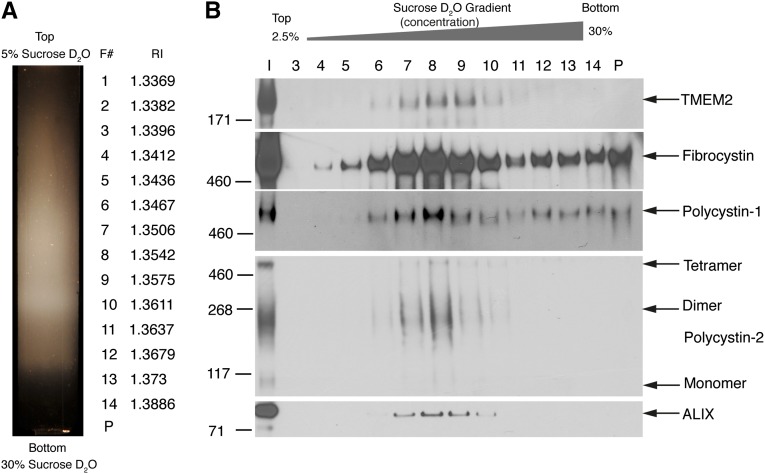
Autosomal dominant polycystic kidney disease (ADPKD) is a common cause of ESRD. Affected individuals inherit a defective copy of either PKD1 or PKD2, which encode polycystin-1 (PC1) or polycystin-2 (PC2), respectively. PC1 and PC2 are secreted on urinary exosome-like vesicles (ELVs) (100-nm diameter vesicles), in which PC1 is present in a cleaved form and may be complexed with PC2. Here, label-free quantitative proteomic studies of urine ELVs in an initial discovery cohort (13 individuals with PKD1 mutations and 18 normal controls) revealed that of 2008 ELV proteins, 9 (0.32%) were expressed at significantly different levels in samples from individuals with PKD1 mutations compared to controls (P<0.03). In samples from individuals with PKD1 mutations, levels of PC1 and PC2 were reduced to 54% (P<0.02) and 53% (P<0.001), respectively. Transmembrane protein 2 (TMEM2), a protein with homology to fibrocystin, was 2.1-fold higher in individuals with PKD1 mutations (P<0.03). The PC1/TMEM2 ratio correlated inversely with height-adjusted total kidney volume in the discovery cohort, and the ratio of PC1/TMEM2 or PC2/TMEM2 could be used to distinguish individuals with PKD1 mutations from controls in a confirmation cohort. In summary, results of this study suggest that a test measuring the urine exosomal PC1/TMEM2 or PC2/TMEM2 ratio may have utility in diagnosis and monitoring of polycystic kidney disease. Future studies will focus on increasing sample size and confirming these studies. The data were deposited in the ProteomeXchange (identifier PXD001075).
Keywords: ADPKD; genetic renal disease; polycystic kidney disease.
Copyright © 2015 by the American Society of Nephrology.
Figures
Similar articles
-
Reduced ciliary polycystin-2 in induced pluripotent stem cells from polycystic kidney disease patients with PKD1 mutations.J Am Soc Nephrol. 2013 Oct;24(10):1571-86. doi: 10.1681/ASN.2012111089. Epub 2013 Sep 5. J Am Soc Nephrol. 2013. PMID: 24009235 Free PMC article.
-
An extracellular vesicle based hypothesis for the genesis of the polycystic kidney diseases.Extracell Vesicle. 2024 Dec;4:100048. doi: 10.1016/j.vesic.2024.100048. Epub 2024 Jul 26. Extracell Vesicle. 2024. PMID: 39886526 Free PMC article.
-
Polycystin-1 maturation requires polycystin-2 in a dose-dependent manner.J Clin Invest. 2015 Feb;125(2):607-20. doi: 10.1172/JCI76972. Epub 2015 Jan 9. J Clin Invest. 2015. PMID: 25574838 Free PMC article.
-
Cilia and polycystic kidney disease.Semin Cell Dev Biol. 2021 Feb;110:139-148. doi: 10.1016/j.semcdb.2020.05.003. Epub 2020 May 28. Semin Cell Dev Biol. 2021. PMID: 32475690 Review.
-
Cardiovascular Involvement in Patients with Autosomal Dominant Polycystic Kidney Disease: A Review.Kidney Blood Press Res. 2024;49(1):9-19. doi: 10.1159/000529119. Epub 2023 Dec 14. Kidney Blood Press Res. 2024. PMID: 38096797 Review.
Cited by
-
Future embracing: exosomes driving a revolutionary approach to the diagnosis and treatment of idiopathic membranous nephropathy.J Nanobiotechnology. 2024 Aug 8;22(1):472. doi: 10.1186/s12951-024-02633-y. J Nanobiotechnology. 2024. PMID: 39118155 Free PMC article. Review.
-
Renal extracellular vesicles: from physiology to clinical application.J Physiol. 2016 Oct 15;594(20):5735-5748. doi: 10.1113/JP272182. Epub 2016 May 27. J Physiol. 2016. PMID: 27104781 Free PMC article. Review.
-
Tracking N- and C-termini of C. elegans polycystin-1 reveals their distinct targeting requirements and functions in cilia and extracellular vesicles.PLoS Genet. 2022 Dec 27;18(12):e1010560. doi: 10.1371/journal.pgen.1010560. eCollection 2022 Dec. PLoS Genet. 2022. PMID: 36574451 Free PMC article.
-
Exosomes: Emerging Therapy Delivery Tools and Biomarkers for Kidney Diseases.Stem Cells Int. 2021 Aug 21;2021:7844455. doi: 10.1155/2021/7844455. eCollection 2021. Stem Cells Int. 2021. PMID: 34471412 Free PMC article. Review.
-
Isolation and characterization of urinary extracellular vesicles: implications for biomarker discovery.Nat Rev Nephrol. 2017 Dec;13(12):731-749. doi: 10.1038/nrneph.2017.148. Epub 2017 Oct 30. Nat Rev Nephrol. 2017. PMID: 29081510 Free PMC article. Review.
References
-
- Iglesias CG, Torres VE, Offord KP, Holley KE, Beard CM, Kurland LT: Epidemiology of adult polycystic kidney disease, Olmsted County, Minnesota: 1935-1980. Am J Kidney Dis 2: 630–639, 1983 - PubMed
-
- Torres VE, Chapman AB, Devuyst O, Gansevoort RT, Grantham JJ, Higashihara E, Perrone RD, Krasa HB, Ouyang J, Czerwiec FS, TEMPO 3:4 Trial Investigators : Tolvaptan in patients with autosomal dominant polycystic kidney disease. N Engl J Med 367: 2407–2418, 2012 - PubMed
-
- Grantham JJ, Torres VE, Chapman AB, Guay-Woodford LM, Bae KT, King BF, Jr, Wetzel LH, Baumgarten DA, Kenney PJ, Harris PC, Klahr S, Bennett WM, Hirschman GN, Meyers CM, Zhang X, Zhu F, Miller JP, CRISP Investigators : Volume progression in polycystic kidney disease. N Engl J Med 354: 2122–2130, 2006 - PubMed
-
- The European Polycystic Kidney Disease Consortium : The polycystic kidney disease 1 gene encodes a 14 kb transcript and lies within a duplicated region on chromosome 16. Cell 77: 881–894, 1994 - PubMed
Publication types
MeSH terms
Substances
Grants and funding
LinkOut - more resources
Full Text Sources
Other Literature Sources
Research Materials
Miscellaneous
