Molecular genetic study of novel biomarkers for early diagnosis of oral squamous cell carcinoma
- PMID: 25475780
- PMCID: PMC4393979
- DOI: 10.4317/medoral.20229
Molecular genetic study of novel biomarkers for early diagnosis of oral squamous cell carcinoma
Abstract
Objectives: Early detection and treatment of an oral squamous cell carcinoma (OSCC) is critical because of its rapid growth, frequent lymph-node metastasis, and poor prognosis. However, no clinically-valuable methods of early diagnosis exist, and genetic analysis of OSCCs has yielded no biomarkers.
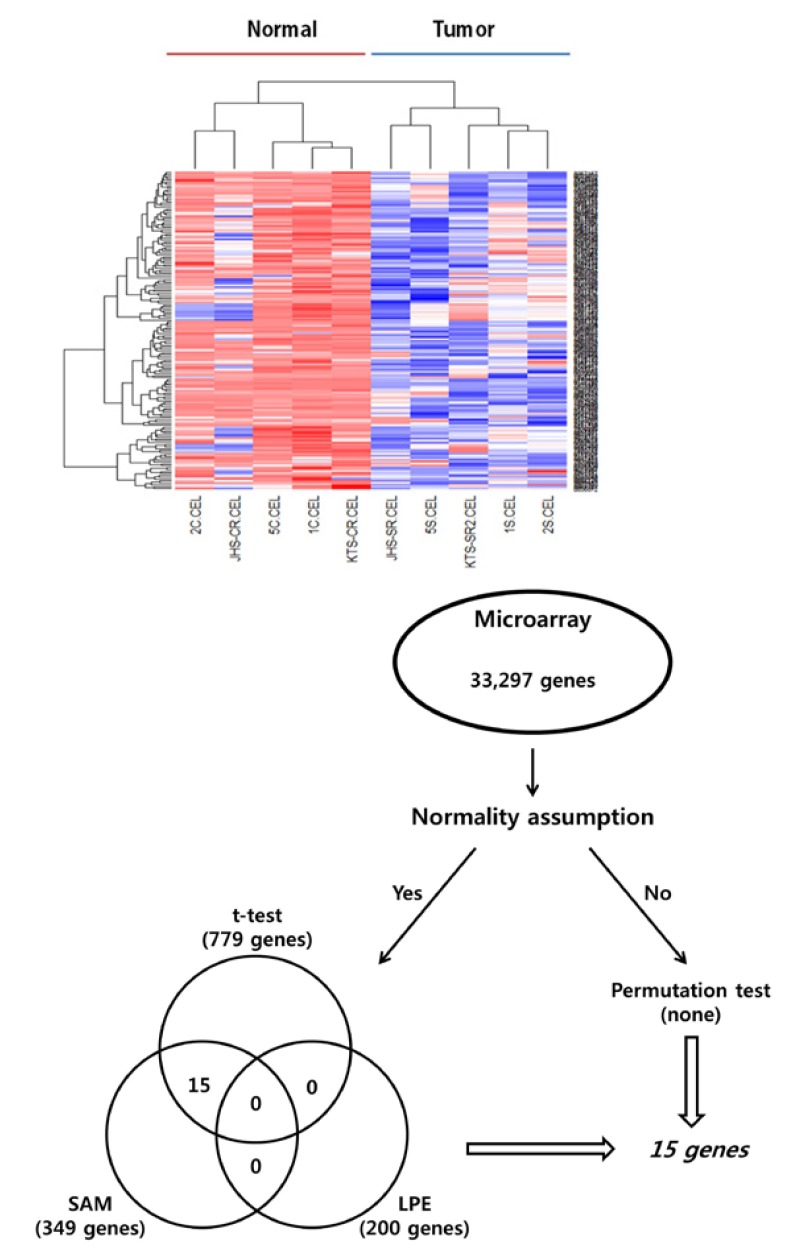
Study design: We investigated the expression of genes associated with inflammation in OSCCs via a quantitative reverse transcriptase polymerase chain reaction (qRT-PCR) analysis of microarray data. Tumor and normal tissues from five patients with an OSCC were used for microarray analysis. Differentially-expressed genes, identified using permutation, local pooled error (LPE), t-tests, and significance analysis of microarrays (SAM), were selected as candidate genetic markers.
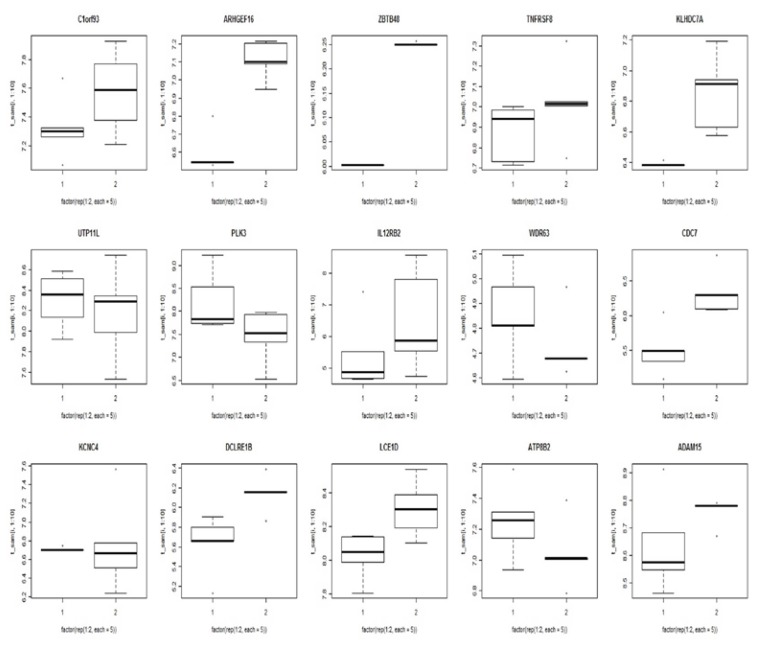
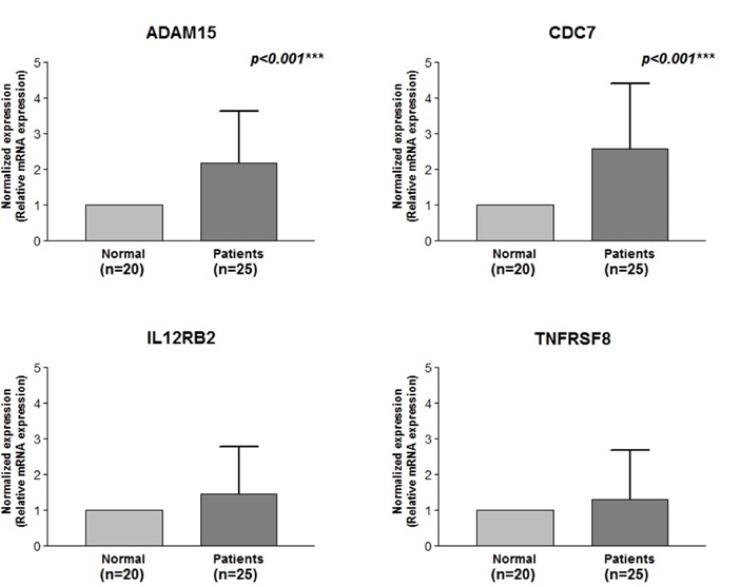
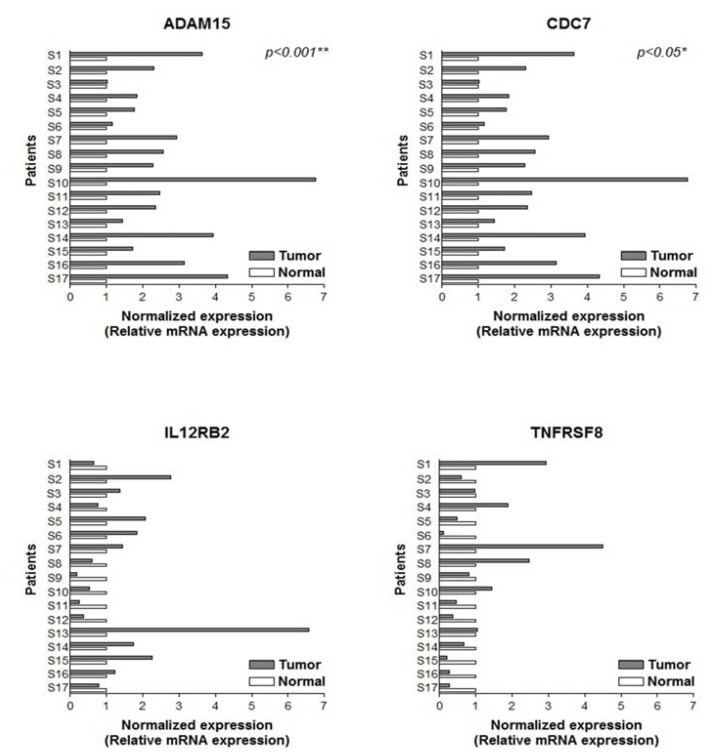
Results: Two groups corresponding to tissue identity were evident, implying that their differentially-expressed genes represented biological differences between tissues. Fifteen genes were identified using the Student's paired t-test (p<0.05) and the SAM, with a false discovery rate of less than 0.02. Based on gene expression, these 15 genes can be used to classify an OSCC. A genetic analysis of functional networks and ontologies, validated by using a qRT-PCR analysis of the tissue samples, identified four genes, ADAM15, CDC7, IL12RB2 and TNFRSF8, that demonstrated excellent concordance with the microarray data.
Conclusions: Our study demonstrated that four genes (ADAM15, CDC7, IL12RB2 and TNFRSF8) had potential as novel biomarkers for the diagnosis and the treatment of an OSCC.
Conflict of interest statement
Figures

Similar articles
-
Identification of potential biomarkers of lymph node metastasis in oral squamous cell carcinoma by cDNA microarray analysis.Int J Cancer. 2003 Sep 20;106(5):683-9. doi: 10.1002/ijc.11283. Int J Cancer. 2003. PMID: 12866027
-
An integrated methylation and gene expression microarray analysis reveals significant prognostic biomarkers in oral squamous cell carcinoma.Oncol Rep. 2018 Nov;40(5):2637-2647. doi: 10.3892/or.2018.6702. Epub 2018 Sep 12. Oncol Rep. 2018. PMID: 30226546 Free PMC article.
-
Gene expression profile of oral squamous cell carcinomas from Sri Lankan betel quid users.Oncol Rep. 2007 Nov;18(5):1061-75. Oncol Rep. 2007. PMID: 17914555
-
Novel technologies for oral squamous carcinoma biomarkers in diagnostics and prognostics.Acta Odontol Scand. 2015 Apr;73(3):161-8. doi: 10.3109/00016357.2014.986754. Epub 2015 Jan 19. Acta Odontol Scand. 2015. PMID: 25598447 Review.
-
Recent Advances in Understanding Carcinogenicity of Oral Squamous Cell Carcinoma: From Basic Molecular Biology to Latest Genomic and Proteomic Findings.Cancer Genomics Proteomics. 2004 Jul-Aug;1(4):283-294. Epub 2004 Jul 1. Cancer Genomics Proteomics. 2004. PMID: 31394607 Review.
Cited by
-
Transcriptomic characterization of differential gene expression in oral squamous cell carcinoma: a meta-analysis of publicly available microarray data sets.Tumour Biol. 2016 Dec;37:15913–15924. doi: 10.1007/s13277-016-5439-6. Epub 2016 Oct 4. Tumour Biol. 2016. PMID: 27704359
-
Largescale Transcriptomics Analysis Suggests Over-Expression of BGH3, MMP9 and PDIA3 in Oral Squamous Cell Carcinoma.PLoS One. 2016 Jan 8;11(1):e0146530. doi: 10.1371/journal.pone.0146530. eCollection 2016. PLoS One. 2016. PMID: 26745629 Free PMC article.
-
Microbial Signatures Associated with Oropharyngeal and Oral Squamous Cell Carcinomas.Sci Rep. 2017 Jun 22;7(1):4036. doi: 10.1038/s41598-017-03466-6. Sci Rep. 2017. PMID: 28642609 Free PMC article.
-
Dysregulation of MiR-519d Affects Oral Squamous Cell Carcinoma Invasion and Metastasis by Targeting MMP3.J Cancer. 2019 Jun 2;10(12):2720-2734. doi: 10.7150/jca.31825. eCollection 2019. J Cancer. 2019. PMID: 31258780 Free PMC article.
-
Evaluation of the Expression Levels of miR-21-5p and miR-429 Genes in Biopsy Samples from Patients with Oral Squamous Cell Carcinoma.Diagnostics (Basel). 2023 Mar 25;13(7):1244. doi: 10.3390/diagnostics13071244. Diagnostics (Basel). 2023. PMID: 37046462 Free PMC article.
References
-
- Parkin DM. Global cancer statistics in the year 2000. Lancet Oncol. 2001;2:533–43. - PubMed
-
- Jemal A, Siegel R, Ward E, Hao Y, Xu J, Murray T. Cancer statistics, 2008. CA Cancer J Clin. 2008;58:71–96. - PubMed
-
- da Silva SD, Ferlito A, Takes RP, Brakenhoff RH, Valentin MD, Woolgar JA. Advances and applications of oral cancer basic research. Oral Oncol. 2011;47:783–91. - PubMed
-
- Sandler HC. Cytological screening for early mouth cancer. Cancer. 1962;15:1119–24. - PubMed
-
- Al-Sarraf M. Chemotherapeutic management of head and neck cancer. Cancer Metastasis Rev. 1987;6:181–98. - PubMed
Publication types
MeSH terms
Substances
LinkOut - more resources
Full Text Sources
Other Literature Sources
Medical