. 2014;15(12):545.
doi: 10.1186/s13059-014-0545-5.

Ontogeny of CpG island methylation and specificity of DNMT3 methyltransferases during embryonic development in the mouse

Ontogeny of CpG island methylation and specificity of DNMT3 methyltransferases during embryonic development in the mouse

Ghislain Auclair et al. Genome Biol. 2014.

Abstract

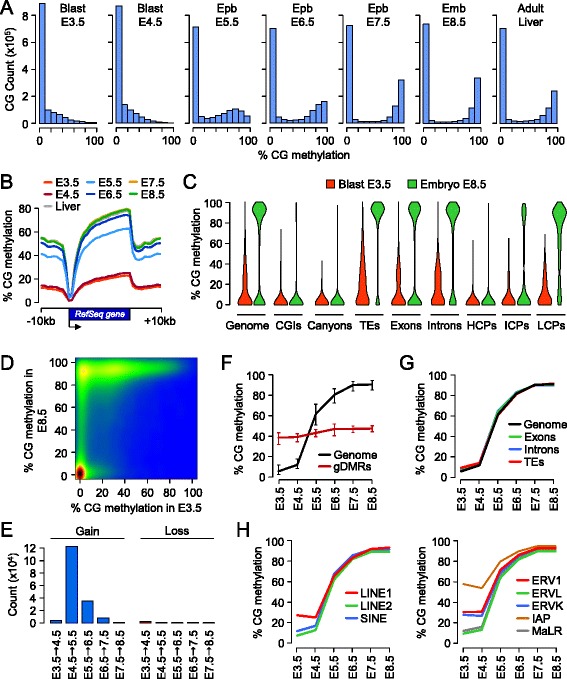
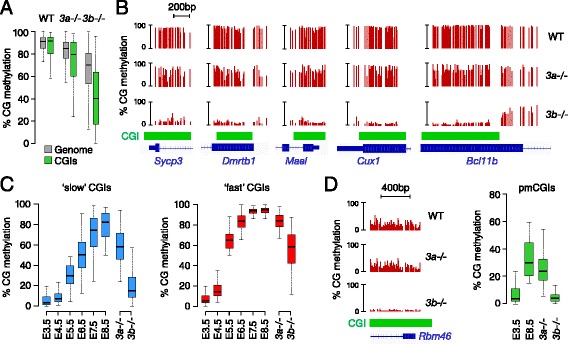
Background: In the mouse, the patterns of DNA methylation are established during early embryonic development in the epiblast. We quantified the targets and kinetics of DNA methylation acquisition in epiblast cells, and determined the contribution of the de novo methyltransferases DNMT3A and DNMT3B to this process.

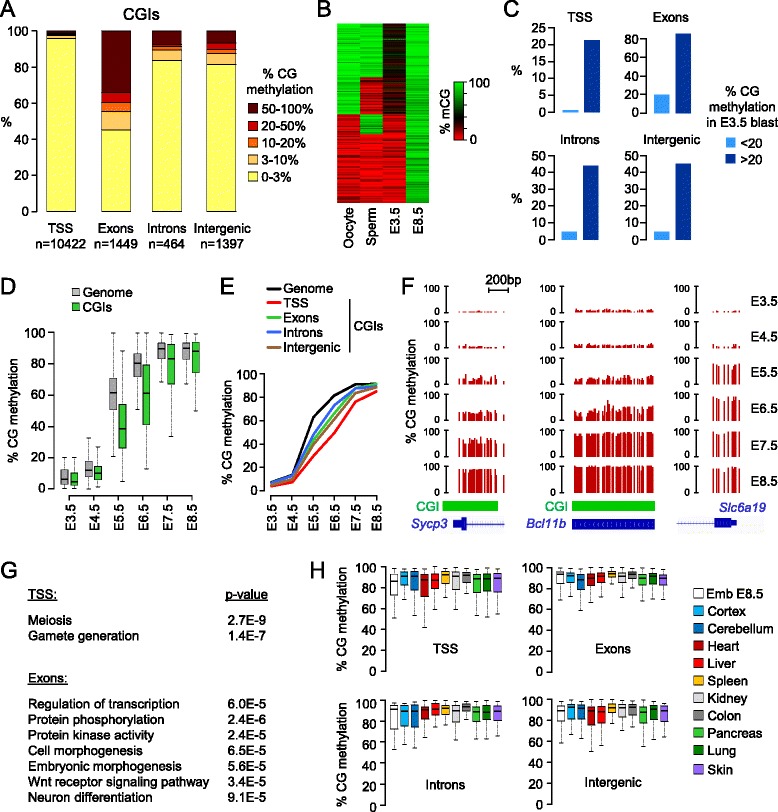
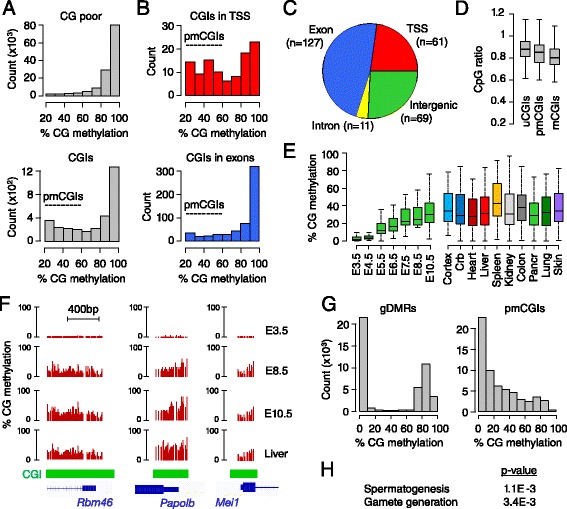
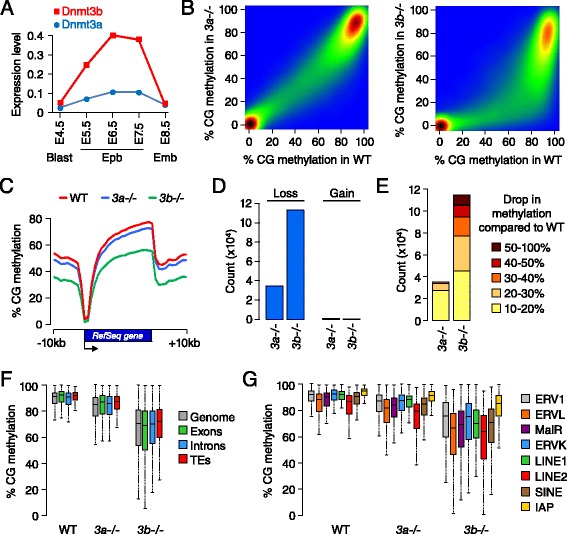
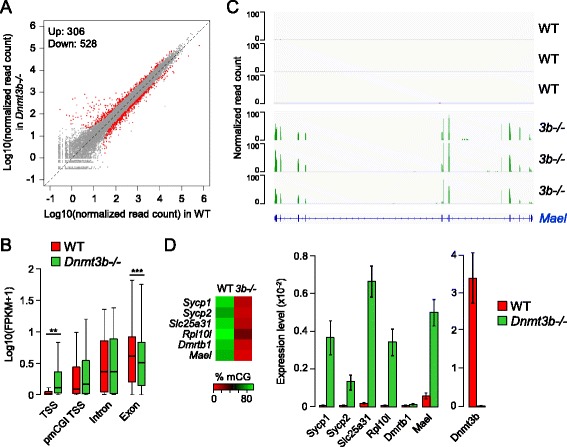
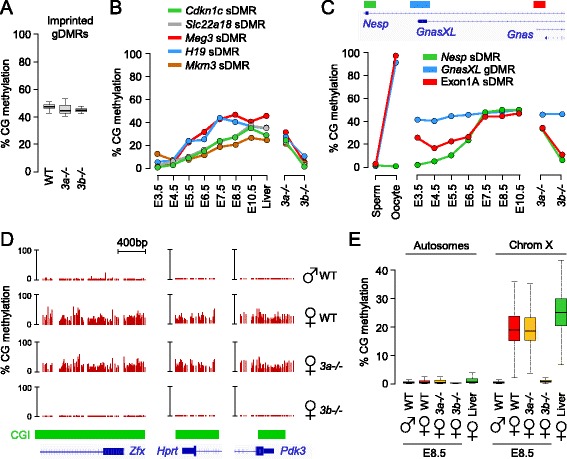
Results: We generated single-base maps of DNA methylation from the blastocyst to post-implantation stages and in embryos lacking DNMT3A or DNMT3B activity. DNA methylation is established within two days of implantation between embryonic days 4.5 and 6.5. The kinetics of de novo methylation are uniform throughout the genome, suggesting a random mechanism of deposition. In contrast, many CpG islands acquire methylation slowly in late epiblast cells. Five percent of CpG islands gain methylation and are found in the promoters of germline genes and in exons of important developmental genes. The onset of global methylation correlates with the upregulation of Dnmt3a/b genes in the early epiblast. DNMT3A and DNMT3B act redundantly to methylate the bulk genome and repetitive elements, whereas DNMT3B has a prominent role in the methylation of CpG islands on autosomes and the X chromosome. Reduced CpG island methylation in Dnmt3b-deficient embryos correlates with gene reactivation in promoters but reduced transcript abundance in gene bodies. Finally, DNMT3B establishes secondary methylation marks at imprinted loci, which distinguishes bona fide germline from somatic methylation imprints.

Conclusions: We reveal that the DNMT3 de novo methyltransferases play both redundant and specific functions in the establishment of DNA methylation in the mouse embryo.


Figures

Figure 1
Figure 1
Acquisition of CpG methylation occurs at implantation in mouse embryos. (A) Density histograms showing the distribution of methylation levels measured at individual CpGs throughout embryonic development. Blast, blastocyst; Epb, epiblast; Emb, embryo. (B) Distribution on CpG methylation in RefSeq genes and 10 kb of flanking sequences throughout embryonic development. For each protein-coding RefSeq gene (excluding the X and Y chromosomes), we calculated methylation in 20 equal-sized windows within the gene and 10 1-kb windows of flanking sequences. (C) Violin plots showing the acquisition of CpG methylation in post-implantation embryos compared with blastocysts in various genome elements. TEs, transposable elements; HCPs, high CpG promoters; ICPs, intermediate CpG promoters; LCPs, low CpG promoters. (D) Pairwise comparison of CpG methylation (measured in 400 bp tiles) in E3.5 blastocysts and E8.5 post-implantation embryos. The density of points increases from blue to dark red. (E) Number of 400 bp tiles that gain or lose more than 20% CpG methylation at each developmental transition. (F) Kinetics of de novo DNA methylation in development. We selected all the genomic tiles (400 bp) that gain methylation in post-implantation embryos (defined as <20% methylation in E3.5 blastocysts and >50% methylation in E8.5 embryos) and then plotted their methylation as a function of the developmental stage (black line). The red line shows the methylation for 17 imprinted germline DMRs. The lines represent the median methylation and the error bars represent the 25th and 75th percentiles. (G) Kinetics of de novo DNA methylation in exons, introns and transposable elements (TEs). (H) Kinetics of de novo DNA methylation in classes of transposable elements. LINE, long interspersed nuclear element; SINE, short interspersed nuclear element. In (G,H), the lines depict the median methylation measured at each developmental stage.
Figure 2
Figure 2
Targets and kinetics of CpG island methylation in epiblast cells. (A) Distribution of E8.5 methylation scores in UCSC CGIs located in promoters (-1,000 to 1,000 bp from RefSeq transcription start sites (TSSs)), exons, introns and intergenic sequences. X-linked CGIs are excluded from this analysis. (B) Heatmap showing the methylation in gametes and blastocysts for all the CGIs methylated (>50%) in E8.5 embryos. Approximately half of the CGIs inherit partial methylation from the oocyte. (C) Percentage of CGIs that gain >50% methylation in E8.5 embryos depending on their methylation in blastocysts. CGIs with oocyte-derived methylation in blastocysts have a much higher probability to gain methylation in post-implantation embryos. (D) Kinetics of de novo methylation in CGIs compared with the genome (measured in 400 bp genomic tiles). The graph depicts de novo methylated sequences defined as <20% methylation in E3.5 blastocysts and >50% methylation in E8.5 embryos. (E) Kinetics of de novo methylation for CGIs in TSSs, exons, introns and intergenic sequences (selected as <20% methylation in E3.5 blastocysts and >50% methylation in E8.5 embryos) compared with the whole genome (black line). The lines depict the median methylation at each stage. (F) Examples of single-CpG RRBS profiles at CGIs with delayed DNA methylation in the promoter of Sycp3 and one exon of Blc11b (chr12:107,915,284-107,917,294). Here and in other figures, the green bars depict the position of the CGI. In comparison, the CpG-poor promoter of the Slc6a19 gene gains methylation between E4.5 and E5.5. (G) Gene Ontology terms associated with methylated CGIs (>50% methylation in E8.5 embryos) in TSSs and exons. (H) Distribution of methylation in adult tissues [3] for CGIs with >50% methylation in E8.5 embryos.
Figure 3
Figure 3
A class of CpG islands gains partial methylation during development. (A) Density histograms showing the distribution of methylation in E8.5 embryos in genomic tiles (400 bp) covering CpG-poor regions and CGIs, which reveals a high prevalence of partially methylated CGIs (pmCGIs). (B) Frequency of pmCGIs in CGIs covering TSSs and exons. (C) Distribution of pmCGIs in TSSs, exons, introns and intergenic regions. (D) Comparison of the distribution of CpG ratios in unmethylated (u; <10% methylation in E8.5 embryos), partially methylated (pm; >15% and <60% methylation) and methylated (m; >60% methylation) CGIs. (E) Dynamics of DNA methylation at TSS-proximal pmCGIs (defined as >15% and <60% methylation in E8.5 embryos) across embryonic development and in adult tissues. Crb, cerebellum; Pancr, pancreas. (F) Examples of RRBS methylation scores at three TSS-associated pmCGIs in blastocysts (E3.5), post-implantation embryos (E8.5 and E10.5) and adult liver. (G) Distribution of RRBS single-allele methylation scores from E8.5 embryos in TSS-proximal pmCGIs compared with imprinted gDMRs. (H) Gene Ontology terms associated with TSS-proximal pmCGIs.
Figure 4
Figure 4
Methylome profiling in DNMT3A and DNMT3B-deficient embryos. (A) mRNA expression of Dnmt3a/b genes in embryos. Expression was measured by RT-qPCR on 5 to 10 pooled embryos and is depicted as a ratio relative to the expression of two housekeeping genes (Actb and Rpl13a). The primers used for RT-qPCR were designed in the last exons to amplify all isoforms. Blast, blastocyst; Epb, epiblast; Emb, embryo. (B) Pairwise comparison of CpG methylation in 400 bp tiles in wild-type (WT) compared with Dnmt3a-/- and Dnmt3b-/- E8.5 embryos. (C) Distribution of CpG methylation in RefSeq genes and 10 kb of flanking sequences in WT, Dnmt3a-/- or Dnmt3b-/- E8.5 embryos. (D) Number of 400 bp tiles that lose or gain more than 10% methylation in Dnmt3a-/- and Dnmt3b-/- compared with WT E8.5 embryos. (E) Detailed representation of the extent of methylation loss detected in 400 bp tiles in Dnmt3a-/- and Dnmt3b-/- compared with WT E8.5 embryos. (F) Boxplot representing the distribution of CpG methylation in the whole genome (400 bp tiles), exons, introns and transposable elements (TEs) in WT, Dnmt3a-/- and Dnmt3b-/- E8.5 embryos. Only sequences with >50% methylation in WT E8.5 embryos are considered. (G) Distribution of CpG methylation in several families of transposable elements in WT, Dnmt3a-/- and Dnmt3b-/- E8.5 embryos. IAP, intracisternal A-particle; LINE, long interspersed nuclear element; SINE, short interspersed nuclear element.
Figure 5
Figure 5
DNMT3B methylates CpG islands in epiblast cells. (A) Boxplot showing the distribution of CpG methylation in the whole genome (400 bp tiles) and CGIs in WT, Dnmt3a-/- and Dnmt3b-/- E8.5 embryos. Only sequences with >50% methylation in WT E8.5 embryos are considered. (B) Representative examples of RRBS profiles at DNMT3B-dependent CGIs in WT, Dnmt3a-/- and Dnmt3b-/- E8.5 embryos in gene promoters (Sycp3, Dmrtb1, Mael) and gene bodies (Cux1, chr5:136,274,862-136,275,397; Bcl11b, chr12:107,915,284-107,917,294). (C) Dynamics of DNA methylation across embryonic development and in Dnmt3-mutant E8.5 embryos in slow (<20% methylation in E3.5, <50% in E5.5 and >50% in E8.5) and fast (<20% methylation in E3.5, >50% methylation in E5.5 and >50% methylation in E8.5) CGIs. (D) DNMT3B methylates pmCGIs, as illustrated by the RRBS profiles in E8.5 embryos at the Rbm46 CGI. The box plot shows the distribution of methylation at all pmCGIs in blastocysts (E3.5), WT E8.5 embryos and Dnmt3-mutant E8.5 embryos.
Figure 6
Figure 6
Transcriptome of Dnmt3b-/- embryos. (A) Scatter plot of normalized read counts per gene (average of three replicates) calculated by DESeq2 in WT and Dnmt3b-/- E8.5 embryos. The red dots represent the genes called differentially expressed with a false discovery rate-adjusted P-value <0.05 and fold change >2. The numbers of genes upregulated and downregulated are indicated. (B) Consequences of reduced CGI methylation on gene expression. The boxplot shows Fragments Per Kilobase of exon per Million fragments mapped (FPKM) scores for genes with reduced methylation (>50% decrease of methylation in Dnmt3b-/- compared with WT embryos) of a CGI covering a TSS, exon or intron, as well as genes with a pmCGI in the TSS. **P < 0.01, ***P < 0.001 (Wilcoxon test). (C) RNA-Seq read coverage at the germline-specific gene Mael in three WT and Dnmt3b-/- embryos. (D) RT-qPCR validation of the upregulation of germline genes in Dnmt3b-/- E8.5 embryos. The heatmap on the left depicts the extent of TSS CGI hypomethylation in Dnmt3b-/- embryos. Gene expression is depicted in the bar graphs as a ratio relative to the expression of two housekeeping genes (Actb and Rpl13a). The error bars represent mean deviations from measurements in independent embryos (n = 3). As a control we show the expression of Dnmt3b measured with primers that amplify within the Cre-deleted catalytic exons.
Figure 7
Figure 7
Role of DNMT3B at imprinted differentially methylated regions and X-linked CpG islands in embryos. (A) Box-plot representing the methylation of 17 imprinted germline DMRs in WT, Dnmt3a-/- and Dnmt3b-/- E8.5 embryos. (B) Dynamics of methylation throughout development and in Dnmt3 knockout E8.5 embryos at somatic DMRs: Cdkn1c (chr7:143,459,734-143,460,383), Slc22a18 (chr7:143,465,018-143,465,543), Meg3 (chr12:109,540,809-109,541,073), H19 (chr7:142,578,145-142,578,462) and Mkrn3 (chr7:62,419,498-62,420,497). (C) Dynamics of methylation throughout development and in Dnmt3 knockout E8.5 embryos at the three DMRs of the Gnas locus. The genomic organization of the locus and the position of the DMRs are shown on top of the graph. The detailed RRBS profiles are shown in Figure S9B in Additional file 1. (D) Examples of RRBS profiles at CGI promoters of three X-inactivated genes in female WT and Dnmt3-mutant embryos at the E8.5 stage. (E) Box plots of the global distribution of CGI methylation in autosomes (left) and on the X chromosome (right) in WT E8.5 embryos, female Dnmt3-mutant embryos and female adult liver.

References

    1. Stadler MB, Murr R, Burger L, Ivanek R, Lienert F, Scholer A, Wirbelauer C, Oakeley EJ, Gaidatzis D, Tiwari VK, Schubeler D. DNA-binding factors shape the mouse methylome at distal regulatory regions. Nature. 2011;480:490–495. - PubMed
    1. Weber M, Hellmann I, Stadler MB, Ramos L, Paabo S, Rebhan M, Schubeler D. Distribution, silencing potential and evolutionary impact of promoter DNA methylation in the human genome. Nat Genet. 2007;39:457–466. doi: 10.1038/ng1990. - DOI - PubMed
    1. Hon GC, Rajagopal N, Shen Y, McCleary DF, Yue F, Dang MD, Ren B. Epigenetic memory at embryonic enhancers identified in DNA methylation maps from adult mouse tissues. Nat Genet. 2013;45:1198–1206. doi: 10.1038/ng.2746. - DOI - PMC - PubMed
    1. Kobayashi H, Sakurai T, Imai M, Takahashi N, Fukuda A, Yayoi O, Sato S, Nakabayashi K, Hata K, Sotomaru Y, Suzuki Y, Kono T. Contribution of intragenic DNA methylation in mouse gametic DNA methylomes to establish oocyte-specific heritable marks. PLoS Genet. 2012;8:e1002440. doi: 10.1371/journal.pgen.1002440. - DOI - PMC - PubMed
    1. Smallwood SA, Tomizawa S, Krueger F, Ruf N, Carli N, Segonds-Pichon A, Sato S, Hata K, Andrews SR, Kelsey G. Dynamic CpG island methylation landscape in oocytes and preimplantation embryos. Nat Genet. 2011;43:811–814. doi: 10.1038/ng.864. - DOI - PMC - PubMed

Publication types

Substances

Associated data