. 2014;15(12):546.
doi: 10.1186/s13059-014-0546-4.

Organization and evolution of transposable elements along the bread wheat chromosome 3B

Organization and evolution of transposable elements along the bread wheat chromosome 3B

Josquin Daron et al. Genome Biol. 2014.

Abstract

Background: The 17 Gb bread wheat genome has massively expanded through the proliferation of transposable elements (TEs) and two recent rounds of polyploidization. The assembly of a 774 Mb reference sequence of wheat chromosome 3B provided us with the opportunity to explore the impact of TEs on the complex wheat genome structure and evolution at a resolution and scale not reached so far.

Results: We develop an automated workflow, CLARI-TE, for TE modeling in complex genomes. We delineate precisely 56,488 intact and 196,391 fragmented TEs along the 3B pseudomolecule, accounting for 85% of the sequence, and reconstruct 30,199 nested insertions. TEs have been mostly silent for the last one million years, and the 3B chromosome has been shaped by a succession of bursts that occurred between 1 to 3 million years ago. Accelerated TE elimination in the high-recombination distal regions is a driving force towards chromosome partitioning. CACTAs overrepresented in the high-recombination distal regions are significantly associated with recently duplicated genes. In addition, we identify 140 CACTA-mediated gene capture events with 17 genes potentially created by exon shuffling and show that 19 captured genes are transcribed and under selection pressure, suggesting the important role of CACTAs in the recent wheat adaptation.

Conclusion: Accurate TE modeling uncovers the dynamics of TEs in a highly complex and polyploid genome. It provides novel insights into chromosome partitioning and highlights the role of CACTA transposons in the high level of gene duplication in wheat.


Figures
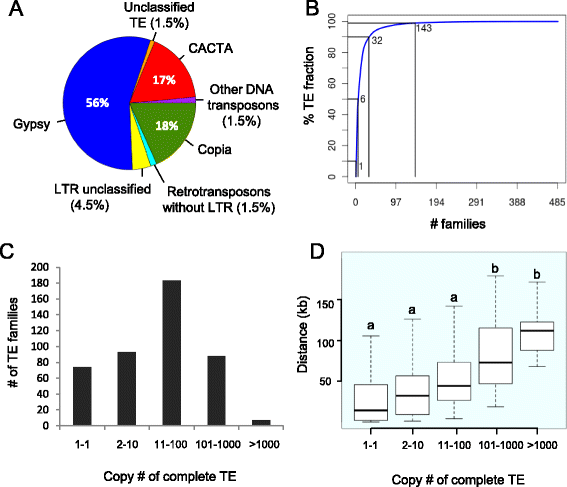
Figure 1
Figure 1
Transposable element content and copy number of the wheat chromosome 3B sequence. (A) Pie graph of the relative composition of the main TE superfamilies. (B) Cumulative sum of the number of TEs families among the TE fraction. The N50 is 6, meaning that six TE families represent 50% of the TE fraction (in number of nucleotides). (C) Distribution of the number of copies per family (considering complete copies only). (D) Box plot of the distance (in kilobases) of TEs to the closest gene. The five categories represent TE families with different numbers of copies on the 3B chromosome.
Figure 2
Figure 2
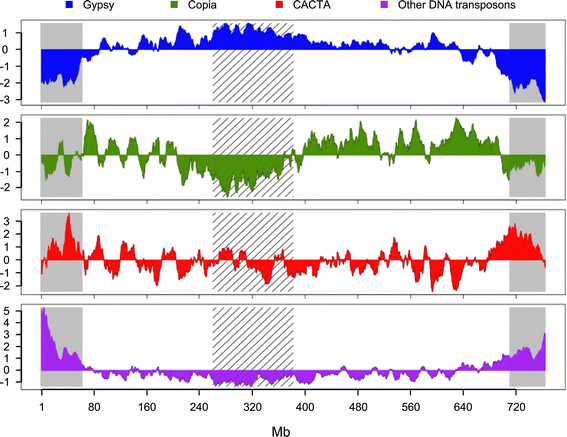
Distribution of variations of transposable element density along wheat chromosome 3B. Distributions are represented for four superfamilies: gypsy (blue), copia (green), CACTA (red), and other DNA transposons (purple). The distributions were calculated in a sliding window of 10 Mb with a step of 1 Mb and the graphs represent the standard score, that is, variations around the mean in number of standard deviations. Recombinogenic distal and centromeric/pericentromeric regions [42] are labeled by grey and hatched areas, respectively.
Figure 3
Figure 3
Insertion date and period of amplification of LTR-RTs on wheat chromosome 3B. (A) Distribution of the insertion dates for 5,554 complete copies of the RLG_famc1 (Fatima) family. The number of copies is highlighted in green (top), the peak of amplification is in red (middle), and the period of activity is in blue (bottom). (B) Distribution of the frequency of the copy number, insertion dates, and period of activity using 43 LTR-RT families with at least 20 copies.
Figure 4
Figure 4
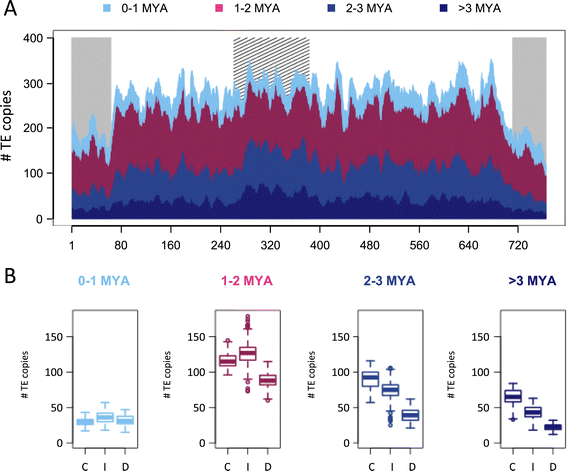
Relationships between insertion dates and chromosomal locations of LTR-RTs. In total, 21,165 LTR-RTs with an estimated insertion date have been grouped within four classes: 0 to 1 MYA (blue), 1 to 2 MYA (purple), 2 to 3 MYA (green), >3 MYA (red). (A) Distribution of the number of LTR-RTs for each of these four categories along chromosome 3B. Distribution was calculated in a sliding window of 10 Mb with a step of 1 Mb. Recombinogenic distal and centromeric/pericentromeric regions [42] are labeled by grey and hatched areas, respectively. (B) Box plot of the number of TEs per 10 Mb sliding window carried by the recombinogenic distal regions (D), the internal parts of the chromosome arms (I), and the centromeric/pericentromeric regions (C).
Figure 5
Figure 5
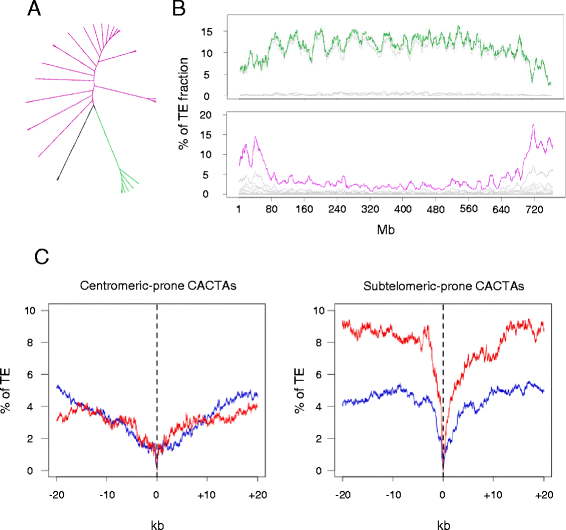
Relationships between CACTA families and nonsyntenic genes. (A) Tree based on the clustering of the distribution patterns of 30 CACTA families found along the 3B chromosome. The branches represented in purple and green correspond to subtelomeric-prone CACTA families and centromeric-prone CACTA families, respectively. (B) Distribution of the 6 centromeric-prone CACTA families (top) and 22 subtelomeric-prone CACTA families (bottom) showing opposite patterns along the 3B chromosome sequence. The gray curves represent the distribution of individual families and the top purple or green curves represent the cumulative sum of all families. (C) Abundance of centromeric-prone (left panel) and subtelomeric-prone (right panel) CACTAs in the vicinity (±20 kb) of syntenic (blue) and non-syntenic genes (red), respectively. 0 represents the position of the coding sequences (start and stop codons) and the average abundance of CACTAs was calculated for each nucleotide in a -20/+20 kb window encompassing the coding sequences.
Figure 6
Figure 6
Selection pressure estimated by the dN/dS ratio for CACTA-captured genes. Distribution of the frequency of the dN/dS ratio for 2,964 syntenic genes (blue), 1,179 nonsyntenic genes (red) and 127 CACTA-captured genes on chromosome 3B (green).

Similar articles

Cited by

References

    1. McClintock B. The origin and behavior of mutable loci in maize. Proc Natl Acad Sci U S A. 1950;36:344–355. doi: 10.1073/pnas.36.6.344. - DOI - PMC - PubMed
    1. Feschotte C, Jiang N, Wessler SR. Plant transposable elements: where genetics meets genomics. Nat Rev Genet. 2002;3:329–341. doi: 10.1038/nrg793. - DOI - PubMed
    1. Arabidopsis GI. Analysis of the genome sequence of the flowering plant Arabidopsis thaliana. Nature. 2000;408:796. doi: 10.1038/35048692. - DOI - PubMed
    1. Schnable PS, Ware D, Fulton RS, Stein JC, Wei F, Pasternak S, Liang C, Zhang J, Fulton L, Graves TA. The B73 maize genome: complexity, diversity, and dynamics. Science. 2009;326:1112–1115. doi: 10.1126/science.1178534. - DOI - PubMed
    1. Devos KM. Grass genome organization and evolution. Curr Opin Plant Biol. 2010;13:139–145. doi: 10.1016/j.pbi.2009.12.005. - DOI - PubMed

Publication types

Substances

LinkOut - more resources