

A Bayesian spatio-temporal approach for real-time detection of disease outbreaks: a case study
- PMID: 25476843
- PMCID: PMC4267748
- DOI: 10.1186/s12911-014-0108-4
A Bayesian spatio-temporal approach for real-time detection of disease outbreaks: a case study
Abstract
Background: For researchers and public health agencies, the complexity of high-dimensional spatio-temporal data in surveillance for large reporting networks presents numerous challenges, which include low signal-to-noise ratios, spatial and temporal dependencies, and the need to characterize uncertainties. Central to the problem in the context of disease outbreaks is a decision structure that requires trading off false positives for delayed detections.
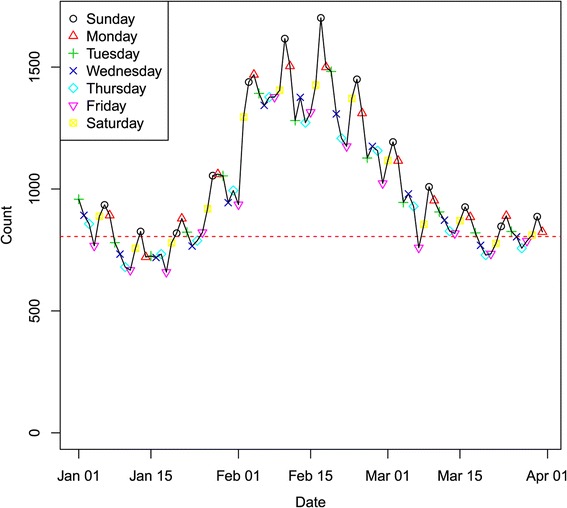
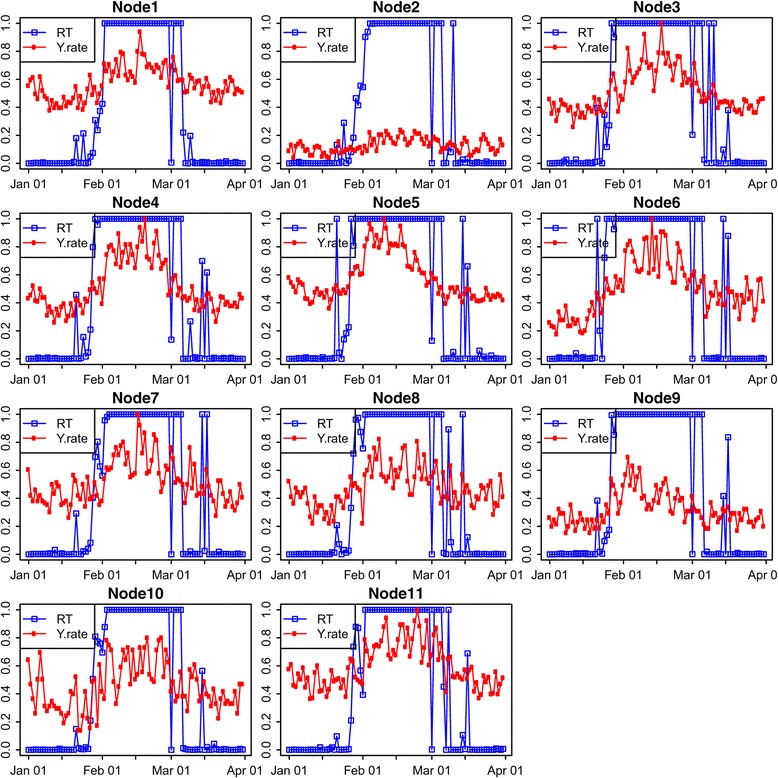
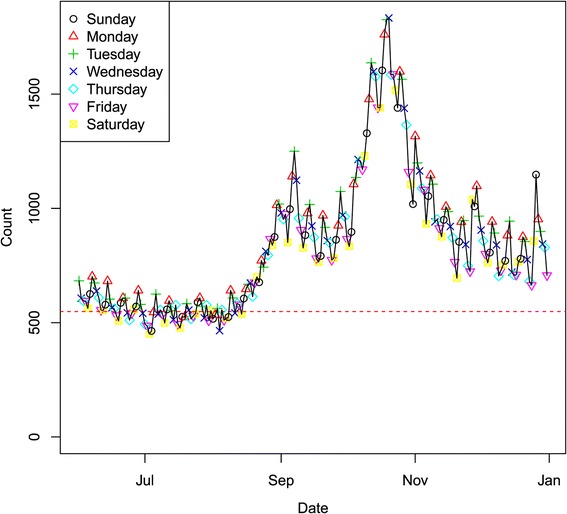
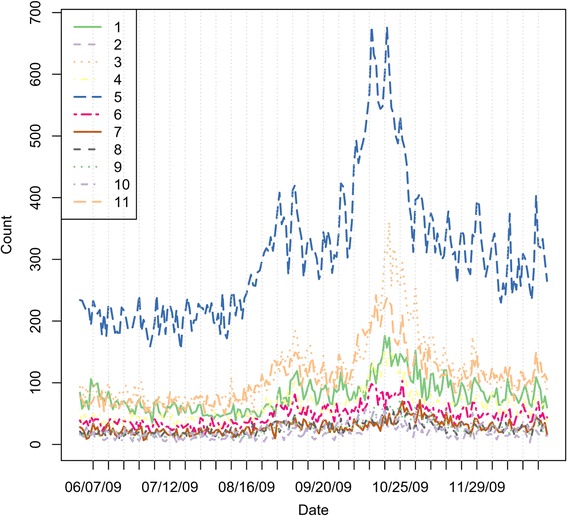
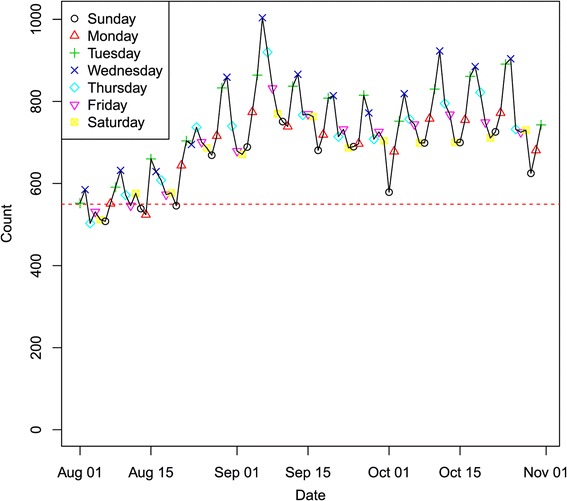
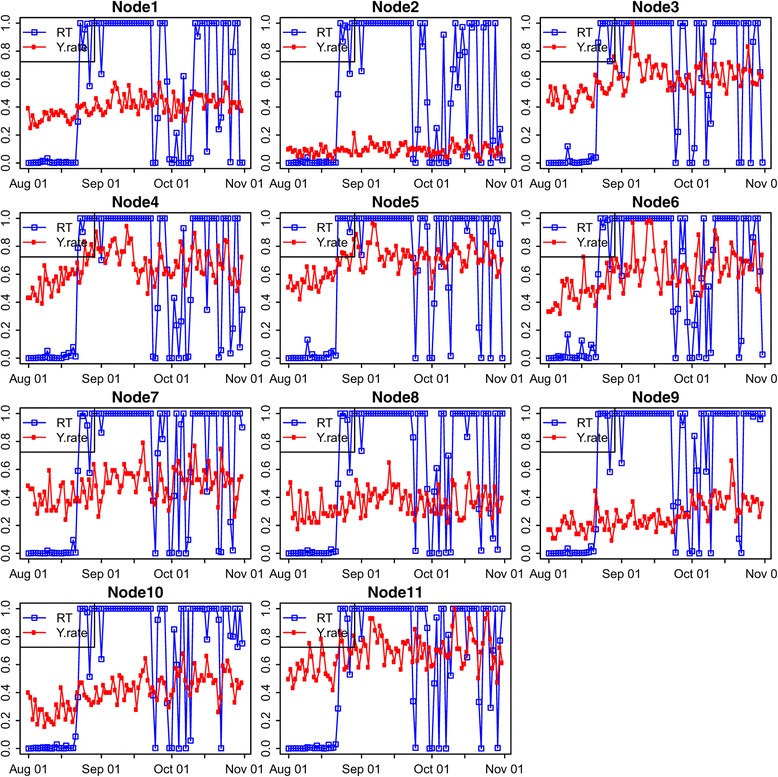
Methods: In this paper we apply a previously developed Bayesian hierarchical model to a data set from the Indiana Public Health Emergency Surveillance System (PHESS) containing three years of emergency department visits for influenza-like illness and respiratory illness. Among issues requiring attention were selection of the underlying network (Too few nodes attenuate important structure, while too many nodes impose barriers to both modeling and computation.); ensuring that confidentiality protections in the data do not impede important modeling day of week effects; and evaluating the performance of the model.
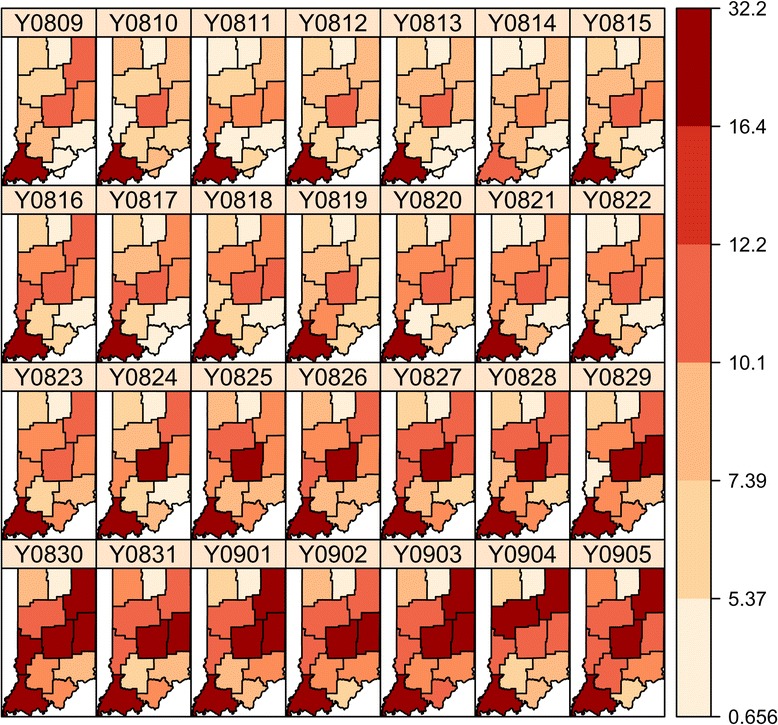
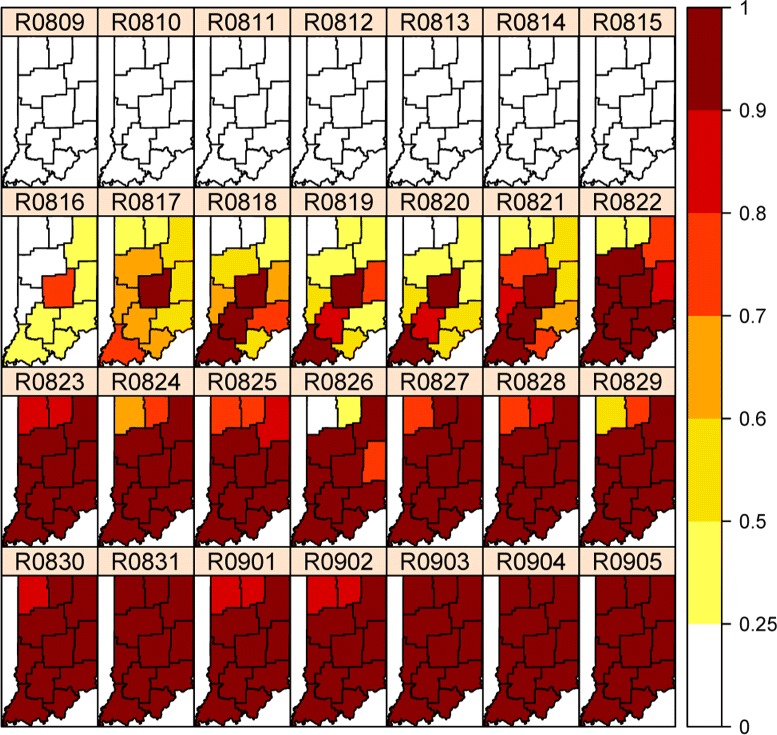
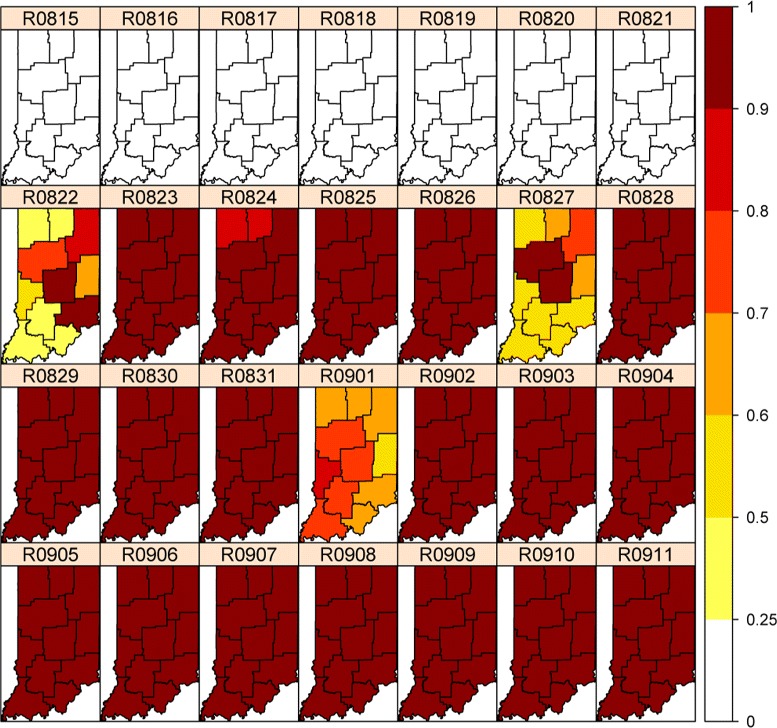
Results: Our results show that the model captures salient spatio-temporal dynamics that are present in public health surveillance data sets, and that it appears to detect both "annual" and "atypical" outbreaks in a timely, accurate manner. We present maps that help make model output accessible and comprehensible to public health authorities. We use an illustrative family of decision rules to show how output from the model can be used to inform false positive-delayed detection tradeoffs.
Conclusions: The advantages of our methodology for addressing the complicated issues of real world surveillance data applications are three-fold. We can easily incorporate additional covariate information and spatio-temporal dynamics in the data. Second, we furnish a unified framework to provide uncertainties associated with each parameter. Third, we are able to handle multiplicity issues by using a Bayesian approach. The urgent need to quickly and effectively monitor the health of the public makes our methodology a potentially plausible and useful surveillance approach for health professionals.
Figures


References
-
- Page ES. Continuous inspection schemes. Biometrika. 1954;41:100–115. doi: 10.1093/biomet/41.1-2.100. - DOI
-
- Ogden RT, Lynch J. Bayesian analysis of change point models. In: Müller P, Vidakovic B, editors. Bayesian inference in Wavelet‐Based Models. New York: Springer‐Verlag; 1999. pp. 67–82.
Publication types
MeSH terms
LinkOut - more resources
Full Text Sources
Other Literature Sources
Medical
