. 2014 Dec 4;5(12):e1558.
doi: 10.1038/cddis.2014.512.

DNA methylation and differential gene regulation in photoreceptor cell death

Affiliations

DNA methylation and differential gene regulation in photoreceptor cell death

P Farinelli et al. Cell Death Dis. .

Abstract

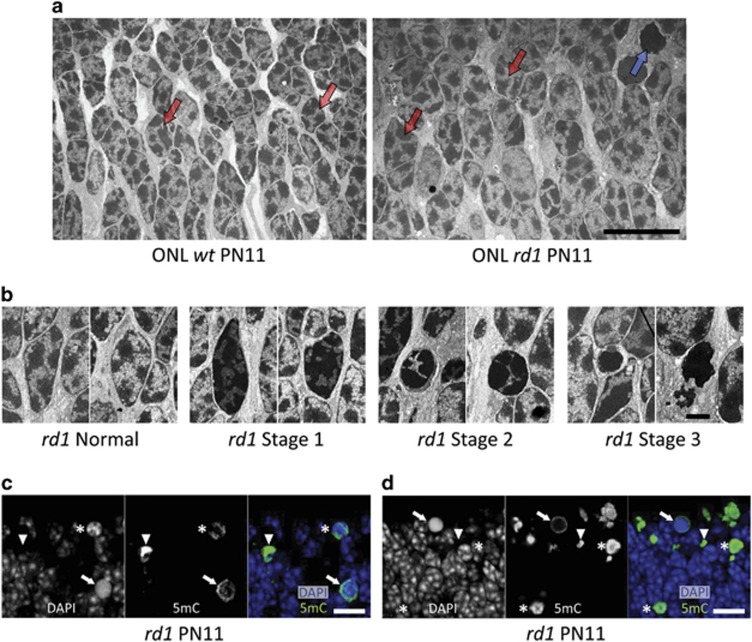
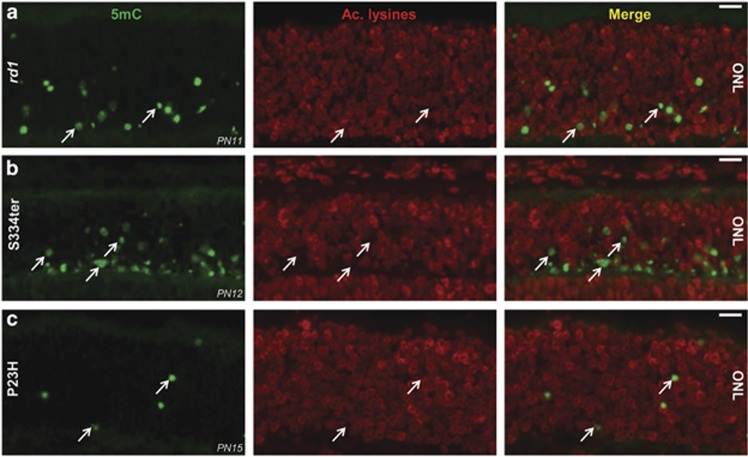
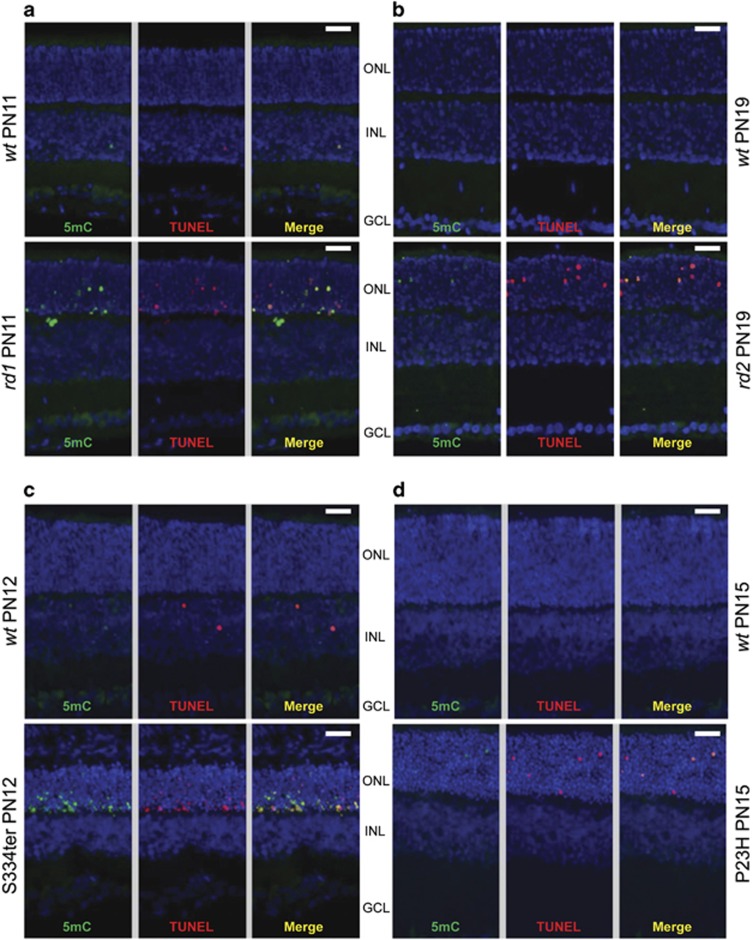
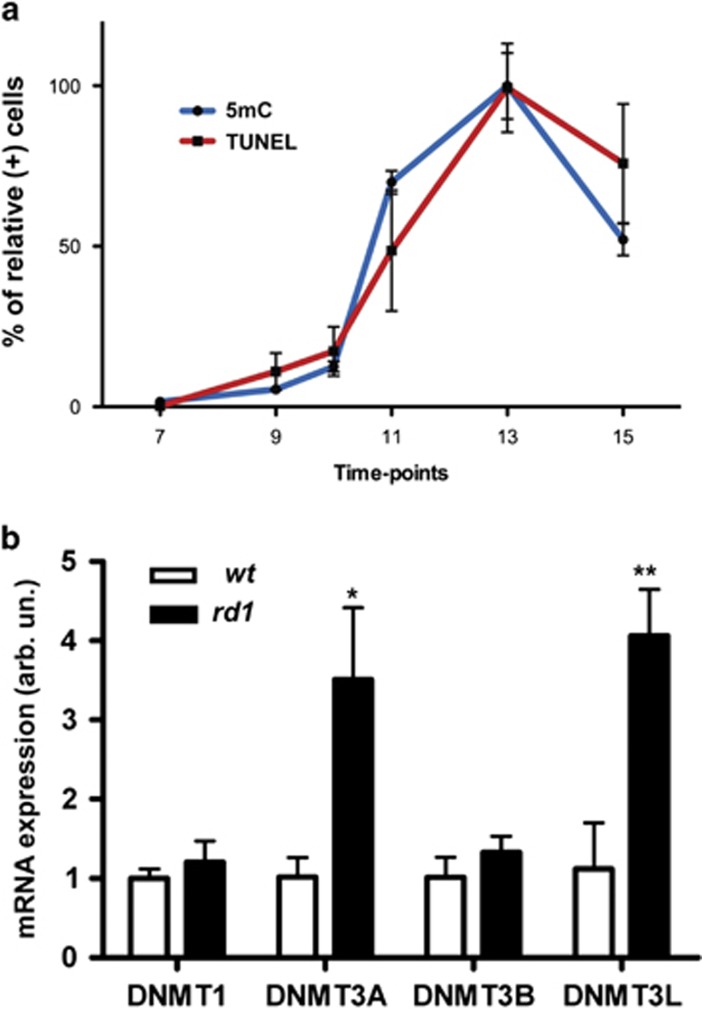
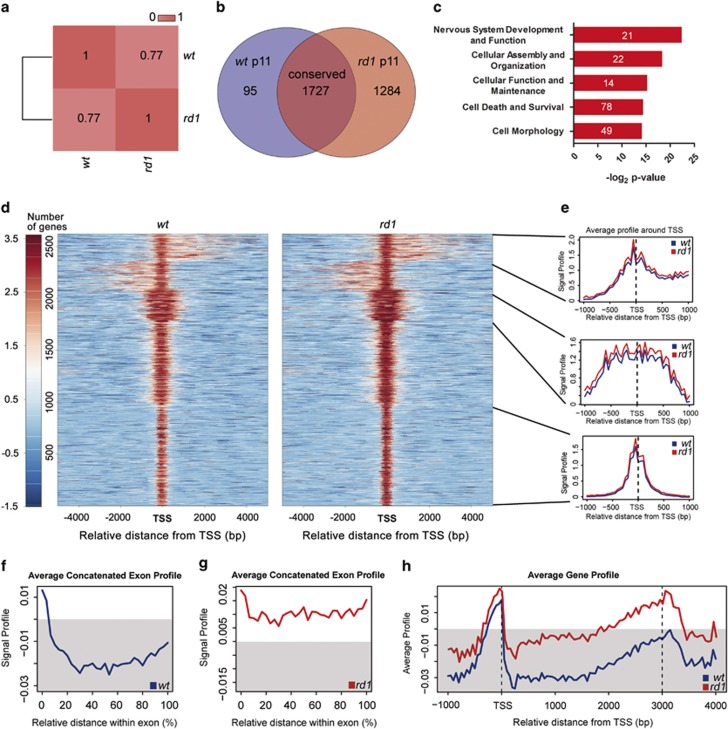
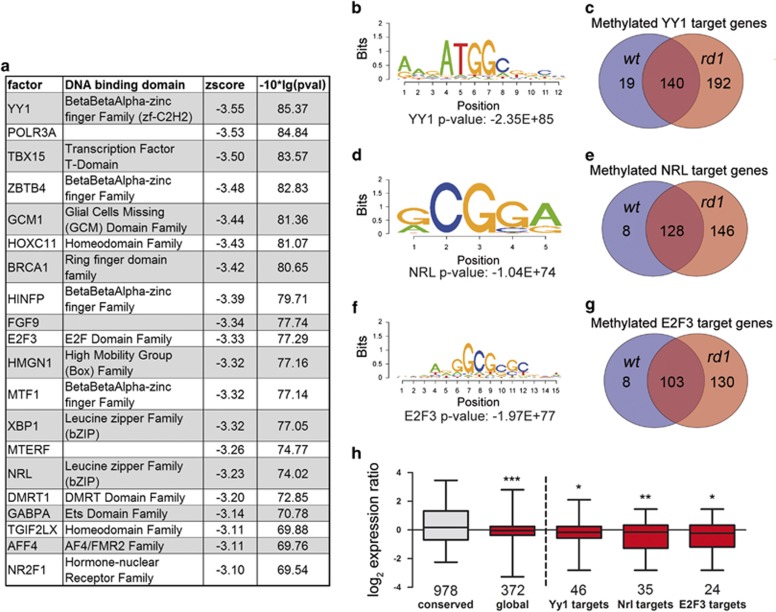
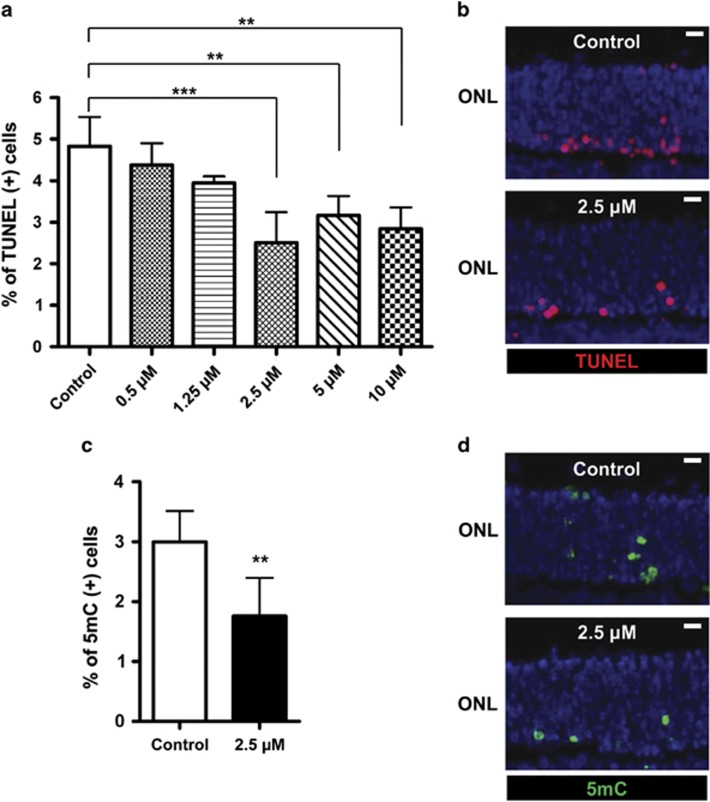
Retinitis pigmentosa (RP) defines a group of inherited degenerative retinal diseases causing progressive loss of photoreceptors. To this day, RP is still untreatable and rational treatment development will require a thorough understanding of the underlying cell death mechanisms. Methylation of the DNA base cytosine by DNA methyltransferases (DNMTs) is an important epigenetic factor regulating gene expression, cell differentiation, cell death, and survival. Previous studies suggested an involvement of epigenetic mechanisms in RP, and in this study, increased cytosine methylation was detected in dying photoreceptors in the rd1, rd2, P23H, and S334ter rodent models for RP. Ultrastructural analysis of photoreceptor nuclear morphology in the rd1 mouse model for RP revealed a severely altered chromatin structure during retinal degeneration that coincided with an increased expression of the DNMT isozyme DNMT3a. To identify disease-specific differentially methylated DNA regions (DMRs) on a genomic level, we immunoprecipitated methylated DNA fragments and subsequently analyzed them with a targeted microarray. Genome-wide comparison of DMRs between rd1 and wild-type retina revealed hypermethylation of genes involved in cell death and survival as well as cell morphology and nervous system development. When correlating DMRs with gene expression data, we found that hypermethylation occurred alongside transcriptional repression. Consistently, motif analysis showed that binding sites of several important transcription factors for retinal physiology were hypermethylated in the mutant model, which also correlated with transcriptional silencing of their respective target genes. Finally, inhibition of DNMTs in rd1 organotypic retinal explants using decitabine resulted in a substantial reduction of photoreceptor cell death, suggesting inhibition of DNA methylation as a potential novel treatment in RP.


Figures

Figure 1
Figure 1
Altered rd1 nuclear ultrastructure and DNA methylation. (a) The overview of PN11 wt and rd1 ONL illustrates the mixed distribution of heterochromatin and euchromatin (dark and light areas, respectively) in both wt and (most) rd1 photoreceptor nuclei. Typical examples of such nuclei are pointed out by red arrows. By contrast, rd1 photoreceptor nuclear configurations varied considerably from ‘normal' (=similar to wt nuclei), via the different stages 1 and 2, to very condensed, electron dense and dark, that is, stage 3 (blue arrow in rd1 picture). These stages are shown in more detail in panel (b). (c and d) In rd1 PN11 retina, immunostaining for 5mC (green), together with a nuclear counterstain (4,6-diamidino-2-phenylindole (DAPI), blue), showed varying degrees of co-localization. 5mC-positive structures had a DAPI appearance that was either heterogeneous rounded (*), or homogenous rounded (arrows), or weak to the point of being absent (arrowheads), most likely reflecting the different stages of nuclear condensation identified in panel (a). The confocal images in c and d are maximum projections of 16 and 21 Z-sections, respectively. Scale bars: a, c, and d=10 μm, b=2 μm
Figure 2
Figure 2
DNA methylation colocalizes with protein deacetylation. Loss of lysine acetylation can mark HDAC activation (Sancho-Pelluz et al.). Stainings for 5mC and lysine acetylation (Ac. lysines) were here combined, which resulted in that 5mC staining often occurred in nuclei where acetylated lysines were very low or absent, suggesting an interplay between HDAC and DNMT activities. This was seen in (a) rd1 mouse, as well as in (b) S334ter and (c) P23H rat retinae. ONL: the individual figures are oriented such that this layer is up and inner retinal layers are down. Scale bar=20 μm. The results are representative for observations made in at least three different individuals of each genotype
Figure 3
Figure 3
DNA methylation colocalizes with cell death in four different RP animal models. An immunostaining for 5mC was performed together with the TUNEL assay for dying cells in four animal models for RP. In these models, co-staining was performed at time points corresponding to the onset or peak of retinal degeneration. In (a) PN11 rd1 and (b) PN19 rd2 mouse retina, as well as in (c) PN12 S334ter and (d) PN19 P23H rat retina, the numbers of 5mC immunodecorated photoreceptors was increased when compared with wt controls and most of the 5mC-positive cells were co-labeled with the TUNEL assay. GCL=ganglion cell layer; INL=inner nuclear layer. Scale bar=20 μm. The results are representative for observations made in at least three different individuals of each genotype
Figure 4
Figure 4
Temporal dynamics of DNA methylation and DNMT gene expression. (a) In rd1 ONL, at early PN ages, the numbers of photoreceptors showing 5mC staining were very low, increased from PN11 onwards, and peaked at PN13. The temporal progression of 5mC positivity in rd1 ONL corresponded largely to the extent of cell death as evidenced by TUNEL staining, implying a close connection between DNA methylation and cell death. (b) Quantitative reverse transcriptase–PCR analysis of different DNMT mRNAs showed a statistically significant upregulation of DNMT3A and DNMT3L expression in rd1 retina. Data points in panel (a) represent the percentage of relative positive cells (peak value=100%)±S.D., with n=3–4. Bars in panel (b) represent mean±S.D., n=3, with arbitrary units (arb. un.) for mRNA expression (wt=1). Values were compared using the Student's t-test. *P<0.05, **P<0.01
Figure 5
Figure 5
Genomic distribution of 5mC in rd1 and wt mice at PN11. (a) Correlation plot of methylation distribution between wt and rd1 retinae at PN11. Venn diagram of differentially methylated genes in wt (violet) and rd1 (red), showing 1284 genes to be hypermethylated in rd1, whereas only 95 genes are hypomethylated. (b) Additionally, 1727 genes have conserved methylation patterns. (c) Gene ontology analysis of genes methylated in rd1 retina. (d) Heatmap representations of 5mC enrichment in identified peak regions (5 kb flanking the transcription start site (TSS), which is the 5′ position of a gene sequence, where transcription starts). (e) Exemplified composite profiles for different clusters. Composite signal profiles of 5mC patterns in genes characterized by 5mC enrichment or lack of 5mC enrichment in concatenated exons in (f) the wt and (g) the rd1 retina. The methylation profiles for wt and rd1 reveal stronger methylation of exons in rd1, independent of the relative distance within the exon (f and g). (h) Overlayed average gene methylation profiles in wt and rd1 retina. Note the 5mC enrichment at gene promoter regions (500 bp upstream, i.e., left of TSS) for both genotypes, and in gene body towards 3′ end of the gene in rd1 (approximately 2000–3500 downstream, i.e., right of TSS) (h). Grey areas in (fh) indicate regions without 5mC enrichment
Figure 6
Figure 6
Motif enrichment of methylation patterns and gene expression correlation. (a) The list shows the top 20 of motifs enriched in rd1 retina at PN11. Globally enriched motifs in methylated regions in rd1 retina at PN11 for (b) YY1, (d) NRL, and (f) E2F3. Venn diagrams of methylated genes containing binding motifs for (c) YY1, (e) NRL, and (g) E2F3 in wt and rd1. (h) Gene expression profile of methylation unaltered (conserved) genes and hypermethylated genes in rd1. Bars represent mean±S.E.M., n=3, of log2 (gene) expression ratios. Pairs of groups were compared using the Student's t-test. *P<0.05, **P<0.01, ***P<0.005
Figure 7
Figure 7
Short-term DNMT inhibition protects rd1 photoreceptor in vitro. (a and b) Treatment with the DNMT inhibitor decitabine for 4 days in vitro significantly reduced photoreceptor cell death (expressed as the percentage of TUNEL-positive cells in the ONL). (c and d) At 2.5 μM, decitabine also reduced the numbers of 5mC-positive cells. Bars represent mean±S.D., n=2–7, and values were compared using the Student's t-test. **P<0.01, ***P<0.005; ONL: the individual figures are oriented such that this layer is up and inner retinal layers are down. Scale bar=20 μm. See Material and Methods section for culturing paradigm details

Similar articles

Cited by

References

    1. 1Hartong DT, Berson EL, Dryja TP. Retinitis pigmentosa. Lancet 2006; 368: 1795–1809. - PubMed
    1. 2Azadi S, Paquet-Durand F, Medstrand P, van Veen T, Ekström PAR. Up-regulation and increased phosphorylation of protein kinase C (PKC) δ, μ and θ in the degenerating rd1 mouse retina. Mol Cell Neurosci 2006; 31: 759–773. - PubMed
    1. 3Paquet-Durand F, Silva J, Talukdar T, Johnson LE, Azadi S, van Veen T et al. Excessive activation of poly(ADP-ribose) polymerase contributes to inherited photoreceptor degeneration in the retinal degeneration 1 mouse. J Neurosci 2007; 27: 10311–10319. - PMC - PubMed
    1. 4Sancho-Pelluz J, Alavi M, Sahaboglu A, Kustermann S, Farinelli P, Azadi S et al. Excessive HDAC activation is critical for neurodegeneration in the rd1 mouse. Cell Death Dis 2010; 1: e24. - PMC - PubMed
    1. 5Mermoud JE, Rowbotham SP, Varga-Weisz PD. Keeping chromatin quiet: How nucleosome remodeling restores heterochromatin after replication. Cell Cycle 2011; 10: 4017–4025. - PMC - PubMed

Publication types

MeSH terms