. 2015 Jan;57(1):14-24.
doi: 10.1016/j.ceca.2014.11.002. Epub 2014 Nov 15.

Role of Mitofusin-2 in mitochondrial localization and calcium uptake in skeletal muscle

Affiliations

Role of Mitofusin-2 in mitochondrial localization and calcium uptake in skeletal muscle

Alina Ainbinder et al. Cell Calcium. 2015 Jan.

Abstract

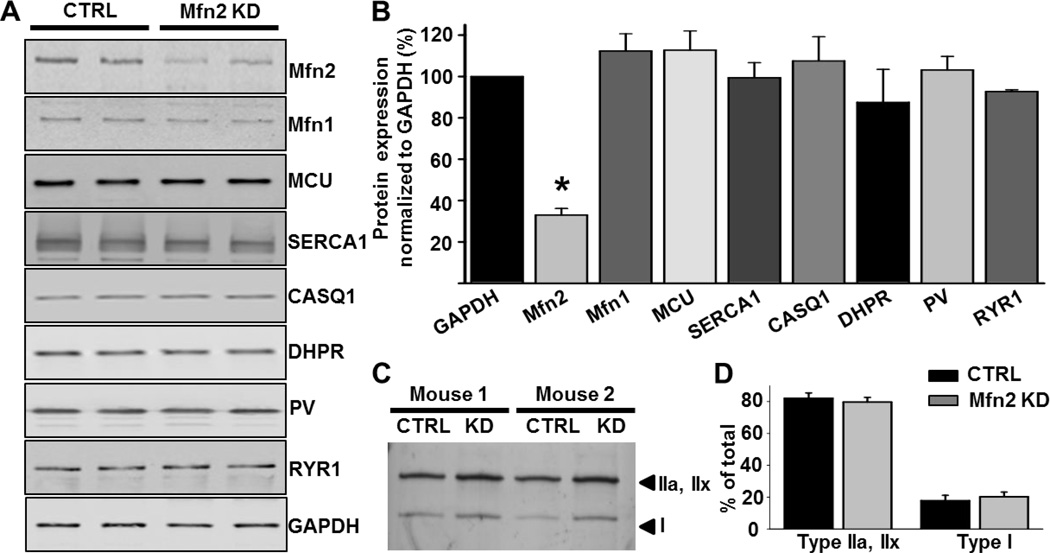
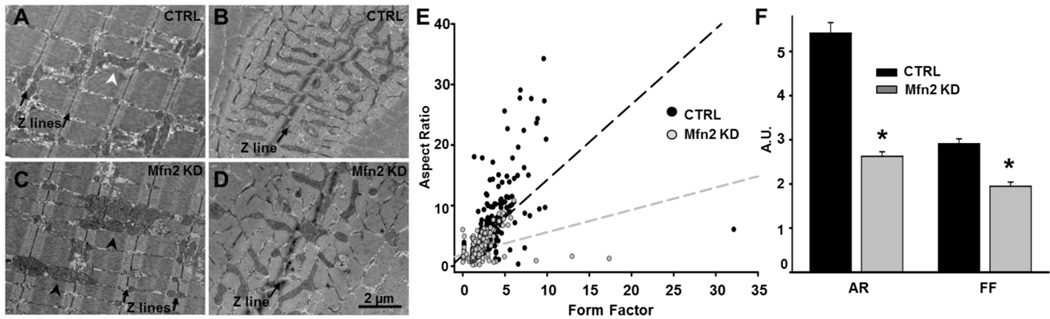
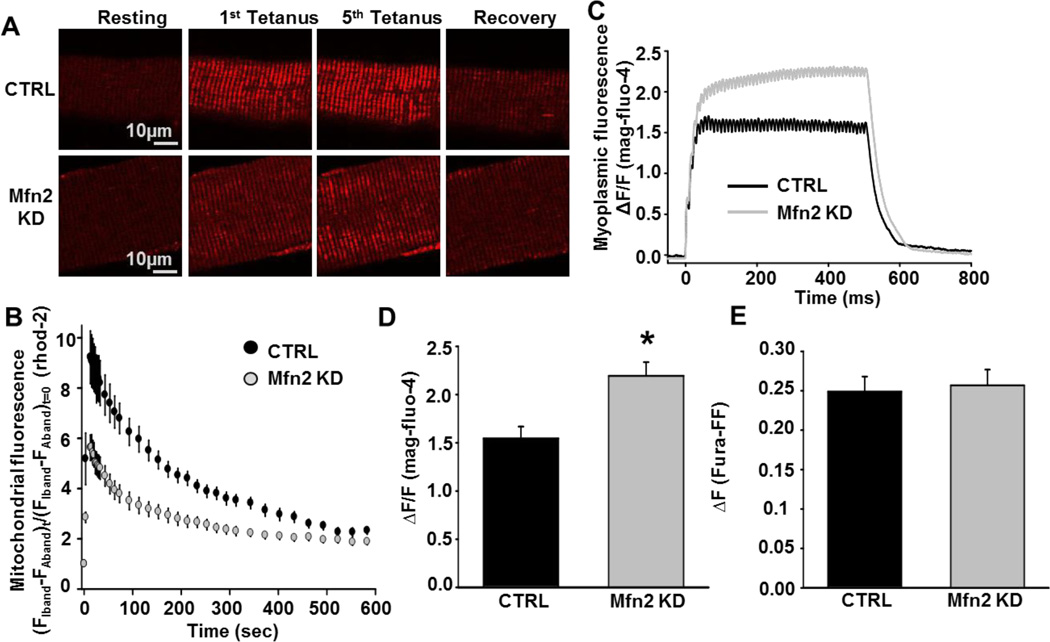
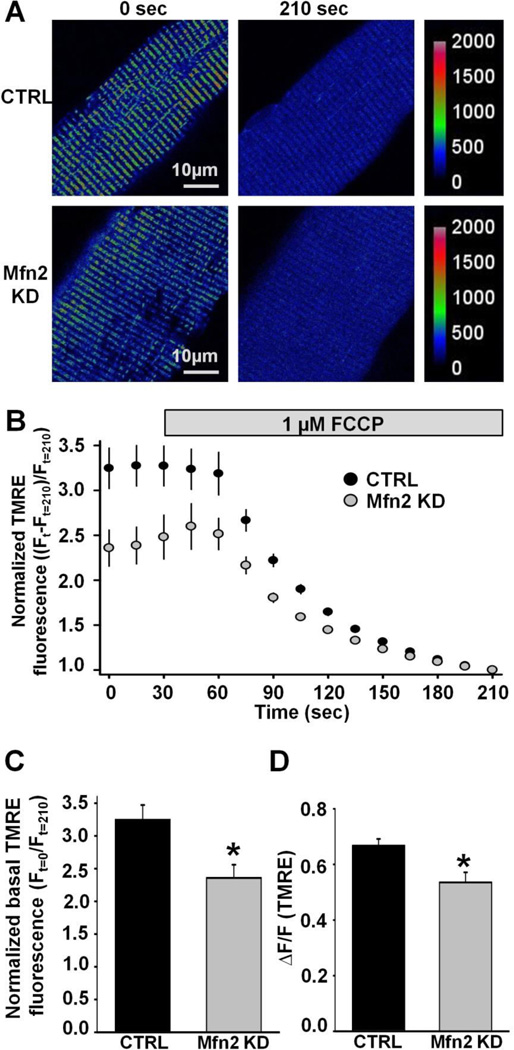
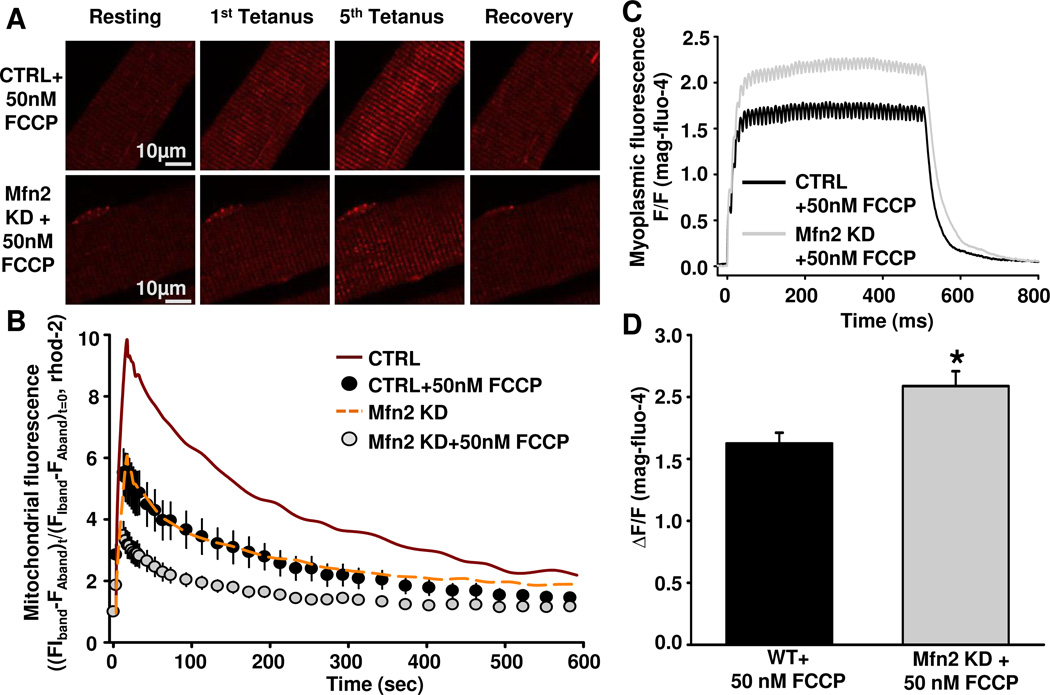
As muscle contraction requires ATP and Ca(2+), skeletal muscle function is highly dependent on communication between two major intracellular organelles: mitochondria and sarcoplasmic reticulum (SR). In adult skeletal muscle, mitochondria located within the I-band of the sarcomere are connected to the SR by small ∼10 nm electron dense tethers that bridge the outer mitochondrial membrane to the region of SR that is ∼130 nm from the site of Ca(2+) release. However, the molecular composition of tethers and their precise impact on mitochondrial Ca(2+) uptake in skeletal muscle is unclear. Mitofusin-2 (Mfn2) is a transmembrane GTPase present in both mitochondria and ER/SR membranes that forms trans-dimers and participates in mitochondrial fusion. Here we evaluated the role Mfn2 plays in mitochondrial morphology, localization, and functional SR-mitochondrial Ca(2+) crosstalk in adult skeletal muscle. Compared to a non-targeting (CTRL) siRNA, in vivo electroporation of 400 nM Mfn2 siRNA (Mfn2 KD) into mouse footpads resulted in a marked acute reduction (67±3%) in Mfn2 protein levels in flexor digitorum brevis (FDB) muscles that occurred without a change in other key Ca(2+) regulatory proteins. Electron microscopy analyses revealed that Mfn2 knockdown resulted in a change in mitochondria morphology and mis-localization of some mitochondria from the I-band to the A-band region of the sarcomere. To assess the role of Mfn2 in SR-mitochondrial crosstalk, we measured mitochondrial Ca(2+) uptake and myoplasmic Ca(2+) transients with rhod-2 and mag-fluo-4, respectively, during repetitive high frequency tetanic stimulation (5×100 Hz tetani, 500 ms/tetani, 0.2 duty cycle) in CTRL and Mfn2 KD fibers. Mitochondrial Ca(2+) uptake during repetitive tetanic stimulation was significantly reduced (40%) in Mfn2 KD FDB fibers, which was accompanied by a parallel elevation in the global electrically evoked myoplasmic Ca(2+) transient. Mfn2 KD also resulted in a reduction of the mitochondrial membrane potential, which contributed to the observed decrease in activity-dependent mitochondrial Ca(2+) uptake. Consistent with this idea, a similar decrease in mitochondrial Ca(2+) uptake was also observed in wild type fibers following a comparable reduction in mitochondrial membrane potential induced by acute exposure to a low concentration (50 nM) of carbonylcyanide-p-trifluoromethoxyphenylhydrazone (FCCP). In addition, both global and mitochondrial Ca(2+) transients during repetitive tetanic stimulation were similarly reduced by both slow (EGTA) and fast (BAPTA) Ca(2+) chelating agents. Together, these results indicate that Mfn2 promotes proper mitochondrial morphology, localization, and membrane potential required for optimal activity-dependent mitochondrial Ca(2+) uptake and buffering of the global myoplasmic Ca(2+) transient in adult skeletal muscle.

Keywords: Calcium signaling; Mitochondrial calcium uptake; Mitochondrial membrane potential; Mitofusin; Skeletal muscle; Tether.


Figures

Figure 1
Figure 1
Quantification of expression levels of proteins involved in Ca2+ regulation in skeletal muscle following short-term Mfn2 knockdown. A. Representative western blots against Mfn1, Mfn2 and proteins involved in Ca2+ regulationin FDB muscles electroporated with CTRL or Mfn2 siRNAs. Mfn2 KD did not significantly alter expression levels of the DHPR, SERCA1, Mfn1, CASQ1, MCU or PV. B. Average (±SE) protein expression levels in CTRL and Mfn2 KD muscles. Mfn2 expression was reduced 67±3% in FDB muscles electroporated with Mfn2 siRNAs (N=10, P<0.05) compared to CTRL. DHPR, SERCA1, Mfn1, CASQ1, RyR1, MCU and PV levels were unaltered. C. Silver stain blot of the distribution of myosin heavy chain isotypes in CTRL and Mfn2 KD FDB muscles. D. Average (±SE) percent distribution of myosin heavy chain isotypes in CTRL and Mfn2 KD FDB muscles. No significant difference in fiber typing was observed between CTRL and Mfn2 KD muscles.
Figure 2
Figure 2
EM analysis of mitochondrial morphology and intracellular localization. A-D. Representative electron micrographs from CTRL and Mfn2 KD muscles. Longitudinal (A) and cross-section (B) images of CTRL FDB muscle. Mitochondria are primarily positioned within the I band (black arrows) with only rare longitudinal extensions running parallel to the A band (white arrowhead). Longitudinal (C) and cross-section (D) images of Mfn2 KD FDB muscle. Mitochondria are more fragmented, often mis-localized, and more frequently found at the A band (black arrowheads). E. Measures of mitochondrial aspect ratio (AR) and form factor (FF) in CTRL and Mfn2 KD FDB fibers. F. Average values (±SE) of AR and FF in CTRL and Mfn2 KD FDB fibers.
Figure 3
Figure 3
Measurement of activity-dependent mitochondrial Ca2+ uptake in CTRL and Mfn2 KD fibers. A. Representative images of rhod-2 fluorescence in CTRL and Mfn2 KD FDB fibers before, during tetanic stimulation (after 1st and 5th tetani), and 10 minutes after the 5th tetanus. B. Average (±SE) time course of mitochondrial rhod-2 fluorescence in FDB fibers at rest, during 5 successive tetanic stimuli, and for 10 minutes of recovery following the 5th and final tetanus in CTRL (black circles) or Mfn2 KD (grey circles) FDB fibers. C. Representative mag-fluo-4 fluorescence traces in CTRL (black trace) or Mfn2 KD (grey trace) FDB fibers during a single 500ms tetanus. D. Average (±SE) relative myoplasmic mag-fluo-4 fluorescence in CTRL or Mfn2 KD FDB fibers during a single 500ms tetanus. E. Average (±SE) change in fura-FF fluorescence in CTRL or Mfn2 KD FDB fibers following addition of a Ca2+ release cocktail consisting of 10 µM ionomycin, 30 µM CPA, and 100 µM EGTA/0 Ca2+.
Figure 4
Figure 4
Measurement of mitochondrial Ca2+ uptake during twitch stimulation in mt-pericam expressing CTRL and Mfn2 KD FDB fibers. A. Average (±SE) traces of mt-pericam fluorescence (402 nm excitation/515 nm emission) in CTRL (black circles) and Mfn2 KD (white circles) fibers during twitch stimulation. B. Average (±SE) relative change in mt-pericam fluorescence (ΔF/F) in CTRL and Mfn2 KD FDB fibers during twitch stimulation. C. Representative mag-fluo-4 traces during twitch stimulation of CTRL (black trace) or Mfn2 KD (grey trace) FDB fibers. D. Average (±SE) relative change in myoplasmic mag-fluo-4 fluorescence during twitch stimulation of CTRL or Mfn2 KD FDB fibers.
Figure 5
Figure 5
Measurement of mitochondrial membrane potential in CTRL and Mfn2 KD FDB fibers. A. Representative pseudocolor TMRE confocal images of CTRL and Mfn2 KD FDB fibers before and after application of 1µM FCCP. Scale bars on the right represent relative pseudocolor fluorescence intensities. B. Average (±SE) normalized TMRE fluorescence of CTRL and Mfn2 KD FDB fibers before and during application of 1 µM FCCP (grey bar). C. Average (±SE) normalized baseline TMRE fluorescence in CTRL and Mfn2 KD FDB fibers. D. Average (±SE) FCCP-sensitive change in TMRE fluorescence in CTRL and Mfn2 KD FDB fibers.
Figure 6
Figure 6
Measurement of mitochondrial Ca2+ uptake in CTRL and Mfn2 KD FDB fibers after 5min incubation in 50nM FCCP. A. Representative images of rhod-2 fluorescence in CTRL FDB fibers + 50nM FCCP or Mfn2 KD fibers + 50nM FCCP before, during tetanic stimulation (after 1st and 5th tetani), and 10 minutes after the 5th tetanus. B. Average (±SE) time course of mitochondrial rhod-2 fluorescence in FDB fibers at rest, during 5 successive tetanic stimuli, and for 10 minutes of recovery following the 5th and final tetanus in CTRL fibers + 50nM FCCP (black circles) or Mfn2 KD fibers + 50nM FCCP (grey circles). CTRL (red solid line) and Mfn2 KD (yellow dashed line) data obtained in the absence of FCCP from Fig. 3B are replotted as line curves again here for comparison C. Representative mag-fluo-4 fluorescence traces in CTRL fibers + 50nM FCCP (black trace) or Mfn2 KD fibers + 50nM FCCP (grey trace) during a single 500ms tetanus. D. Average (±SE) relative myoplasmic mag-fluo-4 fluorescence in CTRL fibers + 50nM FCCP or Mfn2 KD fibers + 50nM FCCP during a single 500ms tetanus.
Figure 7
Figure 7
Measurement of mitochondrial Ca2+ uptake in CTRL and Mfn2 KD FDB fibers after incubation with either 20µM EGTA-AM or 20µM BAPTA-AM. A. Average (±SE) time course of mitochondrial rhod-2 fluorescence in FDB fibers at rest, during 5 successive tetanic stimuli, and for 10 minutes of recovery following the 5th and final tetanus in CTRL (black circles) or Mfn2 KD fibers (grey circles). B. Average (±SE) relative myoplasmic mag-fluo-4 fluorescence in CTRL or Mfn2 KD fibers during a single 500ms tetanus.

References

    1. Westerblad H, Bruton JD, Katz A. Skeletal muscle: energy metabolism, fiber types, fatigue and adaptability. Exp Cell Res. 2010;316(18):3093–3099. - PubMed
    1. Zurlo F, et al. Skeletal muscle metabolism is a major determinant of resting energy expenditure. J Clin Invest. 1990;86(5):1423–1427. - PMC - PubMed
    1. Heymsfield SB, et al. Body-size dependence of resting energy expenditure can be attributed to nonenergetic homogeneity of fat-free mass. Am J Physiol Endocrinol Metab. 2002;282(1):E132–E138. - PubMed
    1. Hoppins S, Lackner L, Nunnari J. The machines that divide and fuse mitochondria. Annu Rev Biochem. 2007;76:751–780. - PubMed
    1. Santel A, Fuller MT. Control of mitochondrial morphology by a human mitofusin. J Cell Sci. 2001;114(Pt 5):867–874. - PubMed

Publication types

MeSH terms

Substances