. 2015 May;29(5):1653-62.
doi: 10.1096/fj.14-261537. Epub 2014 Dec 4.

The methyltransferases enhancer of zeste homolog (EZH) 1 and EZH2 control hepatocyte homeostasis and regeneration

Affiliations

The methyltransferases enhancer of zeste homolog (EZH) 1 and EZH2 control hepatocyte homeostasis and regeneration

Woo Kyun Bae et al. FASEB J. 2015 May.

Abstract

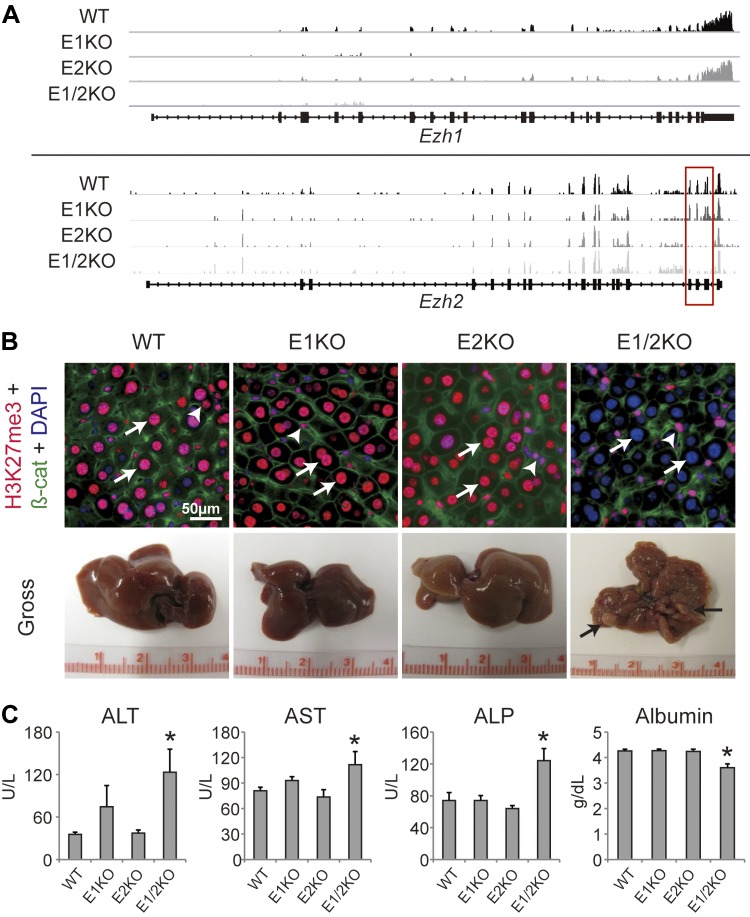
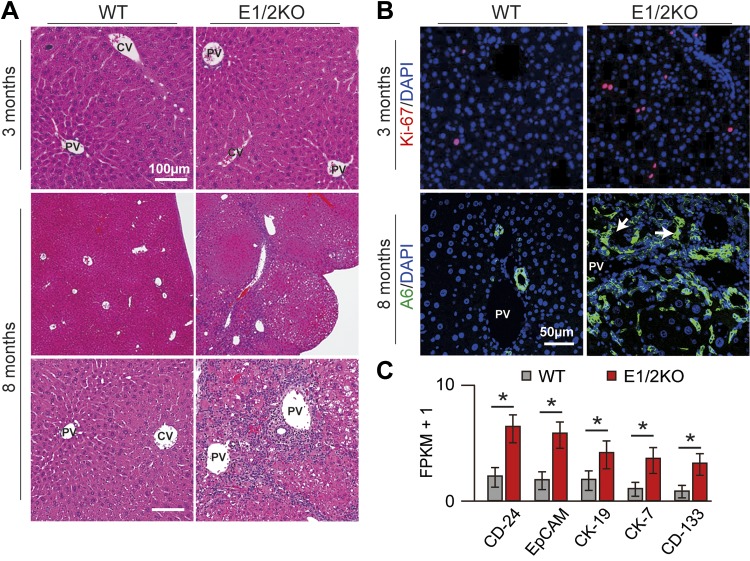
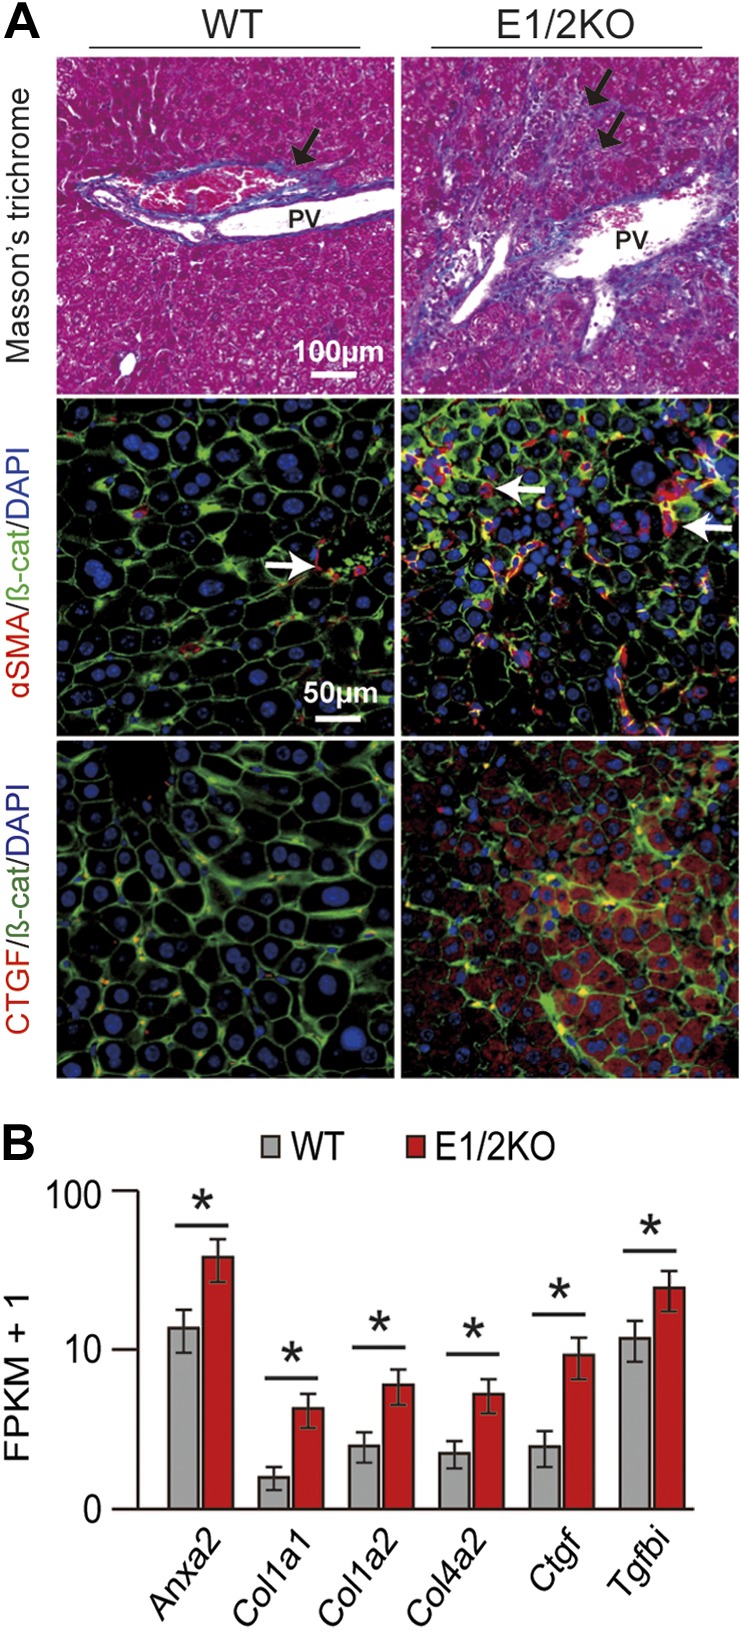
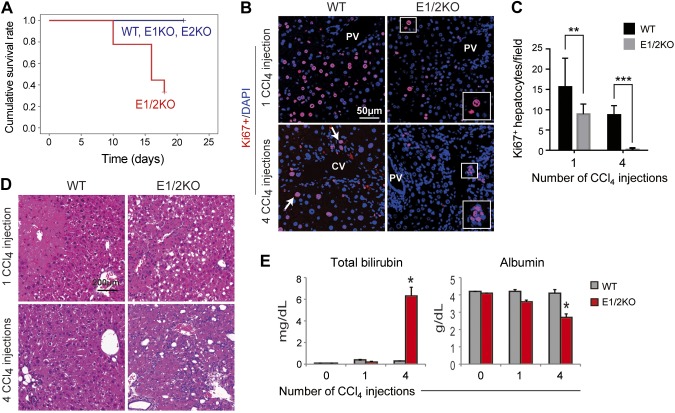
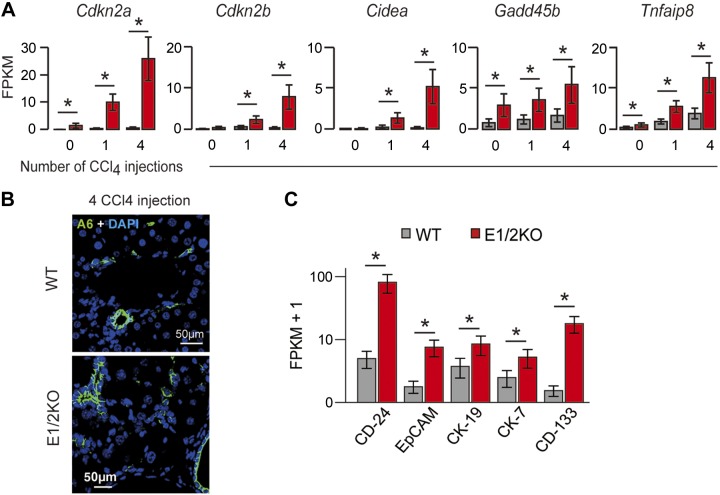
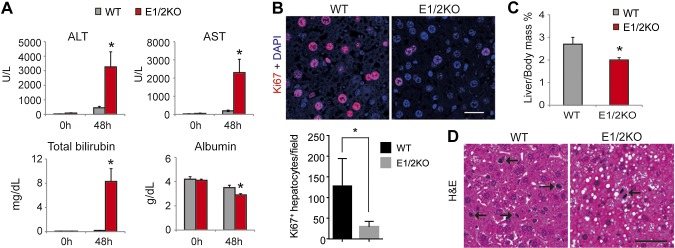
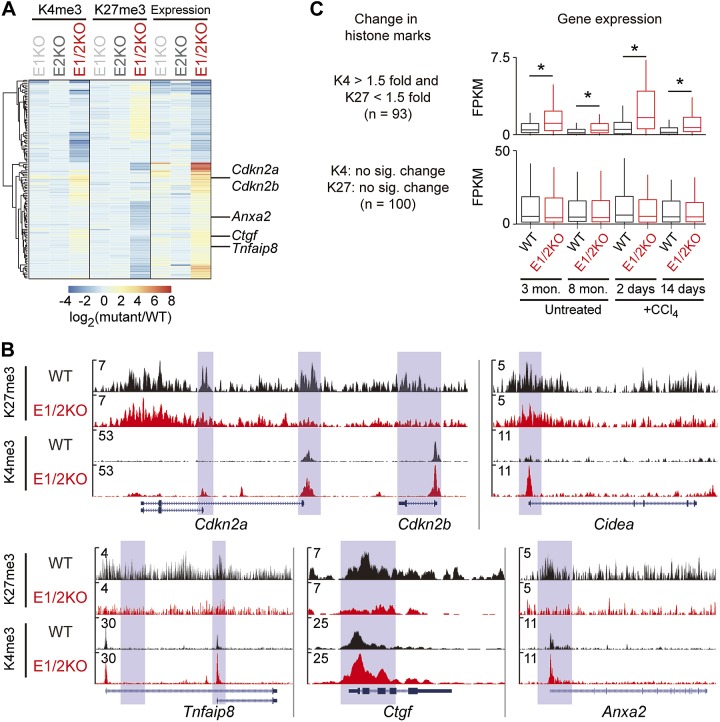
To investigate the role of enhancer of zeste homolog (EZH) 1 and EZH2 in liver homeostasis, mice were generated that carried Ezh1(-/-) and EZH2(fl/fl) alleles and an Alb-Cre transgene. Only the combined loss of EZH1 and EZH2 in mouse hepatocytes caused a depletion of global trimethylation on Lys 27 of histone H3 (H3K27me3) marks and the specific loss of over ∼1900 genes at 3 mo of age. Ezh1(-/-),Ezh2(fl/fl)Alb-Cre mice exhibited progressive liver abnormalities manifested by the development of regenerative nodules and concomitant periportal fibrosis, inflammatory infiltration, and activation of A6-positive hepatic progenitor cells at 8 mo of age. In response to chronic treatment with carbon tetrachloride, all experimental mice, but none of the controls (n = 27 each), showed increased hepatic degeneration associated with liver dysfunction and reduced ability to proliferate. After two-thirds partial hepatectomy, mutant mice (n = 5) displayed increased liver injury and a blunted regenerative response. Genome-wide analyses at 3 mo of age identified 51 genes that had lost H3K27me3 marks, and their expression was significantly increased. These genes were involved in regulation of cell survival, fibrosis, and proliferation. H3K27me3 levels and liver physiology were unaffected in mice lacking either EZH1 globally or EZH2 specifically in hepatocytes. This work demonstrates a critical redundancy of EZH1 and EZH2 in maintaining hepatic homeostasis and regeneration.

Keywords: H3-K27 trimethylation; fibrosis; liver regeneration.


Figures

Figure 1.
Figure 1.
Combined deletion of Ezh1 and Ezh2 resulted in the loss of H3K27me3 marks in hepatocytes. A) Representative photographs depict the mRNA expression of Ezh1 and Ezh2 by RNA-seq in WT, E1KO, E2KO, and E1/2KO livers at 3 mo of age. E1/2KO livers showed the lack of Ezh1 and Ezh2 expression. Exons encoding the SET domain of Ezh2 (red rectangle). B) Top panels are representative images of H3K27me3 immunofluorescence at 3 mo of age. H3K27me3 marks are absent in E1/2KO hepatocytes (arrows), but present in nonparenchymal cells (arrowheads). Bottom panels show gross liver morphology in mice of indicated genotypes at 8 mo of age. Only E1/2KO livers showed a nodular appearance (arrows). β-cat, β-catenin. C) Serum levels of ALT, AST, ALP, and albumin at 8 mo of age. Data are the mean ± sd (n = 5). *P < 0.05 as compared to the age-matched WT, E1KO, and E2KO.
Figure 2.
Figure 2.
Histologic abnormalities in E1/2KO livers. A) Liver morphology at 3 and 8 mo of age. Paraffin-embedded sections were stained with H&E. Top panels are E1/2KO livers showing normal histology at 3 mo. Middle and bottom panels are E1/2KO livers showing a nodular appearance and inflammatory infiltration in portal and periportal areas at 8 mo. PV, portal vein; CV, central vein. B) Top panels show representative immunofluorescence staining for cell proliferation marker Ki67 (red) at 3 mo. Nuclei were counterstained with DAPI. Bottom panels show immunofluorescence staining with A6, a biliary/progenitor cell marker at 8 mo. Representative confocal images show the presence of numerous A6-positive ductular cells (arrows) only in E1/2KO livers. Nuclei were counterstained with DAPI. C) Increased expression of progenitor cell-related genes in E1/2KO livers at 8 mo determined by RNA-seq. Cuffdiff (14) was used to detect significantly up-regulated genes with an FDR-adjusted P value of 0.05 (asterisk).
Figure 3.
Figure 3.
E1/2KO mice developed liver fibrosis by 8 mo of age. A) Top panels show Masson’s trichrome staining on paraffin-embedded liver sections revealing increased density of collagen fibers (arrows) in portal and periportal areas in E1/2KO livers. PV, portal vein. Middle and bottom panels show representative double-immunofluorescence staining for stellate cell marker, αSMA (red) and fibrogenic growth factor, CTGF (red) with β-catenin (β-cat; green). Nuclei were counterstained with DAPI. B) Up-regulation of fibrosis-related genes in E1/2KO livers as determined by RNA-seq. Cuffdiff (14) was used to detect significantly up-regulated genes with an FDR-adjusted P value of 0.05 (asterisk).
Figure 4.
Figure 4.
The loss of EZH1 and EZH2 impaired functional performance, reduced survival, and decreased hepatocyte proliferation in E1/2KO mice during chronic liver injury induced by CCl4 injections twice a week. A) Kaplan-Meier survival curves after fourth injection of CCl4 to 3-mo-old mice show reduced survival in E1/2KO mice (n = 9 for each genotype). B) Representative immunofluorescence staining for cell proliferation marker Ki67 (red) of hepatocytes (arrows). Nuclei were counterstained with DAPI. Insets show higher magnifications of the boxed areas. Note that in E1/2KO livers, only nonparenchymal cells proliferate after the fourth CCl4 injection. PV, portal vein. C) Quantification of Ki67-positive hepatocytes. The number of Ki67-positive cells was determined in 5 independent confocal images taken at ×200 magnification and expressed as numbers per field. Data are the mean ± sd (n = 3 mice for each genotype). **P < 0.01; ***P < 0.0001. D) H&E staining of WT and E1/2KO livers. E) Serum levels of total bilirubin and albumin 2 d after the first and fourth injection of CCl4 to 3-mo-old mice. Data are the mean ± sd (n = 5 mice per each genotype per time point).
Figure 5.
Figure 5.
Liver damage and activation of HPCs during CCl4-induced hepatotoxicity in E1/2KO mice. A) Up-regulation of cell cycle inhibitors and cell death-related genes in E1/2KO livers as determined by RNA-seq after CCl4 injection. Cuffdiff (14) was used to detect significantly up-regulated genes with an FDR-adjusted P value of 0.05 (asterisk). B) Immunofluorescence staining for A6, a biliary/progenitor cell marker. Representative confocal images show the accumulation of A6-positive cells in portal and periportal areas of E1/2KO livers. Nuclei were counterstained with DAPI. C) Up-regulation of HPC-related genes in E1/2KO livers after the fourth injection of CCl4 as determined by RNA-seq. Cuffdiff (14) was used to detect significantly up-regulated genes with an FDR-adjusted P value of 0.05 (asterisk).
Figure 6.
Figure 6.
The genetic loss of EZH1 and EZH2 increases hepatocyte damage and reduces hepatocyte proliferation during compensatory liver regeneration induced by two-thirds PHx. A) Serum levels of ALT, AST, and total bilirubin are increased and levels of albumin decreased in E1/2KO mice at 48 h after PHx. B) Top panels show representative immunofluorescence staining for cell proliferation marker Ki67 (red). Nuclei were counterstained with DAPI. Bottom panels show quantification of Ki67-positive hepatocytes. The number of Ki67-positive cells was determined in 5 independent confocal images taken at ×200 magnification and expressed as numbers per field. Data are the mean ± sd (n = 5 mice for each genotype). *P < 0.05 as compared to the age-matched WT. C) Reduced recovery of liver mass in E1/2KO mice calculated as percentage of body mass. D) Representative H&E staining. Arrows indicate dividing hepatocytes. Scale bars in (B) and (D) are 50 and 100 μm, respectively.
Figure 7.
Figure 7.
Genes displaying altered histone marks due to the combined loss of EZH1 and EZH2 are highly susceptible to epigenetic dysregulation. A) Heatmap shows changes in H3K4me3, H3K27me3, and gene expression levels in tissues with different genotypes (3-mo-old mice). Genes showing a 2-fold change of H3K4me3 or 1.5-fold change of H3K27me3 are shown (n = 124). B) Enrichment of H3K27me3 and H3K4me3 on 5 loci is shown through the UCSC Genome Browser. The light-blue-shaded boxes represent the promoter of genes. C) Expression levels of deregulated histone and nonaltered gene sets in the context of aging (3- and 8-mo-old mice) and toxic (CCl4) administration were determined by RNA-seq. no sig. change, no significant change. *P < 0.01, Mann-Whitney U test.

References

    1. Sauvageau M., Sauvageau G. (2010) Polycomb group proteins: multi-faceted regulators of somatic stem cells and cancer. Cell Stem Cell 7, 299–313 - PMC - PubMed
    1. Ringrose L., Paro R. (2004) Epigenetic regulation of cellular memory by the Polycomb and Trithorax group proteins. Annu. Rev. Genet. 38, 413–443 - PubMed
    1. Margueron R., Reinberg D. (2011) The Polycomb complex PRC2 and its mark in life. Nature 469, 343–349 - PMC - PubMed
    1. Margueron R., Li G., Sarma K., Blais A., Zavadil J., Woodcock C. L., Dynlacht B. D., Reinberg D. (2008) Ezh1 and Ezh2 maintain repressive chromatin through different mechanisms. Mol. Cell 32, 503–518 - PMC - PubMed
    1. Ezhkova E., Lien W. H., Stokes N., Pasolli H. A., Silva J. M., Fuchs E. (2011) EZH1 and EZH2 cogovern histone H3K27 trimethylation and are essential for hair follicle homeostasis and wound repair. Genes Dev. 25, 485–498 - PMC - PubMed

Publication types

MeSH terms