. 2015 Jan 16;290(3):1639-53.
doi: 10.1074/jbc.M114.589846. Epub 2014 Dec 4.

C3larvin toxin, an ADP-ribosyltransferase from Paenibacillus larvae

Affiliations

C3larvin toxin, an ADP-ribosyltransferase from Paenibacillus larvae

Daniel Krska et al. J Biol Chem. .

Abstract

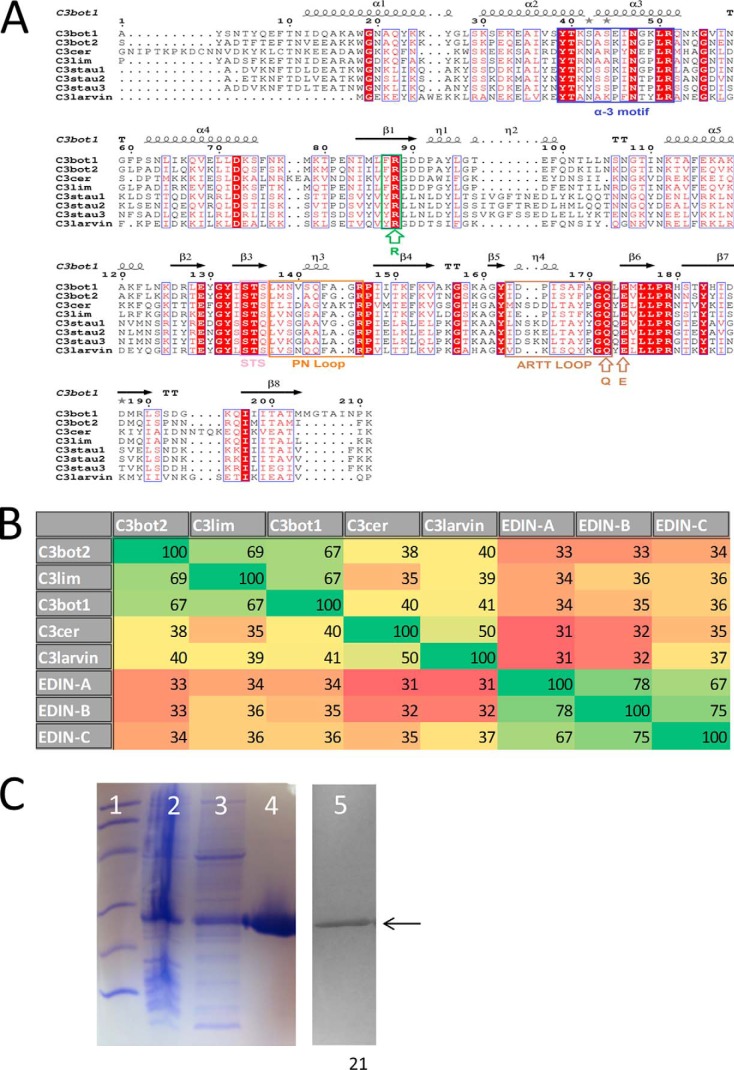
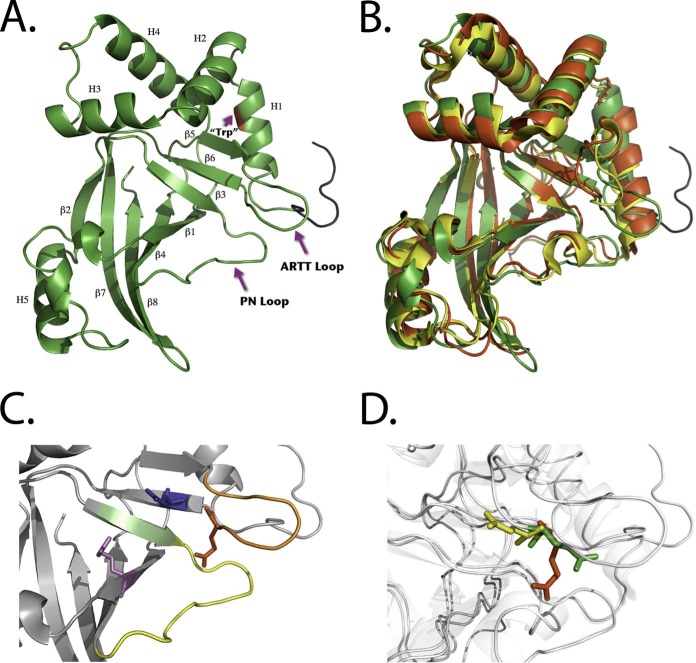
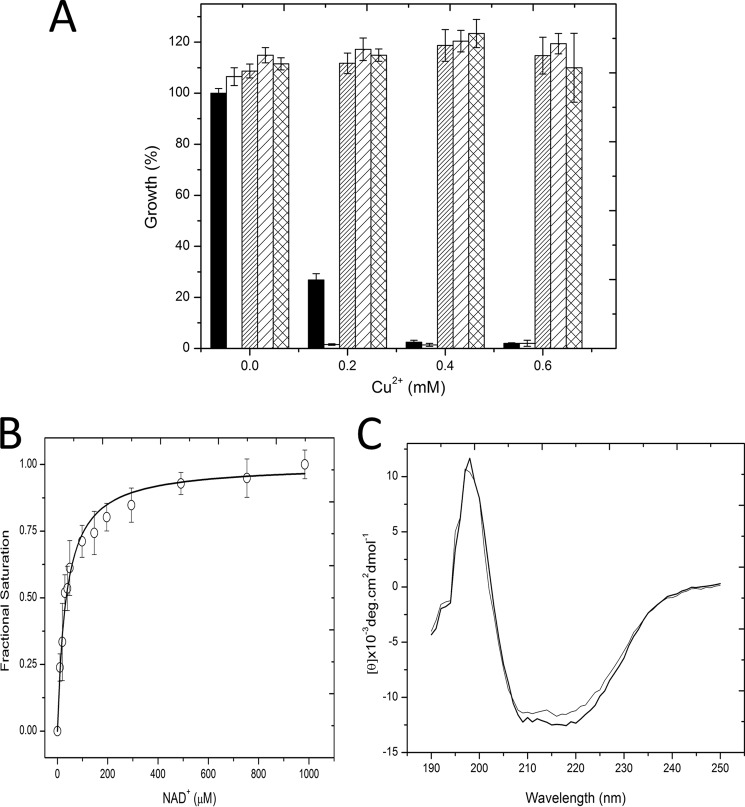
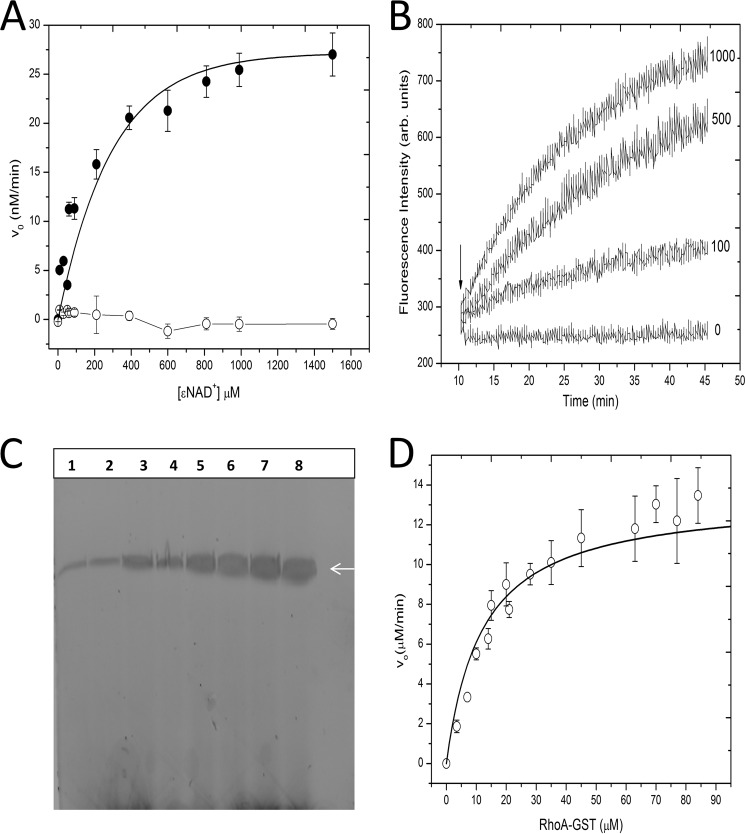
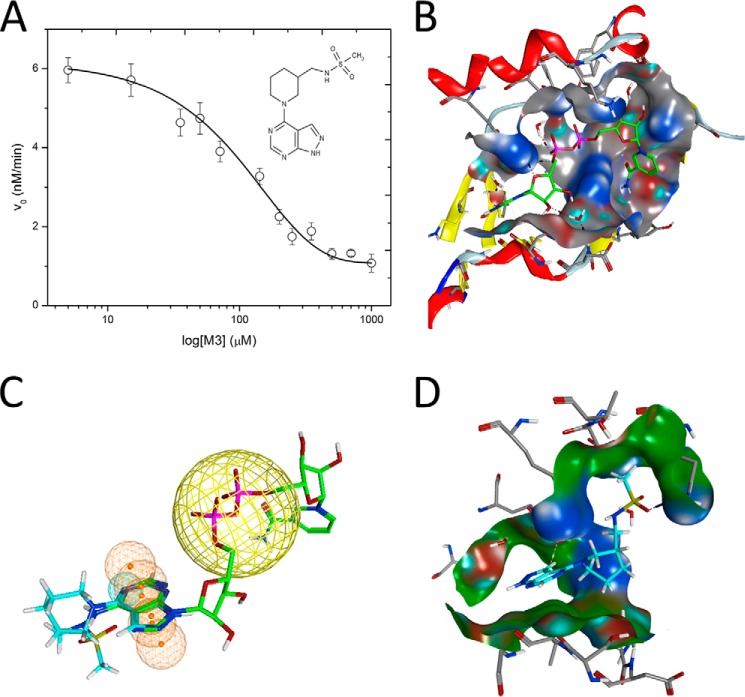
C3larvin toxin was identified by a bioinformatic strategy as a putative mono-ADP-ribosyltransferase and a possible virulence factor from Paenibacillus larvae, which is the causative agent of American Foulbrood in honey bees. C3larvin targets RhoA as a substrate for its transferase reaction, and kinetics for both the NAD(+) (Km = 34 ± 12 μm) and RhoA (Km = 17 ± 3 μm) substrates were characterized for this enzyme from the mono-ADP-ribosyltransferase C3 toxin subgroup. C3larvin is toxic to yeast when expressed in the cytoplasm, and catalytic variants of the enzyme lost the ability to kill the yeast host, indicating that the toxin exerts its lethality through its enzyme activity. A small molecule inhibitor of C3larvin enzymatic activity was discovered called M3 (Ki = 11 ± 2 μm), and to our knowledge, is the first inhibitor of transferase activity of the C3 toxin family. C3larvin was crystallized, and its crystal structure (apoenzyme) was solved to 2.3 Å resolution. C3larvin was also shown to have a different mechanism of cell entry from other C3 toxins.

Keywords: ADP-ribosylation; ADP-ribosyltransferase Inhibitor; Bacterial Toxin; Bioinformatics; C3 Toxins; Enzyme Kinetics; Fluorescence; X-ray Crystallography.


Figures

FIGURE 1.
FIGURE 1.
Multiple-sequence alignment of the C3 toxins. A, sequence alignment of C3 toxins and C3larvin produced using the T-Coffee Web server to align the sequences and ESPript to generate the figure (36). Key catalytic regions are highlighted. Identical residues are highlighted in red, and similar residues are shown in red type. B, identity matrix showing the amino acid identity between the 100 core catalytic residues of the known C3 toxins and C3larvin. Red, highly diverse sequences; green, a large amount of conservation between sequences. The identity matrix was generated using ClustalX2 (18) and colored using Microsoft Excel. C, purification and identification of C3larvin from E. coli lysate. Shown is an SDS-polyacrylamide gel and anti-His tag Western blot showing the purification and identification of C3larvin. Lane 1, molecular mass standards, 14.4, 21.5, 31, 45, 66.2, 97.4 kDa; lane 2, total E. coli cell lysate; lane 3, soluble cell lysate fraction; lane 4, purified C3larvin after gel filtration chromatography; lane 5, Western blot, purified C3larvin; arrow, position of C3larvin.
FIGURE 2.
FIGURE 2.
C3larvin structures. A, C3larvin crystal structure shown as a ribbon diagram. Secondary structural elements (α-helix (H) and β strands (β)) are shown and numbered in succession. The location of the only Trp residue in C3larvin is shown in helix 1 and faces inward. The N-terminal recombinant sequence is colored black. B, structural comparison of C3larvin (green), C3bot1 (PDB code 1G24; red), and C3lim (PDB code 3BW8; yellow) based on an iterative three-dimensional alignment of protein backbone Cα atoms using PyMOL (version 1.5.0.4; Schrödinger, LLC, New York). C, C3larvin catalytic elements are shown. Catalytic residues Arg71, Gln155, and Glu157 are colored magenta, red, and blue. Other elements include the STS motif (lime green), PN loop (yellow), and ARTT loop (orange). D, the overall C3larvin structure, C3bot1 (PDB code 1G24), and C3bot1-NAD+ bound (PDB code 1GZF) are shown in light gray. The catalytic Gln residue conformations of C3larvin (red), C3bot1 (green), and C3bot1-NAD+ bound (yellow) are shown. The distance between Gln residues of C3larvin and C3bot1 is ∼4.0 Å. The distance between Gln residues of C3bot1 and C3bot1-NAD+ bound and between those of C3larvin and C3bot1-NAD+ bound is ∼8.0 Å.
FIGURE 3.
FIGURE 3.
C3larvin inhibition of yeast growth and substrate binding. A, inhibition of yeast growth by C3larvin and selected catalytic variants. All growth is compared with that of yeast expressing a control toxin, P. aeruginosa exotoxin A. Growth is shown at four different concentrations of Cu2+ induction, indicated on the abscissa. Black bar, ExoA; white bar, C3larvin WT; thin stripes, C3larvin Q155A; wide stripes, C3larvin E157A; grid pattern, C3larvin Q155A/E157A. B, NAD+ substrate binding by C3larvin. The binding isotherm for NAD+ with C3larvin was determined by quenching the intrinsic protein fluorescence. The raw fluorescence quenching data were converted to fractional saturation values (ΔFFmax) and are plotted against the NAD+ concentration. The excitation was 295 nm, and the emission was 340 nm with excitation and emission band passes at 5 nm in 5 mm Tris-HCl, 50 mm NaCl, pH 7.9 buffer. Error bars, S.D. C, CD spectra of C3larvin wild type (thick line) and Q155A/E157A variant (thin line) in 5 mm Tris, pH 7.5, buffer. The concentration of both proteins was 0.1 mg/ml, and each spectrum is the average of six independent spectra.
FIGURE 4.
FIGURE 4.
C3larvin enzyme activity. A, GH activity of WT and Q155A/E157A C3larvin. Fluorescence was monitored using an excitation wavelength of 305 nm and an emission wavelength of 405 nm, using excitation and emission band passes of 5 nm. Various concentrations of ϵNAD+ (from 1 μm to 1.5 mm) and C3larvin (20 μm) were added to a buffer containing 20 mm Tris, pH 7.9, 50 mm NaCl to a final volume of 70 μl, and the reactions were covered with 200 μl of mineral oil. The reactions were monitored at 37 °C for a minimum of 2 h. Filled circles, WT C3larvin; open circles, Q155A/E157A C3larvin. The data were fit to the Michaelis-Menten model. Error bars, S.D. B, mGTP binding to RhoA. Purified RhoA was incubated with a 2-fold molar excess of GDP for at least 30 min at room temperature before the start of the assay. RhoA was added to a final concentration of 0, 100, 500, or 1000 nm in a reaction volume of 70 μl of buffer (10 mm triethanolamine, pH 7.5, 150 mm NaCl, 2.5 mm MgCl2) containing 1 μm mGTP. The binding/exchange kinetics were monitored over a period of 1 h in a Cary Eclipse spectrometer using an excitation wavelength of 360 nm and an emission wavelength of 444 nm, with excitation and emission band passes of 5 nm. The samples were excited for 1 s every 20 s to minimize photobleaching of the mGTP. The arrow indicates the addition of the RhoA protein to the reaction. C, ADP-ribosylation of RhoA-GST by C3larvin. ADP-ribosyltransferase kinetic parameters were determined using an end point fluorescein-NAD+ blot assay at 22 °C (see “Experimental Procedures”). C3larvin (3 μm) was incubated with 25 μm fluorescein-NAD+, 275 μm β-NAD+, and between 0 and 150 μm RhoA-GST in a 15-μl reaction volume in reaction buffer (1 mm DTT, 5 mm MgCl2, 1 mm EDTA, 20 mm Tris-HCl, pH 7.5). The reactions were started by adding the NAD+ mixture and allowed to continue for 10 s in the dark before the addition of 5 μl of Laemmli buffer to stop the reaction. The fluorescence of the bands in each well corresponding to RhoA-GST was measured using a ChemiDoc MP system with ImageLab (Bio-Rad) and set relative to the band containing 7 μm RhoA-GST. The data were then converted from fluorescence intensity to concentration units using a standard curve and fit to a Michaelis-Menten model to generate Km, Vmax, and kcat data. The arrow indicates the position of RhoA. The original image was converted to a negative image. D, ADP-ribosyltransferase activity of C3larvin as a function of RhoA-GST concentration. The data from C above were plotted according to the Michaelis-Menten model. Error bars, S.D.
FIGURE 5.
FIGURE 5.
Inhibition of C3larvin GH activity. A, dose-response curve for M3 inhibitor on C3larvin activity. Activity loss in the presence of increasing doses of M3 inhibitor was assessed as described under “Experimental Procedures,” and the IC50 value was calculated from the data. Error bars, S.D. from at least three experiments. Inset, structure of the M3 inhibitor, N-[(1-[1H-pyrazolo[3,4-d]pyrimidin-4-yl]piperidin-3-yl)methyl]methanesulfonamide. B, pocket definition of C3larvin (gray surface) based on the modeled active conformation of NAD+ (green carbon atoms). C, pharmacophore model for C3larvin. Modeled active NAD+ (green carbon atoms) on C3larvin, with M3 (cyan carbon atoms) superposed (manually) to the adenine ring system, to depict the common features. The orange spheres/mesh show the pharmacophore definition based on the NAD+ adenine moiety, and the large yellow sphere is an anion center feature. D, docked poses of M3 (cyan carbon atoms), based on the pharmacophore definition (only features at the adenine moiety) and an induced fit (flexible) receptor. The ring system of M3 is rotated in relation to the previous slide (initial conformation), fulfilling in turn the anionic center.
FIGURE 6.
FIGURE 6.
C3larvin and C3 toxin cell entry experiments. Cell morphology assays were performed with J774A.1 mouse macrophage cells that were grown to confluence in 25-cm2 culture flasks, the cells were resuspended, and 100 μl was transferred to 6- or 96-well culture plates containing 4 ml of supplemented medium (200 μl in the case of the 96-well plates). The cells were left for 48 h to grow in the new medium, at which point either toxin or control buffer was added. The cells were observed 20 h later, and any morphological changes were recorded. A, untreated macrophage cells; B, cells with buffer only; C, 30 nm C3bot1; D, 300 nm C3bot1. The elongated protrusions from the cells visible in B and C are phenotypic changes indicative of infection with C3 toxins. These protrusions are visibly absent for C3larvin-treated cells.
FIGURE 7.
FIGURE 7.
C3bot1 and C3larvin chimeras and effect on macrophages. Cell morphology assays were performed as described in the legend to Fig. 6 with mouse macrophage cells grown to confluence in 25-cm2 culture flasks. The cells were incubated with either toxin or control buffer in a 96-well plate. The cells were observed 20 h later, and any morphological changes were recorded. The cells were untreated (A) or treated with C3larvin buffer only (control) (B), 30 nm C3bot1 (C), 300 nm C3bot1 (D), 30 nm C3larvin (E), 300 nm C3larvin (F), 30 nm C3larvin chimera (G), 300 nm C3larvin chimera (H), 30 nm C3larvin chimera Q155A/E157A variant (I), and 300 nm C3larvin chimera Q155A/E157A variant (J).

References

    1. Yates S. P., Jørgensen R., Andersen G. R., Merrill A. R. (2006) Stealth and mimicry by deadly bacterial toxins. Trends Biochem. Sci. 31, 123–133 - PubMed
    1. Jørgensen R., Wang Y., Visschedyk D., Merrill A. R. (2008) The nature and character of the transition state for the ADP-ribosyltransferase reaction. EMBO Rep. 9, 802–809 - PMC - PubMed
    1. Collier R. J. (2001) Understanding the mode of action of diphtheria toxin: a perspective on progress during the 20th century. Toxicon 39, 1793–1803 - PubMed
    1. Fieldhouse R. J., Merrill A. R. (2008) Needle in the haystack: structure-based toxin discovery. Trends Biochem. Sci. 33, 546–556 - PubMed
    1. Holbourn K. P., Shone C. C., Acharya K. R. (2006) A family of killer toxins. Exploring the mechanism of ADP-ribosylating toxins. FEBS J. 273, 4579–4593 - PubMed

Publication types

MeSH terms

LinkOut - more resources