. 2014 Nov 18:8:398.
doi: 10.3389/fnbeh.2014.00398. eCollection 2014.

A behavioral task for investigating action discovery, selection and switching: comparison between types of reinforcer

Affiliations

A behavioral task for investigating action discovery, selection and switching: comparison between types of reinforcer

Simon D Fisher et al. Front Behav Neurosci. .

Abstract

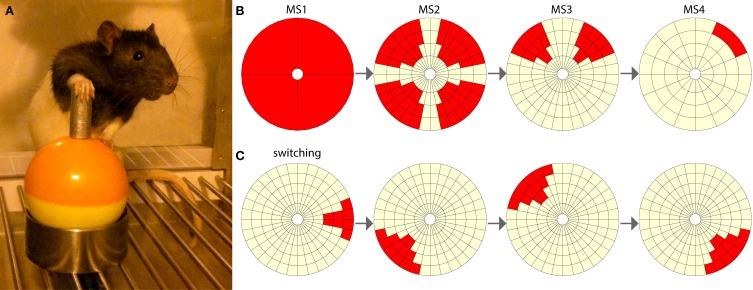
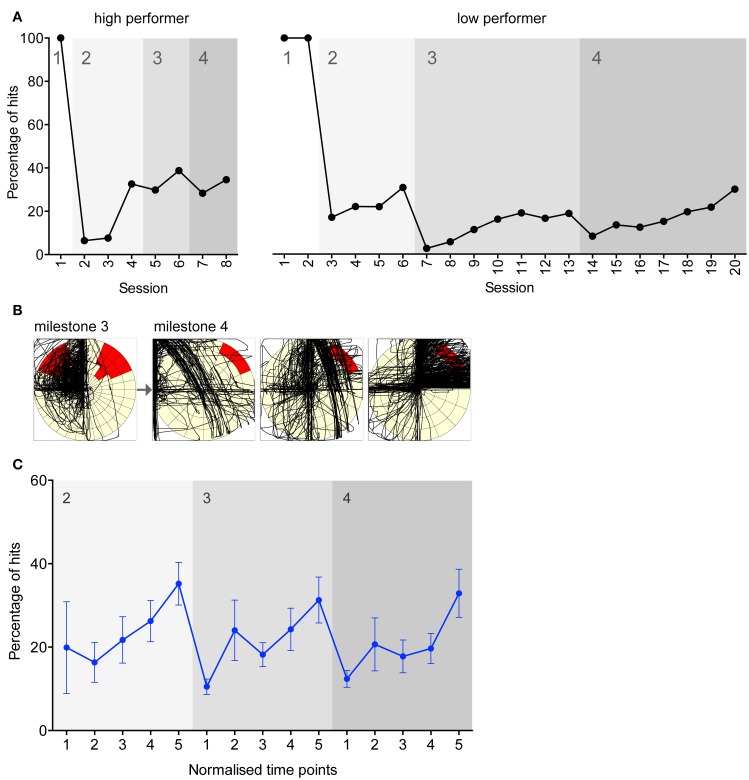
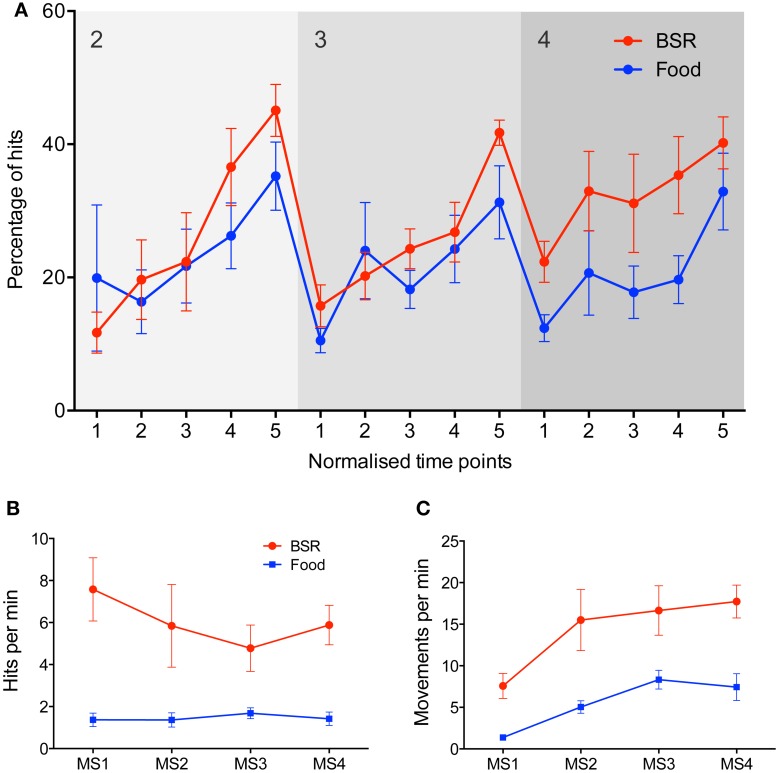
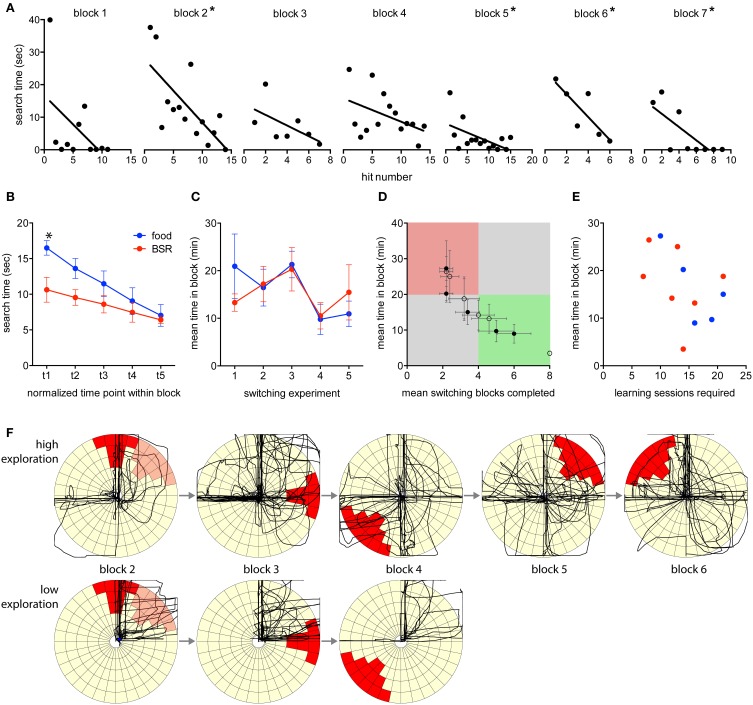
Action discovery and selection are critical cognitive processes that are understudied at the cellular and systems neuroscience levels. Presented here is a new rodent joystick task suitable to test these processes due to the range of action possibilities that can be learnt while performing the task. Rats learned to manipulate a joystick while progressing through task milestones that required increasing degrees of movement accuracy. In a switching phase designed to measure action discovery, rats were repeatedly required to discover new target positions to meet changing task demands. Behavior was compared using both food and electrical brain stimulation reward (BSR) of the substantia nigra as reinforcement. Rats reinforced with food and those with BSR performed similarly overall, although BSR-treated rats exhibited greater vigor in responding. In the switching phase, rats learnt new actions to adapt to changing task demands, reflecting action discovery processes. Because subjects are required to learn different goal-directed actions, this task could be employed in further investigations of the cellular mechanisms of action discovery and selection. Additionally, this task could be used to assess the behavioral flexibility impairments seen in conditions such as Parkinson's disease and obsessive-compulsive disorder. The versatility of the task will enable cross-species investigations of these impairments.

Keywords: action; basal ganglia; discovery; joystick; learning; selection; switching.


Figures

Figure 1
Figure 1
The joystick task. (A) Rat using the joystick in a typical position, with one paw driving the manipulandum and the other paw balancing on the inferior ball of the joystick. (B) Milestones 1 to 4 of increasing difficulty. The red segments represent targets, and the light-yellow segments are neutral. If the rat moves the joystick into a target area, a hit is achieved. (C) An example of four switching targets. In a switching experiment the rat is required to switch between eight such pseudorandom targets.
Figure 2
Figure 2
Evidence of learning in experiments directed toward achieving each milestone. (A) Representative accuracy performance plots for a high and low performing rat working for food reinforcement. Experiment number is shown on the x-axis, and the y-axis indicates the number of hits as a percentage of total joystick movements. Grayscale blocks indicate the milestone transitions. 100% of hits were achieved in milestone 1 as any movement resulted in a hit in this milestone. (B) A representative example of a single rat learning a new target position. The leftmost plot is from the final session under milestone 3, and the three consecutive plots are from the first three sessions under milestone 4. The black lines trace the joystick movements performed by the rat. (C) Mean percentage accuracy for all food rats. On the x-axis, five normalized time points within each milestone are shown. Error bars indicate S.E.M.
Figure 3
Figure 3
Comparisons between food and BSR reinforcers in joystick task performance. (A) Group average performance across milestones 2–4, with five normalized time points within each milestone on the x-axis. The y-axis represents accuracy–the percentage of hits out of all joystick movements. No significant difference in accuracy was found between food (blue, n = 6) and BSR (red, n = 7) rats [Three-Way repeated measures ANOVA, F(1, 11) = 4.09, p > 0.05], although there was a trend to higher accuracy by BSR-reinforced rats (p = 0.068), which is particularly evident in milestone 4. A significant main effect of normalized time point was found [F(4, 44) = 26.12, p < 0.05], indicating learning progression through milestones. (B) Mean hit rate, defined as hits per min, across each milestone in the joystick task for food (blue, n = 6) and BSR (red, n = 7) rats. BSR produced a significantly higher hit rate than food reward [F(1, 44) = 33.05, p < 0.05]. (C) Mean movement rate, defined as joystick movements (hits or misses) per min, across each milestone in the joystick task for food (blue) and BSR (red) rats. BSR rats performed significantly more joystick movements than food reward rats [F(1, 44) = 32.99, p < 0.05]. Error bars indicate S.E.M.
Figure 4
Figure 4
Switching performance by blocks. (A) Learning within the switching blocks is demonstrated by an example progression from an individual rat. The search time required to find the target was measured for each hit in a progression of blocks. Asterisks indicate blocks with a significantly non-zero slope (linear regression, p < 0.05). (B) Search times were normalized into five time points within a switching block, and then mean values for all blocks, of food- and BSR-reinforced rats were created. Search times significantly decreased in both food- and BSR-reinforced rats [Two-Way RM ANOVA, F(4, 40) = 19.9, p < 0.05], indicating that target positions were being learnt. There was a significant interaction of time and reinforcement type [F(4, 40) = 2.9, p < 0.05], and multiple comparisons testing revealed a significant difference between food- and BSR-reinforced rats at the start of blocks on average (Bonferroni method, p < 0.05). (C) No significant differences were found between mean performance, by time in block, of food- and BSR-reinforced rats across switching experiments [Two-Way ANOVA, F(1, 42) = 0.04, p > 0.05]. (D) Overall individual switching performance values for food (closed circles) and BSR (open circles) rats are plotted. The green quadrant represents high performance, the red quadrant poor performance, and the gray areas represent average performance. Notably, the rat represented by the far bottom-right open circle completed all 8 blocks in the shortest possible time (3 min) in every session, and hence has no error in the mean values. (E) No significant correlation was found between the number of sessions required to learn the joystick task and later switching performance, as measured by mean time in block (R = −0.46, p = 0.13). (F) Comparing discovery-related activity plots between high and low performing rats. The first two min of activity of each block is plotted for a high performing rat that exhibited a high number of exploratory movements, and a low performing rat that exhibited limited exploratory movements during the same block progression. For reference, the previous target of block 1 is indicated in light red on the block 2 plot. Error bars indicate S.E.M.

References

    1. Barto A. G., Sutton R. S., Anderson C. W. (1983). Neuronlike adaptive elements that can solve difficult learning control-problems. IEEE Trans. Syst. Man Cybern. 13, 834–846 10.1109/TSMC.1983.6313077 - DOI
    1. Bednark J. G., Franz E. A. (2014). Agency attribution: event-related potentials and outcome monitoring. Exp. Brain Res. 232, 1117–1126. 10.1007/s00221-014-3821-4 - DOI - PubMed
    1. Bednark J. G., Reynolds J. N. J., Stafford T., Redgrave P., Franz E. A. (2013). Creating a movement heuristic for voluntary action: electrophysiological correlates of movement-outcome learning. Cortex 49, 771–780. 10.1016/j.cortex.2011.12.005 - DOI - PubMed
    1. Block A. E., Dhanji H., Thompson-Tardif S. F., Floresco S. B. (2007). Thalamic-prefrontal cortical-ventral striatal circuitry mediates dissociable components of strategy set shifting. Cereb. Cortex 17, 1625–1636. 10.1093/cercor/bhl073 - DOI - PubMed
    1. Burguière E., Monteiro P., Mallet L., Feng G., Graybiel A. M. (2014). Striatal circuits, habits, and implications for obsessive-compulsive disorder. Curr. Opin. Neurobiol. 30C, 59–65. 10.1016/j.conb.2014.08.008 - DOI - PMC - PubMed

LinkOut - more resources