. 2015 Feb:74:167-179.
doi: 10.1016/j.nbd.2014.11.014. Epub 2014 Dec 3.

Cumulative mtDNA damage and mutations contribute to the progressive loss of RGCs in a rat model of glaucoma

Affiliations

Cumulative mtDNA damage and mutations contribute to the progressive loss of RGCs in a rat model of glaucoma

Ji-Hong Wu et al. Neurobiol Dis. 2015 Feb.

Abstract

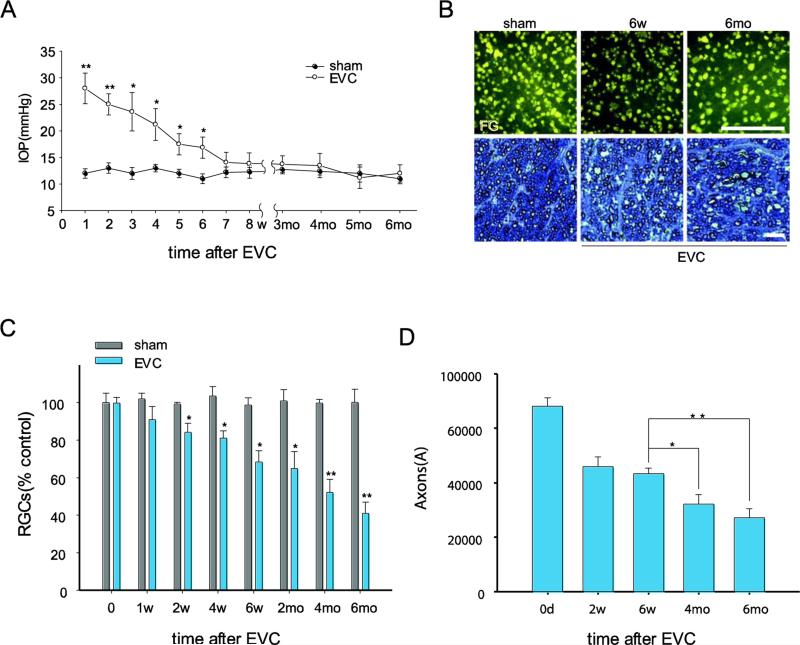
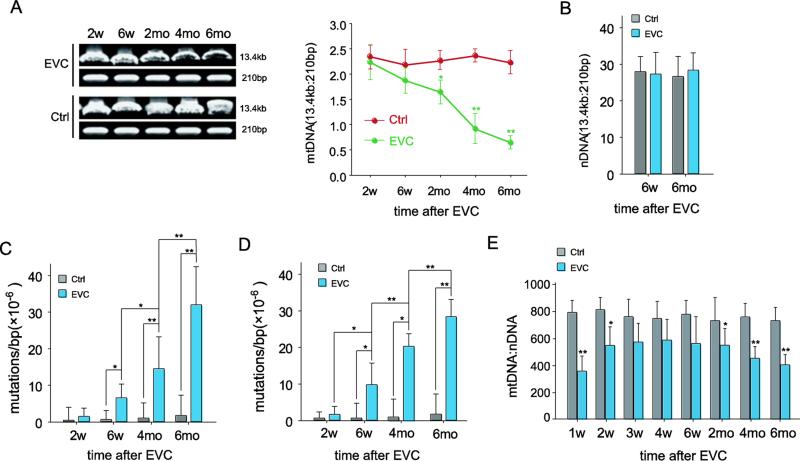
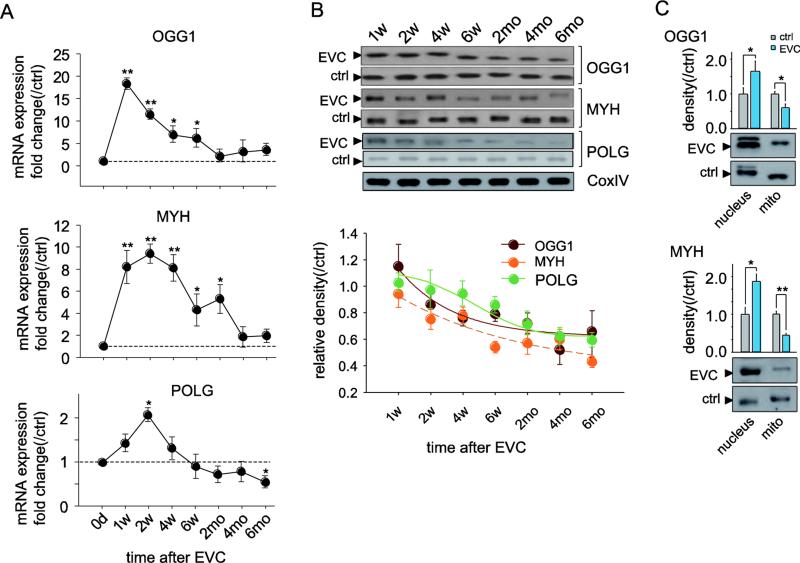
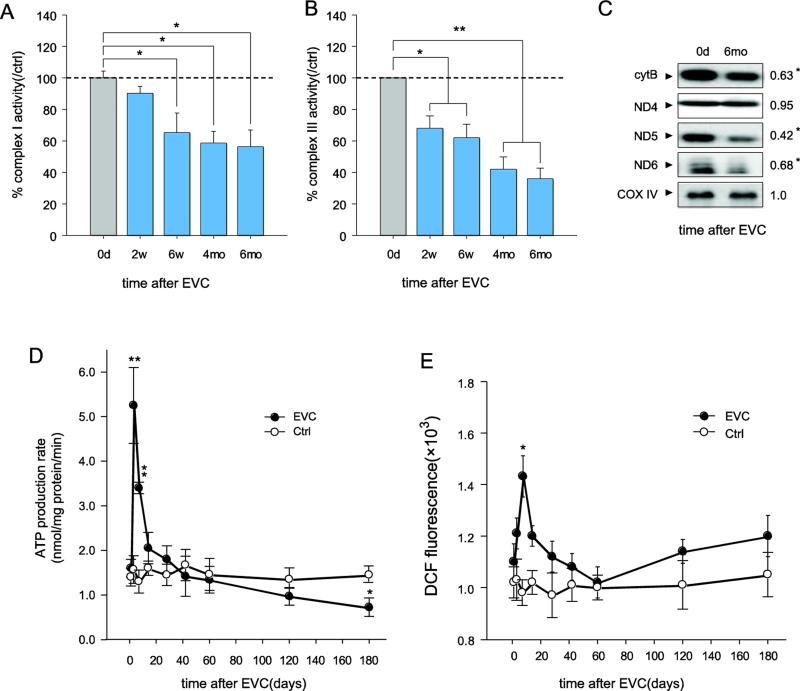
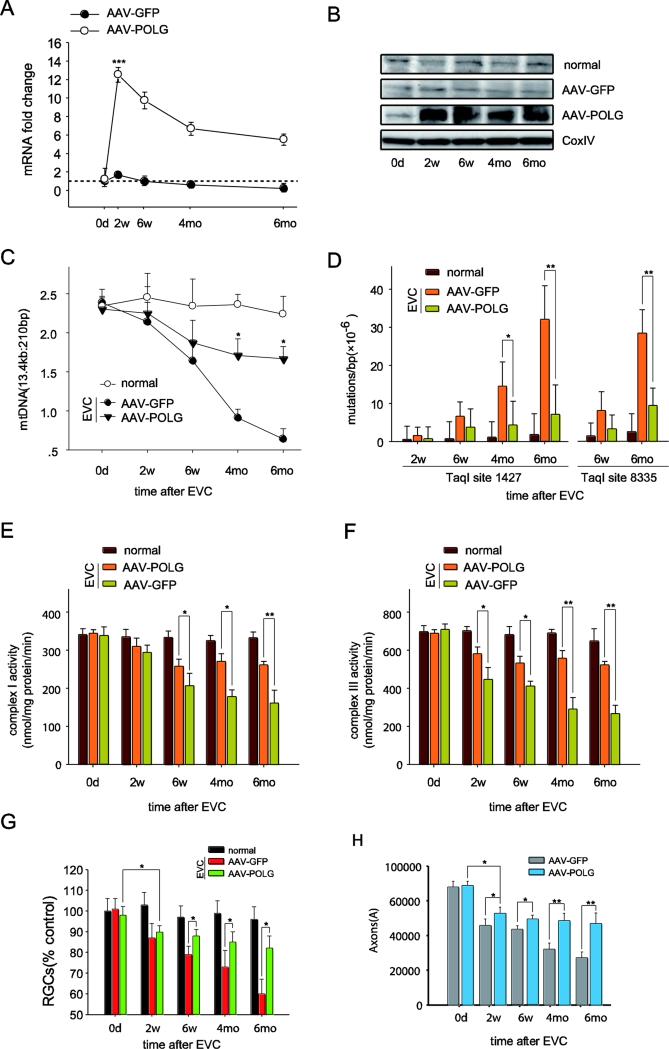
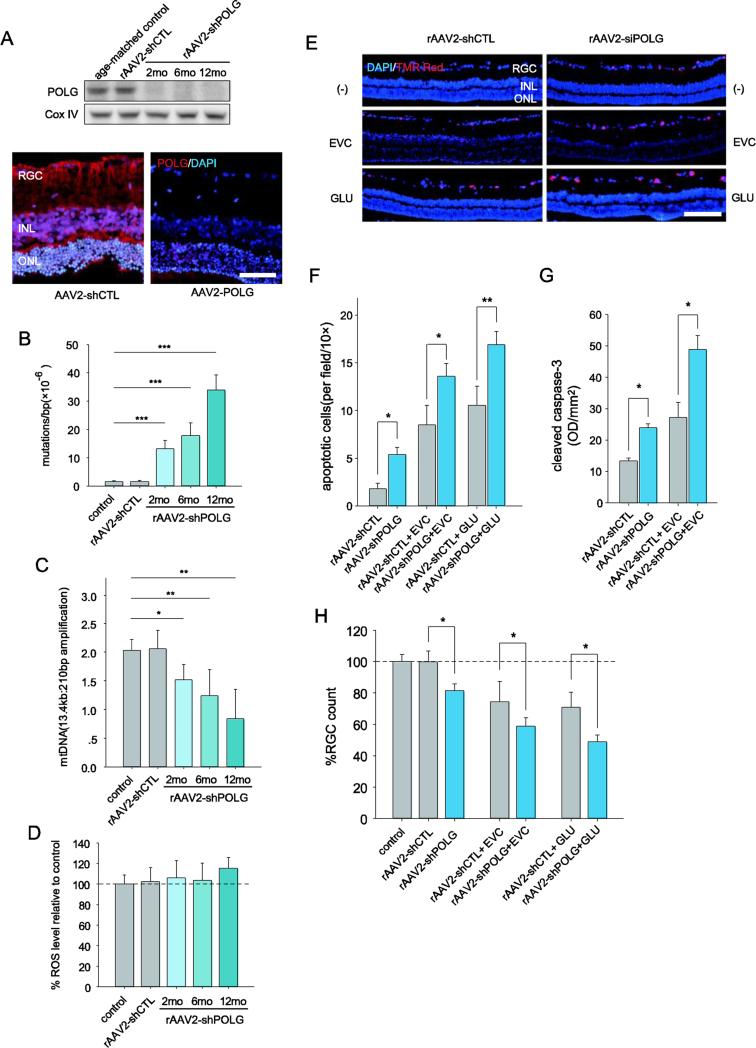
Glaucoma is a chronic neurodegenerative disease characterized by the progressive loss of retinal ganglion cells (RGCs). Mitochondrial DNA (mtDNA) alterations have been documented as a key component of many neurodegenerative disorders. However, whether mtDNA alterations contribute to the progressive loss of RGCs and the mechanism whereby this phenomenon could occur are poorly understood. We investigated mtDNA alterations in RGCs using a rat model of chronic intraocular hypertension and explored the mechanisms underlying progressive RGC loss. We demonstrate that the mtDNA damage and mutations triggered by intraocular pressure (IOP) elevation are initiating, crucial events in a cascade leading to progressive RGC loss. Damage to and mutation of mtDNA, mitochondrial dysfunction, reduced levels of mtDNA repair/replication enzymes, and elevated reactive oxygen species form a positive feedback loop that produces irreversible mtDNA damage and mutation and contributes to progressive RGC loss, which occurs even after a return to normal IOP. Furthermore, we demonstrate that mtDNA damage and mutations increase the vulnerability of RGCs to elevated IOP and glutamate levels, which are among the most common glaucoma insults. This study suggests that therapeutic approaches that target mtDNA maintenance and repair and that promote energy production may prevent the progressive death of RGCs.

Keywords: Glaucoma; Mitochondrial DNA; Mutation; Retinal ganglion cell.


Figures

Fig. 1
Fig. 1
EVC-induced IOP elevation leads to a progressive loss of RGCs and their axons, even after the IOP has returned to normal levels. A, Time course of IOP after EVC (n=40/time point). IOP elevation was observed at 1 day and was sustained for 6 weeks after EVC treatment. B, Representative photographs of FG-labeled RGCs in flat-mounted retinas (top panels, scale bar, 100 μm) and toluidine blue staining of optic nerve cross-sections (bottom panels, scale bar, 100 μm). C, D, Quantitation of FG-labeled RGCs (C) and axons in the optic nerve (D) in EVC-treated eyes during IOP elevation and after return of the IOP to normal levels (n=8/time point). The values are the means ± SEMs. *p<0.05 and ** p<0.01 compared with the contralateral sham operation control eye. EVC: episcleral vein cauterization. w: week, mo: month.
Fig. 2
Fig. 2
The mtDNA changed following IOP elevation. A, mtDNA damage, which was evaluated by the ratio of 13.4-kb and 210-bp using LX-PCR, increased after EVC. The PCR products were analyzed by electrophoresis in an agarose gel (right panel), and the ratios of the long/short amplicons were calculated (left panel). B, The ratios of the long/short amplicons demonstrating no significant nDNA damage after high IOP. C, D, Quantification of the point mutation frequency per base pair at 1,427 (C) and 8,335 (D) sites by the random mutation capture assay. E, Quantitative analysis of mtDNA copy number per nuclear genome. n=24/time point/group. The values are the means ± SEMs. *p<0.05, ** p<0.01 compared with the contralateral sham-operated control. EVC: episcleral vein cauterization. Ctrl: contralateral sham operation control.
Figure 3
Figure 3
Dynamic profile of the expression of mtDNA repair/replication enzymes in the RGCs of EVC eyes. A, Real-time PCR analysis of the gene expression of OGG1, MYH, and POLG in isolated RGCs. The fold change relative to contralateral sham operation controls was calculated using the ΔΔCt method. B, Western blotting analysis showing that the protein expression of OGG1, MYH, and POLG in the mitochondria of RGCs decreased after high IOP. CoxIV was used as an internal reference. The data are expressed as normalized ratios (Ctrl = 1). C, Western blots demonstrating the disparity in OGG1 and MYH protein expression in the mitochondria and in the nucleus 6 months after EVC. For each, the values are the means ± SEMs (n=22–24 retinas/group). *p<0.05, **p<0.01 compared with the contralateral sham operation control. mito: mitochondria. w: week, mo: month.
Fig. 4
Fig. 4
Accelerated mitochondrial dysfunction in the RGCs of EVC eyes, even after the reversal of IOP elevation. A, B, Complex I and III activities in the mitochondria of isolated RGCs decreased after EVC by measuring the consumption of NADH at 340 nm for complex I (A) and the reduction of cytochrome C at 550 nm for complex III (B). Values for the mitochondria of RGCs from the contralateral sham-operated control were set at 100%. C, Quantitative analysis of the mtDNA-encoded proteins ND4, ND5, ND6 and cytochrome b by western blot. CoxIV was used as a control. The value is the 6 month/0 day band density ratio. D, The ATP production rate in mitochondria isolated from RGCs was analyzed using a luciferase-based assay. E, The ROS concentrations in the RGCs were measured with the dye DCFH-DA. The values are the means ± SEMs. *p<0.05, ** p<0.01 compared to the contralateral sham operation control. RGCs isolated from 7-8 retinas were pooled to obtain 1 sample, and 3 samples (n=21–24) were used for each time point per group.
Fig. 5
Fig. 5
Intravitreal injection of AAV2-POLG prevented mtDNA alterations and promoted RGC survival in the rat glaucomatous model. A, POLG mRNA levels in the isolated RGCs were quantified by real-time PCR at 0 days, 2 weeks, 6 weeks, 4 months, and 6 months after EVC with AAV2-POLG/GFP. The fold change relative to normal age-matched controls was calculated using the ΔΔCt method. B, The mitochondrial protein levels of POLG in the RGCs were detected by western blot at different time points after EVC with AAV2-POLG/GFP. CoxIV was used as an internal reference. C, The mitochondrial DNA damage in the isolated RGCs was determined by LX-PCR after EVC with AAV2-POLG/GFP. D, The random mutation capture assay revealed that the point mutation frequency in mtDNA decreased at either position 1,427 or 8,335 of the mitochondrial genome after EVC with AAV2-POLG/GFP. E, F, The measurement of complex I (E) and III (F) activities in mitochondria isolated from RGCs at different times after EVC with AAV2-POLG/GFP. G, H, Quantitation of DiI-labeled RGCs (G) and toluidine blue-stained axons (H) showed that RGCs and their axon survival increased in EVC-treated eyes with AAV2-POLG compared to those with AAV2-GFP. n=24 retinas/time point/group (A, B, C, D). n=21–23/ time point/group (E, F). n=6/ time point/group (G, H). For each, the values are the means ± SEMs. *p<0.05, ** p<0.01 and ***p<0.001 compared with the EVC-treated eyes with AAV2-GFP. normal: age-matched normal control. EVC: episcleral vein cauterization. w: week, mo: month.
Fig. 6
Fig. 6
RGCs with increased mtDNA damage and mutations are not only prone to apoptosis but also have an increased vulnerability to IOP or glutamate challenge. A, Western blot analysis of POLG expression in the mitochondria of RGCs after AAV-shPOLG treatment (upper panel). Immunofluorescence staining showed POLG expression increased at 1 year after intravitreal injection of AAV2-shPOLG (lower panel). Red: POLG; blue: DAPI. Scale bar: 50 μm. B, C, Quantitative analysis of mtDNA mutations at position 8,335 of mtDNA (B) and damage (C) in RGCs after intravitreal injection of AAV-shPOLG using random mutation capture assay and LX-PCR, respectively. D, The ROS levels in isolated RGCs were determined using DCFH-DA dye. The values are expressed as percentages, with the values of the age-matched controls set at 100%. E, A TUNEL assay was used with in situ retinas to detect apoptotic cell death. Representative microscopic images showing TUNEL-positive cells in the retinas treated with AAV2-shPOLG alone; AAV2-shPOLG and EVC/glutamate; AAV2-shCTL alone; and AAV2-shCTL and EVC/glutamate. Red: TUNEL positive; blue: DAPI. Scale bars, 100 μm. F, Quantitative analysis of RGC apoptosis determined by TUNEL assay. The data are expressed as apoptotic cell counts. G, Determination of caspase-3 activation using an antibody to cleaved caspase-3 by western blot. The values were expressed as arbitrary OD units per unit area (OD/mm2) using ImageJ software. H, Quantitation of DiI-labeled RGCs in age-matched controls and those treated with AAV2-shPOLG alone; AAV2-shPOLG and EVC/glutamate; AAV2-shCTL alone; and AAV2-shCTL and EVC/glutamate. The data are presented as percentages, with the values from the age-matched controls set at 100%. All values in these figures are presented as the means ± SEMs, *p<0.05, ** p<0.01 (n=18–21 retinas/time point/group). EVC: episcleral vein cauterization. GLU: glutamate.

References

    1. Abu-Amero KK, et al. Mitochondrial abnormalities in patients with primary open-angle glaucoma. Invest Ophthalmol Vis Sci. 2006;47:2533–41. - PubMed
    1. Almasieh M, et al. The molecular basis of retinal ganglion cell death in glaucoma. Prog Retin Eye Res. 2012;31:152–81. - PubMed
    1. Anderson S, et al. Sequence and organization of the human mitochondrial genome. Nature. 1981;290:457–65. - PubMed
    1. Barron MJ, et al. Mitochondrial abnormalities in ageing macular photoreceptors. Invest Ophthalmol Vis Sci. 2001;42:3016–22. - PubMed
    1. Beal MF. Mitochondria take center stage in aging and neurodegeneration. Ann Neurol. 2005;58:495–505. - PubMed

Publication types

MeSH terms

LinkOut - more resources