. 2014 Dec 4;15(6):775-90.
doi: 10.1016/j.stem.2014.11.010.

Telomerase inhibition effectively targets mouse and human AML stem cells and delays relapse following chemotherapy

Affiliations

Telomerase inhibition effectively targets mouse and human AML stem cells and delays relapse following chemotherapy

Claudia Bruedigam et al. Cell Stem Cell. .

Abstract

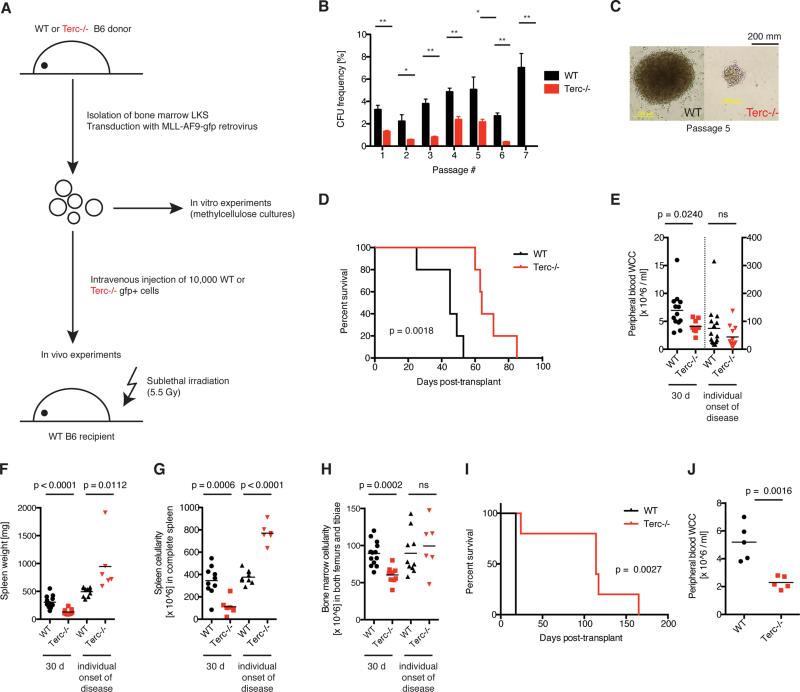
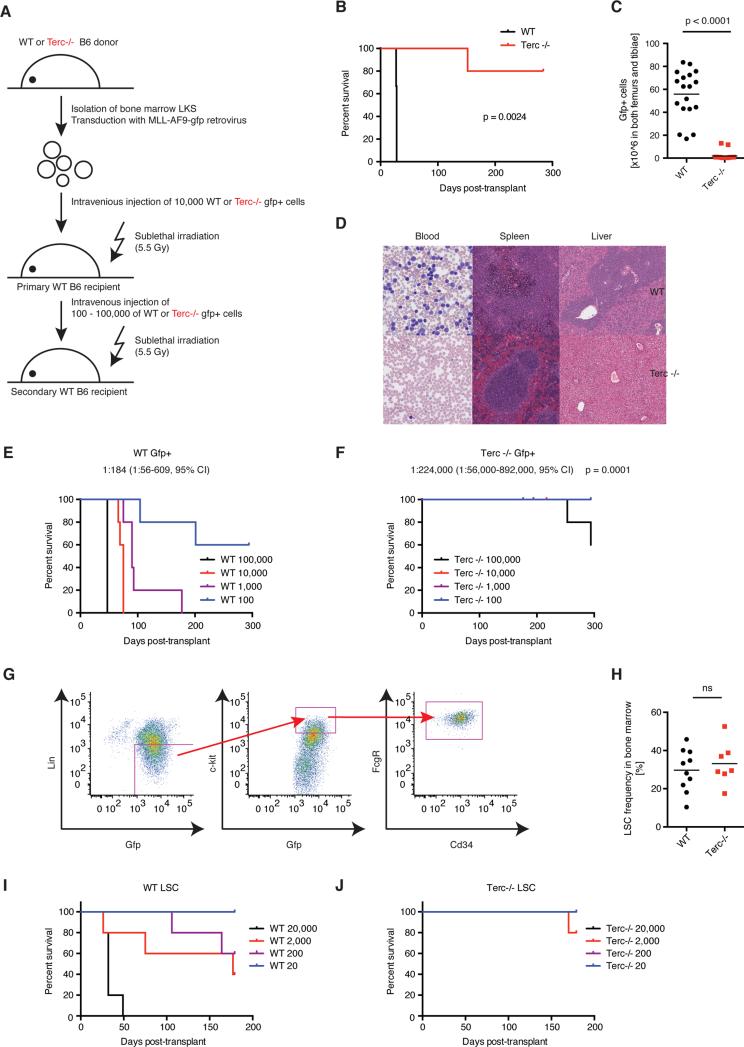
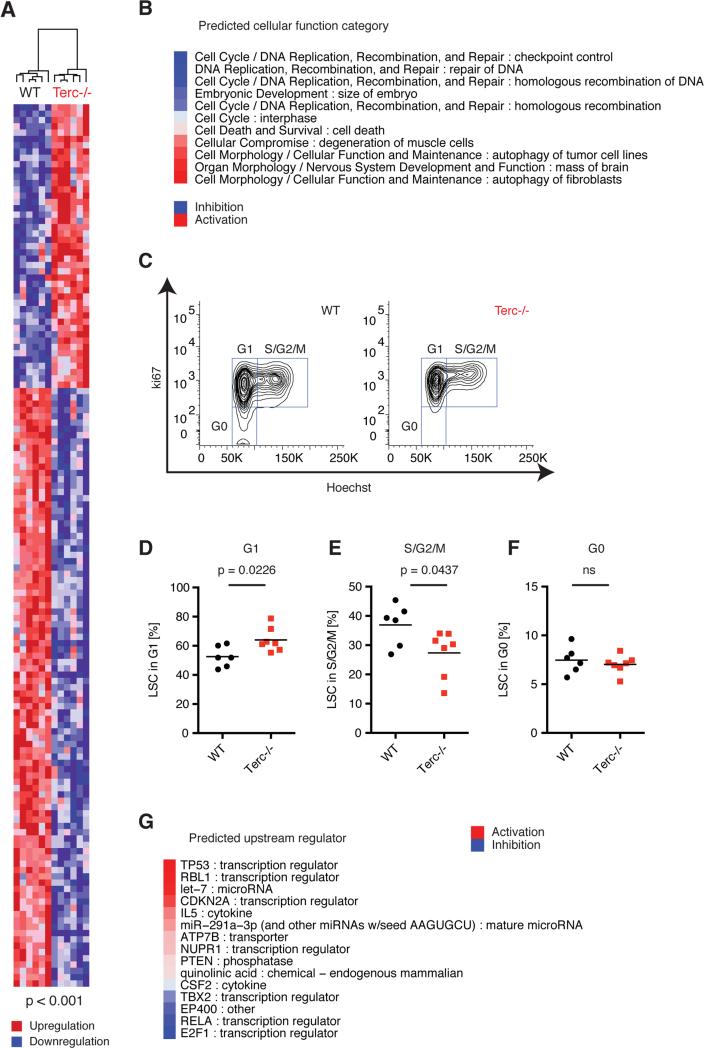
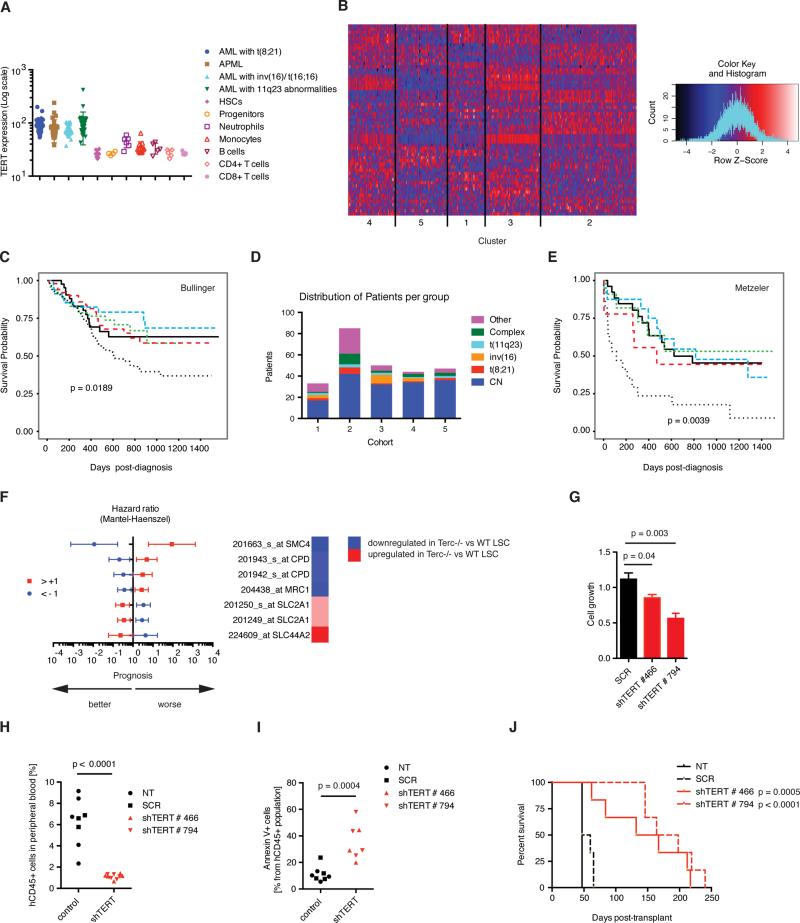
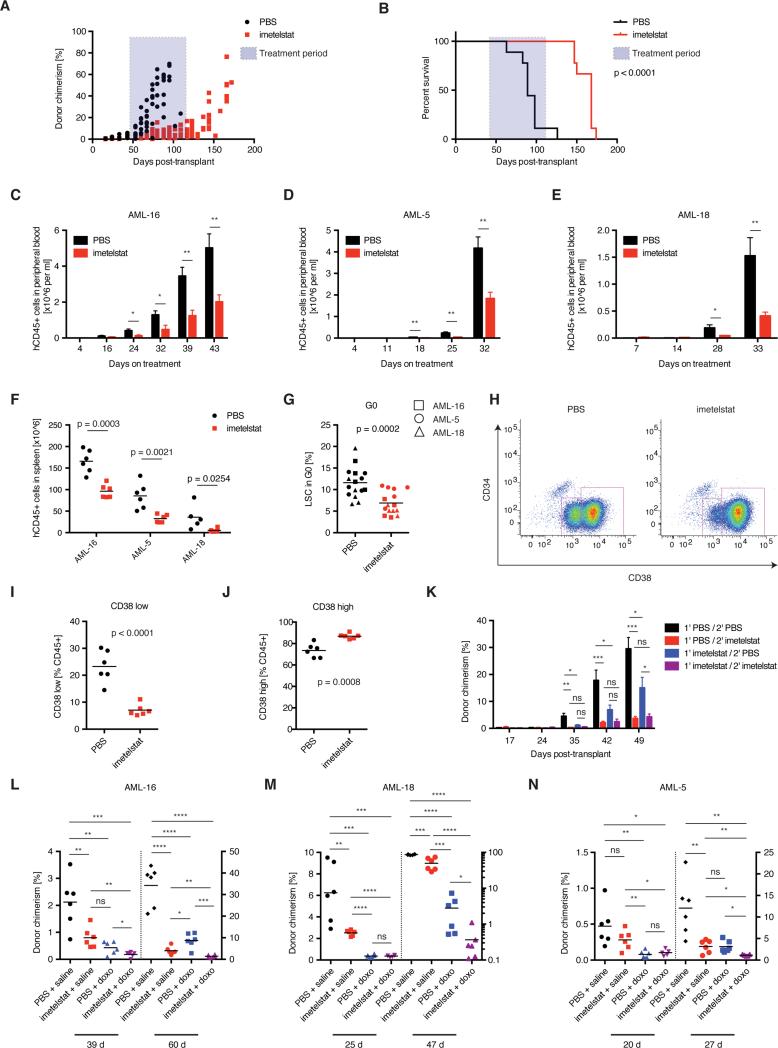
Acute myeloid leukemia (AML) is an aggressive and lethal blood cancer maintained by rare populations of leukemia stem cells (LSCs). Selective targeting of LSCs is a promising approach for treating AML and preventing relapse following chemotherapy, and developing such therapeutic modalities is a key priority. Here, we show that targeting telomerase activity eradicates AML LSCs. Genetic deletion of the telomerase subunit Terc in a retroviral mouse AML model induces cell-cycle arrest and apoptosis of LSCs, and depletion of telomerase-deficient LSCs is partially rescued by p53 knockdown. Murine Terc(-/-) LSCs express a specific gene expression signature that can be identified in human AML patient cohorts and is positively correlated with patient survival following chemotherapy. In xenografts of primary human AML, genetic or pharmacological inhibition of telomerase targets LSCs, impairs leukemia progression, and delays relapse following chemotherapy. Altogether, these results establish telomerase inhibition as an effective strategy for eliminating AML LSCs.


Figures

Figure 1
Figure 1. Telomerase deficiency impairs in vitro self-renewal and delays AML onset
A) Experimental scheme. BM LKS+ cells were isolated from WT or G3 Terc−/− mice, transduced with MLL-AF9-GFP retrovirus in vitro to generate leukemia stem cells (LSC) and plated into methylcellulose or transplanted into irradiated recipient mice. B) Colony-forming assay of WT (black bars) or Terc−/− MLL-AF9 LSCs (red bars). Values represent colony-forming unit frequencies ± SE, calculated as number of colonies per input cells (%). Statistically significant differences according to Student's T test; *: p < 0.05; **: p < 0.01; n = 3. C) Week 5 WT and Terc−/− MLL-AF9 LSC colony morphology. D) Median survival was 45 vs. 64 days post-transplant for recipients of WT (black line) and Terc−/− (red line) MLL-AF9 LSCs, respectively, P = 0.0018, Mantel-Cox Test. N = 5. E) PB WCC, F) spleen weight and G) spleen WCC, and H) BM WCC from recipients of WT (black) or Terc−/− (red) MLL-AF9 LSCs 30 days post-transplant (left) and again at the onset of AML (right). Each point represents an individual animal and the black line represents the mean. P-values calculated by Student's T test are displayed, 2-3 independent experiments. I) Survival and J) PB WCC of mice injected with WT or Terc−/− Aml1Eto + KrasG12C AML. N = 5 per group. See also Figure S1.
Figure 2
Figure 2. Telomerase deficiency eradicates functional LSCs in murine AML
A) Experimental scheme. AML cells (viable GFP+ from BM) were isolated from primary recipients at disease onset and injected into secondary recipients. B) Median survival was 28 days after transplantation of 20000 WT AML cells vs. not reached for Terc−/− AML (follow up >280 days), p = 0.0024 according to Mantel-Cox Test. N = 5, representative of 2 independent experiments. C) Engraftment of BM-derived WT (black) or Terc−/− AML cells (red) 28 days post-transplant (absolute GFP+ cells in both femurs and tibiae in each individual animal). The calculated mean is displayed. P < 0.0001, Student's T test. N = 18 from three independent experiments. D) Histologic analysis of PB, spleen and liver morphology in WT and Terc−/− AML 28 days post-transplant. E) Limiting dilution analysis of WT vs. (F) Terc−/− MLL-AF9 LSCs frequency in secondary transplants injected with 100, 1000, 10000 or 100000 viable AML cells (Sytox-, GFP+). N = 5. LSCs frequency was 1:184 for WT (95% confidence interval, 1:56-609) and 1:224000 for Terc−/− AML (95% confidence interval 1:56000-892000), p = 0.0001 using Poisson analysis. G) Gating strategy for LSCs using FACS, lineagelowGFP+Kit+FcGR+CD34+. H) LSC frequency in the BM from primary recipients injected with WT (black symbols) or Terc−/− MLL-AF9 transformed LKS+ (red symbols) at AML onset. N = 7-10 from three independent experiments. I) Limiting dilution analysis of WT or (J) Terc−/− MLL-AF9 LSCs in secondary transplants injected with 20 (blue), 200 (purple), 2000 (red) or 20000 (black) viable LSCs (lineagelowGFP+Kit+FcGR+). N = 5. See also Figure S2.
Figure 3
Figure 3. Telomerase deficiency in LSCs is associated with cell cycle arrest, p53 activation and programmed cell death
A) Unsupervised hierarchical clustering heatmap displaying differentially expressed genes (p < 0.001) comparing Terc−/− vs. WT LSCs. Red represents higher gene expression (“upregulation”) and blue zones represent lower gene expression (“downregulation”). B) Cellular functions were predicted based on the overlap of differentially expressed genes using Ingenuity Pathway Analysis (IPA), ranked based on the calculated Z-score and pre-selected on p < 0.01. Blue represents predicted inhibition and red represents predicted activation of the respective cellular function category in Terc−/− versus WT condition. C) Representative cell cycle analysis of BM WT or Terc−/− LSC using Ki-67 and Hoechst to discriminate G0, G1 and S/G2/M phases. D) Quantification of G1, E) S/G2/M and F) G0 (quiescent) cell cycle phases in LSCs at AML onset (primary recipients, n = 6-7, three independent experiments). G) Activation and inhibition of upstream regulators predicted using IPA. The upstream regulators were ranked based on Z-score and pre-selected based on the p-value for overlay: p < 0.01. Red color symbolizes predicted activation, and blue color symbolizes predicted inhibition of the upstream regulator. See also Figure S3.
Figure 4
Figure 4. Telomerase deficiency-mediated loss of LSCs is p53 dependent
WT and Terc−/− MLL-AF9 LSCs were transduced with shRNA targeting p53 (shp53) or luciferase control (shluc). A) Colony forming assay of wt-shluc (black), wt-shp53 (blue), terc-shluc (red) and terc-shp53 (purple) during passage 5. Number of colonies per input cells (%). B) Representative flow cytometric analysis of LSC apoptosis (lineage-, Kithigh, annexin V+). C) Quantification of apoptotic LSCs. D) Representative flow cytometric analysis of LSCs (Kithigh) vs. differentiated cells (Gr1high). Median fluorescent intensity of Gr1 (E) and Kit (F). G) Representative flow cytometry plots and H) quantification of LSCs (LineageNegKithigh) from BM of primary recipients injected with WT or Terc−/− LSCs transduced with shp53 or shluc. Mean ± SE. N = 3, 2 independent experiments. Statistical significance by Student's T test. I) Survival analysis. Asterisks (*) denote G3 cohorts with the shortest telomeres. Median survival was 34 (WT-shluc), 34 (WT-shp53), 56 (Terc-shluc), 48 (Terc-shp53), undefined (Terc-shluc*), 187.5 (Terc-shp53*) days. Terc-shluc vs. Terc-shp53: P = 0.1396; Terc-shluc* vs. Terc-shp53*: P = 0.0404 according to Mantel-Cox Test. N = 3-8. See also Figure S4.
Figure 5
Figure 5. Telomerase-deficient LSCs undergo genetic crisis and apoptosis after enforced cell cycle progression
A) Experimental scheme. Animals were analyzed 16h post-transplant to study homing efficiency, or at three weeks post-transplant for cell fate analysis. B) Representative flow cytometry and C) quantification of 16h GFP+ percentage engraftment in total BM from both femurs and tibiae of each individual sample from WT (black) or Terc−/− LSC recipients (red). P = 0.1757, Student's T test. N = 11-17 from two independent experiments. D-E) Time-course analysis of GFP+ engraftment of WT and Terc−/−secondary recipients injected with 100, 1000, 10000 or 100000 BM-derived AML (mean ± SE, N = 5). F) Representative flow cytometry and quantification of cell cycle of LSC in (G) G0, (H) G1 and (I) S/G2/M. N=16-17. J) Representative flow cytometric analysis and (K) quantification of gamma-H2AX in diploid WT (black) or Terc−/− (red) LSCs. N = 16-17. L) Representative apoptosis flow cytometry (GFP+lineage-KitHighannexin V+) and M) Quantification of apoptotic LSCs in the BM. N = 16-17. All cell fate experiments from three independent experiments. Each point represents an individual biological replicate, significance by Student's T test. See also Figure S5.
Figure 6
Figure 6. A telomerase-regulated gene signature identifies a cohort of human AML with adverse clinical prognosis
A) In silico analysis of TERT expression levels in human AML and purified hematopoietic cells (servers.binf.ku.dk/hemaexplorer/). B) Hierarchical clustering analysis of AML patients by the Terc signature (top 140 genes differentially regulated between Terc−/− and WT LSCs according to p-value). Heatmap showing expression intensities of the probesets in the Bullinger dataset. Blue denotes low and red shows high expression intensities. C) Survival analysis of the Bullinger dataset of the 5 classes determined by hierarchical clustering analysis by the Terc signature. D) Cytogenetic analysis within the gene set clusters from the Bullinger dataset. E) Survival analysis of these clusters within the Metzeler dataset (cytogenetically normal samples). F) Hazard ratios in the Metzeler dataset of the five genes that had been identified by random forest modeling in the Bullinger dataset. The population was divided into AML patient groups with either high expression intensities of the probeset of interest (deviating at least by log2>1 from the average expression intensity of the probeset of interest within the total population (red symbols), or low expression intensities (log2<-1 from average expression intensity blue symbols). The heatmap on the right displays the corresponding directionality of regulation of the respective gene in the murine model (Terc−/− LSC vs. WT LSC). G) Analysis of MM6 transduced and stably selected for the expression of two different shRNA constructs targeting TERT (shTERT#466 or shTERT#794), or scrambled (SCR) controls. Mean ± SE, three biological replicates. H) Engraftment of MM6 in NSGS peripheral blood (human CD45% 47 days post-transplant). Each point represents an individual biological replicate. NT = non-transduced control. N = 5 (NT, shTERT) or 3 (SCR). I) Quantification of apoptotic MM6 (mean ± SE, N≥3). J) Survival analysis of NSGS injected with 10,000 viable MM6 from each NT, SCR, shTERT#466, or shTERT#795 condition. N = 6. All cell line data collected from two independent experiments. See also Figure S6.
Figure 7
Figure 7. Pharmacological targeting of telomerase impairs human AML LSC function and prolongs survival in primary AML xenografts
A) Donor chimerism (hCD45%) and B) survival analysis of tertiary human MLL-AF9 AML patient (AML-X):NSGS transplants treated with telomerase inhibitor imetelstat or vehicle control. N = 9; two independent experiments. Statistical differences in survival were calculated by Mantel-Cox test. Expansion of AML patient samples measured in the PB of C) normal cytogenetics AML with FLT3-ITD (AML-16), D) complex cytogenetics subtype (AML-5), and E) MLL-AF9 AML (AML-18) xenografts. Mean ± SE, N = 6. F) Splenic infiltration of AML for AML-16 , AML-5, and AML-18. N = 6. G) G0 cell cycle flow cytometry of CD45+ cells from AML-16, AML-18, and CD45+CD34+ cells from AML-5:NSGS xenografts. N = 6. P = 0.0002. H) Example CD34/CD38 flow plot on splenic cells from imetelstat or vehicle-treated AML-16:NSGS xenografts. I) CD38low and J) CD38high AML cells. N = 6. K) Secondary transplant of hCD45+ cells from imetelstat (blue) or vehicle-treated (black) primary AML-16:NSGS xenografts. The secondary recipients were treated with imetelstat (red or purple, respectively). *: p < 0.05; **: p < 0.01; ***: p < 0.001. Donor chimerism analysis of AML-16 (L), AML-18 (M) and AML-5:NSGS xenografts (N) treated with vehicle controls (black), imetelstat and vehicle control (red), doxorubicin and vehicle control (blue), or doxorubicin in combination with imetelstat (purple) during the early and late progression phases of AML. N = 5-6, 3 biologically independent samples. *: p < 0.05; **: p < 0.01; ***: p < 0.001; ****:p < 0.0001. All statistical significances were determined using Student's T test unless stated otherwise. See also Figure S7 and Table S1.

Comment in

References

    1. Genomic and epigenomic landscapes of adult de novo acute myeloid leukemia. N Engl J Med. 2013;368:2059–2074. - PMC - PubMed
    1. Aalbers AM, Calado RT, Young NS, Zwaan CM, Wu C, Kajigaya S, Coenen EA, Baruchel A, Geleijns K, de Haas V, et al. Telomere length and telomerase complex mutations in pediatric acute myeloid leukemia. Leukemia. 2013;27:1786–1789. - PMC - PubMed
    1. Allsopp RC, Morin GB, DePinho R, Harley CB, Weissman IL. Telomerase is required to slow telomere shortening and extend replicative lifespan of HSCs during serial transplantation. Blood. 2003;102:517–520. - PubMed
    1. Bagger FO, Rapin N, Theilgaard-Monch K, Kaczkowski B, Jendholm J, Winther O, Porse B. HemaExplorer: a Web server for easy and fast visualization of gene expression in normal and malignant hematopoiesis. Blood. 2012;119:6394–6395. - PubMed
    1. Barbosa-Morais NL, Dunning MJ, Samarajiwa SA, Darot JF, Ritchie ME, Lynch AG, Tavare S. A re-annotation pipeline for Illumina BeadArrays: improving the interpretation of gene expression data. Nucleic Acids Res. 2010;38:e17. - PMC - PubMed

Publication types

MeSH terms