. 2014 Dec 6:14:101.
doi: 10.1186/s12896-014-0101-0.

Detection of distinct glycosylation patterns on human γ-glutamyl transpeptidase 1 using antibody-lectin sandwich array (ALSA) technology

Detection of distinct glycosylation patterns on human γ-glutamyl transpeptidase 1 using antibody-lectin sandwich array (ALSA) technology

Matthew B West et al. BMC Biotechnol. .

Abstract

Background: γ-Glutamyl transpeptidase 1 (GGT1) is an N-glycosylated membrane protein that catabolizes extracellular glutathione and other γ-glutamyl-containing substrates. In a variety of disease states, including tumor formation, the enzyme is shed from the surface of the cell and can be detected in serum. The structures of the N-glycans on human GGT1 (hGGT1) have been shown to be tissue-specific. Tumor-specific changes in the glycans have also been observed, suggesting that the N-glycans on hGGT1 would be an important biomarker for detecting tumors and monitoring their progression during treatment. However, the large quantities of purified protein required to fully characterize the carbohydrate content poses a significant challenge for biomarker development. Herein, we investigated a new antibody-lectin sandwich array (ALSA) platform to determine whether this microanalytical technique could be applied to the characterization of N-glycan content of hGGT1 in complex biological samples.

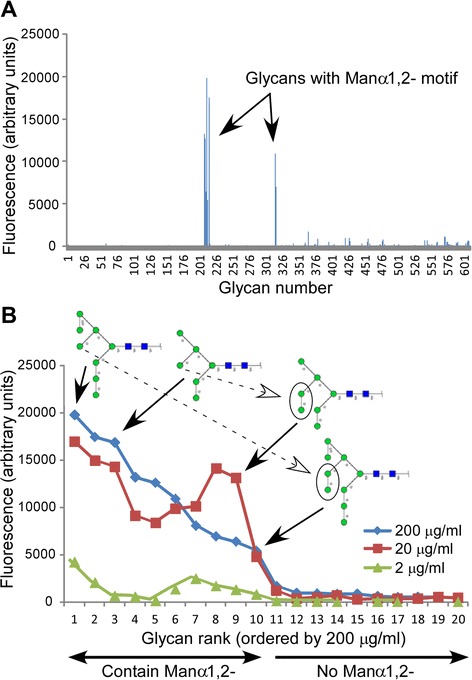
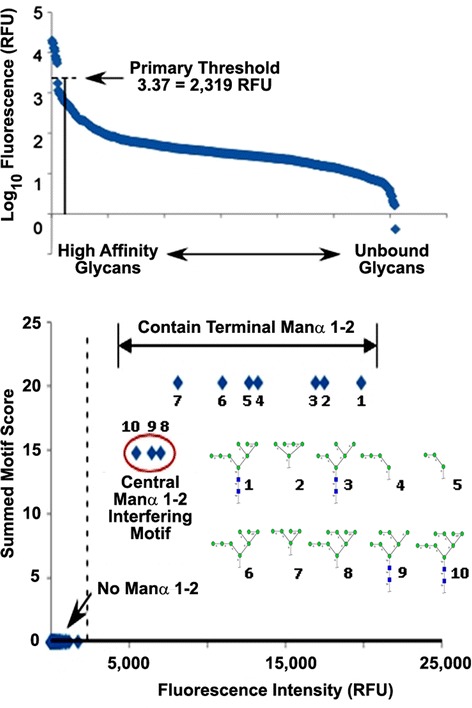
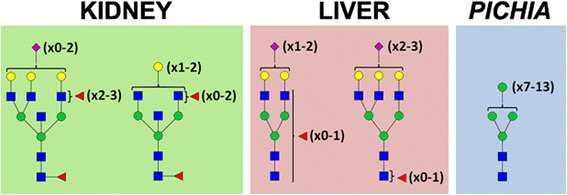
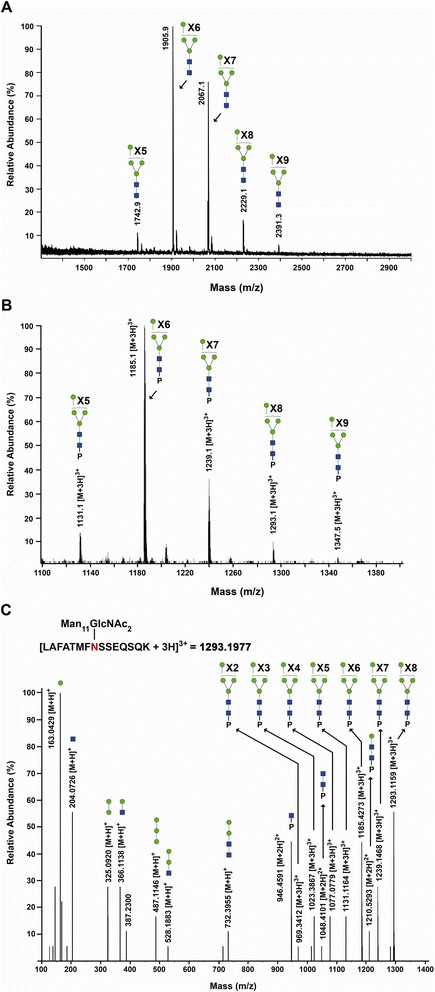
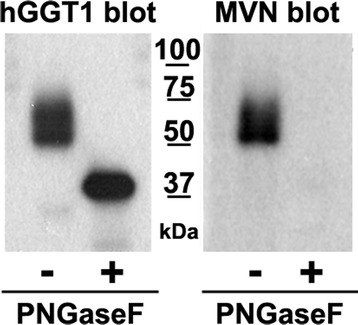
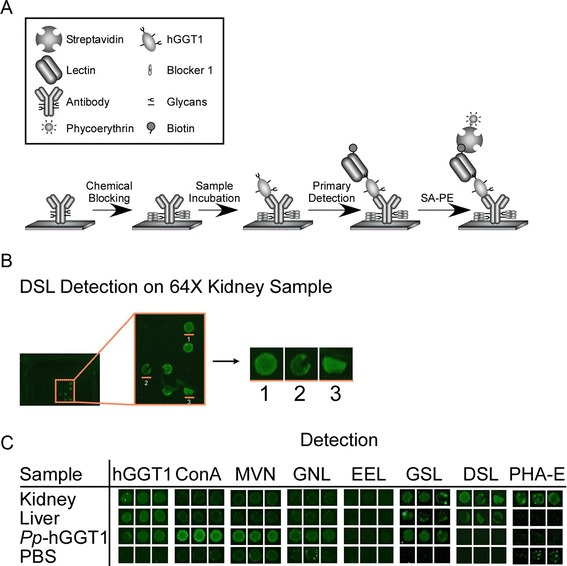
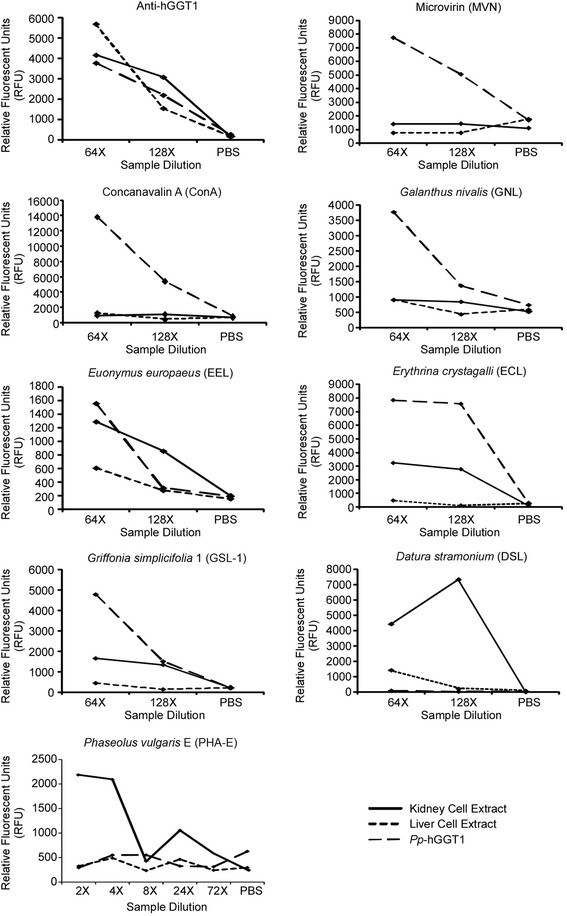
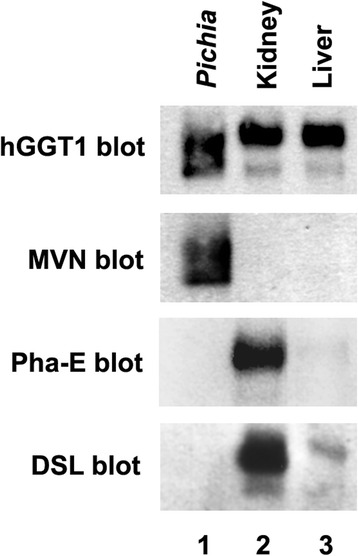
Results: Our data show that hGGT1 can be isolated from detergent extracted membrane proteins by binding to the ALSA platform. Probing hGGT1 with lectins enables characterization of the N-glycans. We probed hGGT1 from normal human liver tissue, normal human kidney tissue, and hGGT1 expressed in the yeast Pichia pastoris. The lectin binding patterns obtained with the ALSA platform are consistent with the hGGT1 N-glycan composition obtained from previous large-scale hGGT1 N-glycan characterizations from these sources. We also validate the implementation of the Microcystis aeruginosa lectin, microvirin, in this platform and provide refined evidence for its efficacy in specifically recognizing high-mannose-type N-glycans, a class of carbohydrate modification that is distinctive of hGGT1 expressed by many tumors.

Conclusion: Using this microanalytical approach, we provide proof-of-concept for the implementation of ALSA in conducting high-throughput studies aimed at investigating disease-related changes in the glycosylation patterns on hGGT1 with the goal of enhancing clinical diagnoses and targeted treatment regimens.


Figures

Figure 1
Figure 1
Glycan array analysis of MVN CRD specificity. (A) Binding profile of MVN at 200 μg/mL, using the CFG array V5.0 harboring 611 different carbohydrate structures. Relative fluorescence units reflect relative affinities toward the corresponding glycan. Glycans bound by MVN are indicated by their CFG array numbers (see Table 1). The diagram is based on the primary CFG data spreadsheets, which can be accessed at http://www.functionalglycomics.org/glycomics/publicdata/selectedScreens.jsp (Glycan Array #2340). (B) MVN glycan array binding at 2, 20, 200 μg/mL as ranked by fluorescence intensity (from 200 μg/mL data set) and apparent binding affinity as determined by Outlier Motif Analysis. Binding was considered positive if the RFU value was greater than the primary fluorescence threshold, calculated to be 2,319 RFU (see Figure 2). All 11 carbohydrates with above-threshold RFU values contained a Manα(1-2)Man- determinant, and the four shown illustrate the binding affinity differences that could be attributed to presence of the central arm Manα(1-2)Man-disaccharide. Symbols: blue box, GlcNAc; green circle, mannose.
Figure 2
Figure 2
Outlier Motif Analysis of the fine carbohydrate specificity of microvirin. (Upper Panel) The fluorescence values for each glycan interaction exhibited by microvirin on the Consortium for Functional Glycomics Glycan Array #2340 at a concentration of 200 μg/mL were graphed in order of apparent intensity to determine the fluoresence threshold of positive interactions. Microvirin exhibited a clear demarcation between bound and unbound states on the array, and an unambiguous cut-off value of 2,319 relative fluorescence units (RFUs) was established. (Lower Panel) Outlier Motif Analysis was employed on the data set shown in (Upper Panel), according to the previously described method [40]. From this analysis it was determined that the presence of a Manα(1-2)-motif was necessary and sufficient for microvirin binding, while the presence of an intervening Manα1-2-linkage on the central arm of the chitobiose core structure of bound N-linked glycans reduced the affinity for microvirin for high-mannose structures. Using the refinement qualifier “Manα1,2 NO Manα1,2 on the central arm,” the summed motif scores for each glycan were plotted with respect to fluorescence intensity after detection with microvirin, which resulted in further segregation of high affinity carbohydrate motifs from the weaker affinity motifs. The dashed line represents the threshold for defining outliers, based on the distributions from all the glycans.
Figure 3
Figure 3
Source-specific composition of N -glycans on human GGT1 (hGGT1). A graphical summary of the predominant structural features of the N-glycans identified on hGGT1 expressed in normal human kidney (left panel) and liver (middle panel) tissues and Pichia pastoris (right panel) is shown. Kidney hGGT1 N-Glycans are dominated by complex type bisected bi- and triantennary structures with a high degree of fucosylation on core and peripheral GlcNAc residues and a low degree of sialylation. Liver hGGT1 N-glycans are dominated by complex-type biantennary structures with a high degree of sialylation and a low degree of core and peripheral fucosylation with modest contributions of triantennary structures. Pichia pastoris-expressed hGGT1 is modified by high-mannose-type N-glycans, ranging in size from Man7GlcNAc2 to Man13GlcNAc2. Symbols: blue box, GlcNAc; green circle, mannose; yellow circle, galactose; red triangle, fucose; purple diamond, N-acetylneuraminic acid.
Figure 4
Figure 4
Glycoconjugate analysis of hGGT1 expressed in Pichia pastoris . (A) MALDI-TOF-MS profile of neutral N-glycans released by PNGase F from purified Pp-hGGT1. Ions corresponding to monosodiated N-glycans known to be expressed by Pichia pastoris are assigned. Symbols: blue box, GlcNAc; green circle, mannose. (B) Averaged LC/Q-Star MS spectrum for the Asn-120 (LAFATMFNSSEQSQK) family of glycopeptides from Pp-hGGT1, showing the identified glycoconjugates within their elution interval. Asterisks denote glycoconjugates that were confirmed by tandem MS analysis. P represents the LAFATMFNSSEQSQK tryptic peptide to which the N-glycans are attached. Unannotated peaks represent co-eluting nonglycosylated hGGT1 peptides. (C) MS/MS spectrum showing fragmentation of the Man11GlcNAc2-modified glycopeptide (m/z =1293.2) shown in (B).
Figure 5
Figure 5
MVN binds high-mannose type N -glycans on Pp -hGGT1. Purified Pp-hGGT1 was incubated in the absence or presence of PNGaseF. Pp-hGGT1 (0.1 μg) from each reaction was resolved by SDS-PAGE, electroblotted onto nitrocellulose, and probed with either an antibody against the large subunit of hGGT1 (left panel) or with biotinylated-MVN (right panel). MW, molecular weight markers.
Figure 6
Figure 6
Antibody lectin sandwich assay (ALSA). (A) Graphical depiction of ALSA strategy. The hGGT1 antibodies are printed on a nitrocellulose slide and chemically derivatized to inactivate their glycans. hGGT1 is captured by the immobilized antibody and N-glycan features are probed using biotinylated lectins, which are subsequently detected using streptavidin-phycoerythrin and fluorescence scanning. (B) One printed antibody array well is shown with the magnified capture antibodies. Individual hGGT1 capture spots have been cut out to show triplicate detection of Datura stramonium lectin (DSL) among 64-fold kidney sample dilutions (equivalent to ~75 ng of total extracted kidney protein). (C) Representative results for hGGT1 capture antibody and detection reagents (indicated in the column labels).
Figure 7
Figure 7
Graphs of Pp -hGGT1, kidney hGGT1, and liver hGGT1 dilution series. Each graph shows representative plots of dilutions of Pichia pastoris-expressed hGGT1, kidney extract hGGT1, and liver extract hGGT1 samples probed with the indicated lectins.
Figure 8
Figure 8
hGGT1 lectin blotting confirms differential ALSA binding affinities. Membrane extracts from normal human kidney and liver tissue or Pichia pastoris-expressed hGGT1 were activity-normalized and subjected to immunoprecipitation with a polyclonal anti-hGGT1 large subunit antibody. Equal volumes from each immunoprecipitation eluate were resolved by SDS-PAGE and affinity blotted with anti-hGGT1 (hGGT1, top panel) or the biotinylated lectins, microvirin (MVN, second panel), Phaseolus vulgaris Erythroagglutinin (Pha-E, third panel), and Datura stramonium lectin (DSL, bottom panel). Expanded views of the immunoblots shown here along with the relevant molecular weight markers are included in Additional file 1.

References

    1. Hanigan MH, Ricketts WA. Extracellular glutathione is a source of cysteine for cells that express gamma-glutamyl transpeptidase. Biochemistry. 1993;32(24):6302–6306. doi: 10.1021/bi00075a026. - DOI - PubMed
    1. Hanigan MH, Frierson HF., Jr Immunohistochemical detection of gamma-glutamyl transpeptidase in normal human tissue. J Histochem Cytochem. 1996;44(10):1101–1108. doi: 10.1177/44.10.8813074. - DOI - PubMed
    1. Lieberman MW, Wiseman AL, Shi ZZ, Carter BZ, Barrios R, Ou CN, Chevez-Barrios P, Wang Y, Habib GM, Goodman JC, Huang SL, Lebovitz RM, Matzuk MM. Growth retardation and cysteine deficiency in gamma-glutamyl transpeptidase-deficient mice. Proc Natl Acad Sci U S A. 1996;93(15):7923–7926. doi: 10.1073/pnas.93.15.7923. - DOI - PMC - PubMed
    1. Hanigan MH, Gallagher BC, Taylor PT, Jr, Large MK. Inhibition of gamma-glutamyl transpeptidase activity by acivicin in vivo protects the kidney from cisplatin-induced toxicity. Cancer Res. 1994;54(22):5925–5929. - PubMed
    1. Hanigan MH, Frierson HF, Jr, Swanson PE, De Young BR. Altered expression of gamma-glutamyl transpeptidase in human tumors. Hum Pathol. 1999;30(3):300–305. doi: 10.1016/S0046-8177(99)90009-6. - DOI - PubMed

Publication types

LinkOut - more resources