

Genetic association analysis under complex survey sampling: the Hispanic Community Health Study/Study of Latinos
- PMID: 25480034
- PMCID: PMC4259979
- DOI: 10.1016/j.ajhg.2014.11.005
Genetic association analysis under complex survey sampling: the Hispanic Community Health Study/Study of Latinos
Abstract
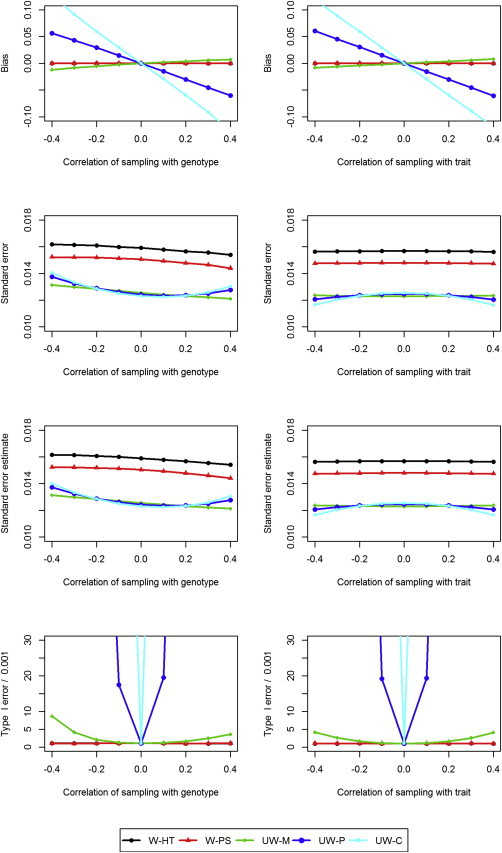
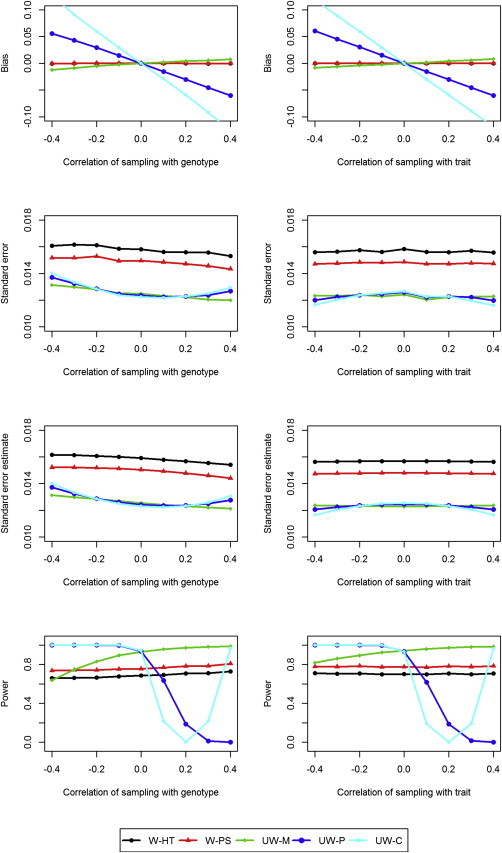
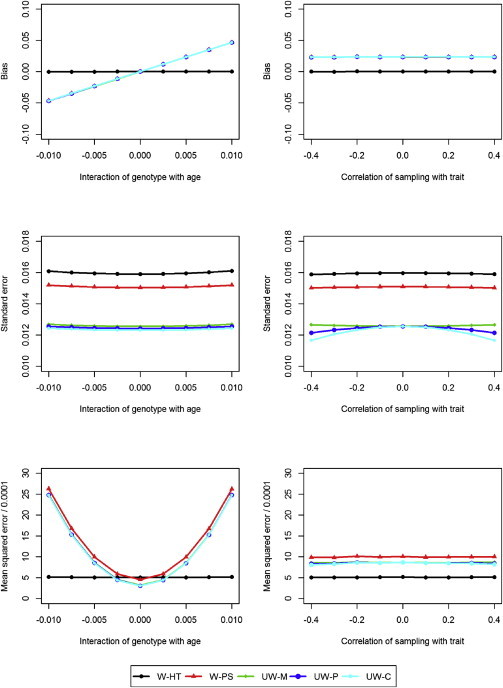
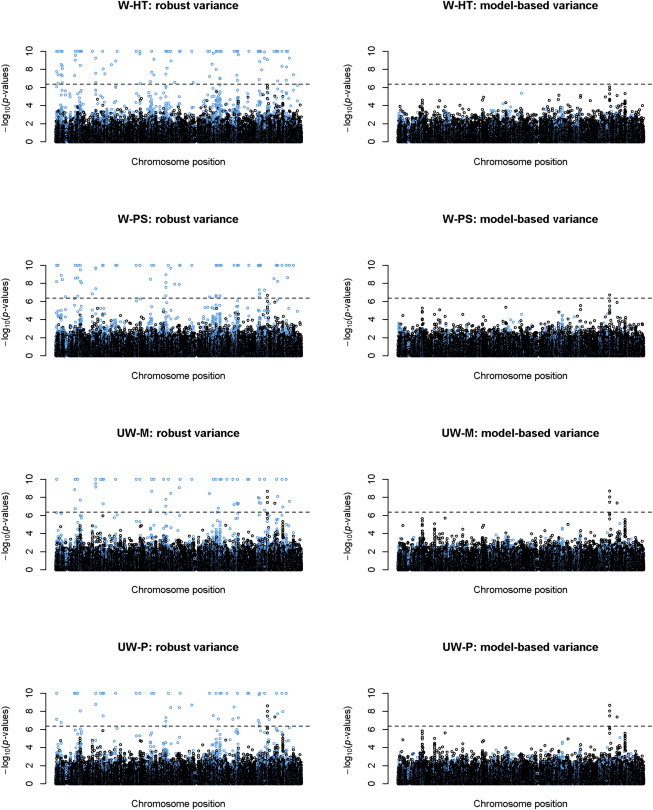
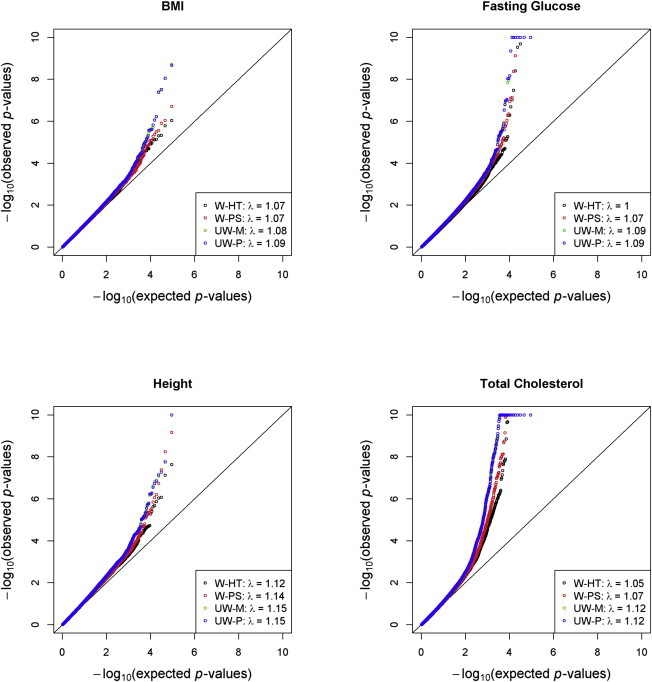
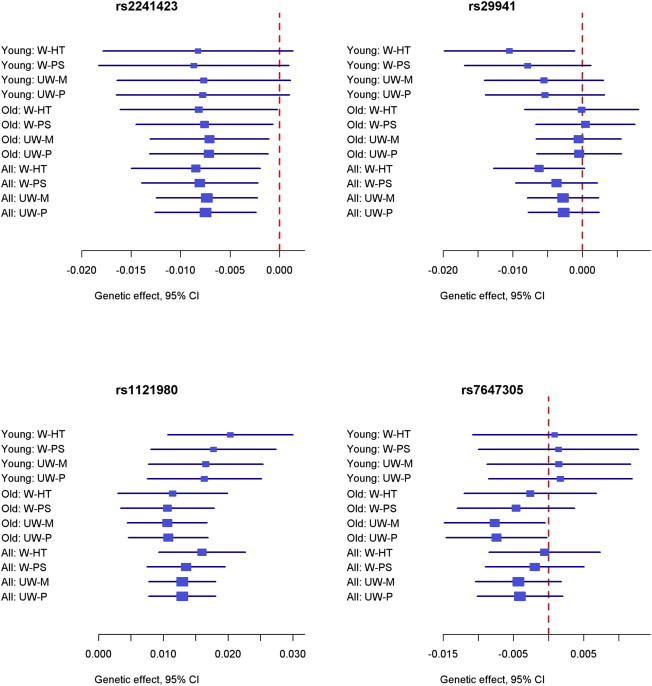
The cohort design allows investigators to explore the genetic basis of a variety of diseases and traits in a single study while avoiding major weaknesses of the case-control design. Most cohort studies employ multistage cluster sampling with unequal probabilities to conveniently select participants with desired characteristics, and participants from different clusters might be genetically related. Analysis that ignores the complex sampling design can yield biased estimation of the genetic association and inflation of the type I error. Herein, we develop weighted estimators that reflect unequal selection probabilities and differential nonresponse rates, and we derive variance estimators that properly account for the sampling design and the potential relatedness of participants in different sampling units. We compare, both analytically and numerically, the performance of the proposed weighted estimators with unweighted estimators that disregard the sampling design. We demonstrate the usefulness of the proposed methods through analysis of MetaboChip data in the Hispanic Community Health Study/Study of Latinos, which is the largest health study of the Hispanic/Latino population in the United States aimed at identifying risk factors for various diseases and determining the role of genes and environment in the occurrence of diseases. We provide guidelines on the use of weighted and unweighted estimators, as well as the relevant software.
Copyright © 2014 The American Society of Human Genetics. Published by Elsevier Inc. All rights reserved.
Figures
Comment in
-
Ethnicity: Diversity is future for genetic analysis.Nature. 2016 Dec 14;540(7633):341. doi: 10.1038/540341d. Nature. 2016. PMID: 27974770 No abstract available.
References
-
- Collins F.S. The case for a US prospective cohort study of genes and environment. Nature. 2004;429:475–477. - PubMed
-
- Manolio T.A., Bailey-Wilson J.E., Collins F.S. Genes, environment and the value of prospective cohort studies. Nat. Rev. Genet. 2006;7:812–820. - PubMed
-
- Manolio T.A. Cohort studies and the genetics of complex disease. Nat. Genet. 2009;41:5–6. - PubMed
-
- Higgins M., Province M., Heiss G., Eckfeldt J., Ellison R.C., Folsom A.R., Rao D.C., Sprafka J.M., Williams R. NHLBI Family Heart Study: objectives and design. Am. J. Epidemiol. 1996;143:1219–1228. - PubMed
-
- Löwel H., Döring A., Schneider A., Heier M., Thorand B., Meisinger C., MONICA/KORA Study Group The MONICA Augsburg surveys—basis for prospective cohort studies. Gesundheitswesen. 2005;67(1):S13–S18. - PubMed
Publication types
MeSH terms
Grants and funding
- R01 CA082659/CA/NCI NIH HHS/United States
- N01 HC065233/HL/NHLBI NIH HHS/United States
- U01HG004803/HG/NHGRI NIH HHS/United States
- R37GM047845/GM/NIGMS NIH HHS/United States
- N01 HC065234/HL/NHLBI NIH HHS/United States
- U01 HG004803/HG/NHGRI NIH HHS/United States
- N01 HC65233/HC/NHLBI NIH HHS/United States
- T32 HL007055/HL/NHLBI NIH HHS/United States
- U01 HG007416/HG/NHGRI NIH HHS/United States
- N01 HC065236/HL/NHLBI NIH HHS/United States
- R01CA082659/CA/NCI NIH HHS/United States
- N01 HC065235/HL/NHLBI NIH HHS/United States
- R37 GM047845/GM/NIGMS NIH HHS/United States
- N01-HC65234/HC/NHLBI NIH HHS/United States
- N01-HC65236/HC/NHLBI NIH HHS/United States
- P01 CA142538/CA/NCI NIH HHS/United States
- N01 HC65237/HC/NHLBI NIH HHS/United States
- N01 HC065237/HL/NHLBI NIH HHS/United States
- N01-HC65235/HC/NHLBI NIH HHS/United States
LinkOut - more resources
Full Text Sources
Other Literature Sources
Molecular Biology Databases
