. 2014 Dec;136(6):3221.
doi: 10.1121/1.4900827.

Temporal weighting functions for interaural time and level differences. IV. Effects of carrier frequency

Affiliations

Temporal weighting functions for interaural time and level differences. IV. Effects of carrier frequency

G Christopher Stecker. J Acoust Soc Am. 2014 Dec.

Abstract

Temporal variation in listeners' sensitivity to interaural time and level differences (ITD and ILD, respectively) was measured for sounds of different carrier frequency using the temporal weighting function (TWF) paradigm [Stecker and Hafter (2002) J. Acoust. Soc. Am. 112,1046-1057]. Listeners made lateralization judgments following brief trains of filtered impulses (Gabor clicks) presented over headphones with overall ITD and/or ILD ranging from ±500 μs ITD and/or ±5 dB ILD across trials. Individual clicks within each train varied by an additional ±100 μs ITD or ±2 dB ILD to allow TWF calculation by multiple regression. In separate conditions, TWFs were measured for carrier frequencies of 1, 2, 4, and 8 kHz. Consistent with past studies, TWFs demonstrated high weight on the first click for stimuli with short interclick interval (ICI = 2 ms), but flatter weighting for longer ICI (5-10 ms). Some conditions additionally demonstrated greater weight for clicks near the offset than near the middle of the train. Results support a primary role of the auditory periphery in emphasizing onset and offset cues in rapidly modulated low-frequency sounds. For slower modulations, sensitivity to ongoing high-frequency ILD and low-frequency ITD cues appears subject to recency effects consistent with the effects of leaky temporal integration of binaural information.


Figures

FIG. 1.
FIG. 1.
Stimuli employed in the study. Plotted at left are stimulus waveforms for Gabor click trains. In the upper left panel, example 16-click waveforms of each tested carrier frequency are plotted with 2-ms ICI (dotted lines). Note that only the left-ear waveform is shown, and no click-to-click variation in ITD or ILD is depicted. In the lower left panel, the ICI is 5 ms and only a subset of clicks is shown. Plotted at right of each panel are the corresponding power spectra, computed via fast Fourier transform.
FIG. 2.
FIG. 2.
TWFs for ITD-based lateralization (group data). In each panel, normalized weights wi (y-axis) are plotted for each click in a train as a function of the temporal order of the clicks (x-axis). Symbols plot the mean of normalized weights across subjects; error bars indicate bootstrapped 95% confidence intervals on the cross-subject mean. The dashed horizontal line in each panel indicates the value that would be obtained if all clicks were equally weighted (1/16), while the solid line indicates 0. From left to right, panels plot TWFs for carrier frequency of 1, 2, 4, and 8 kHz. From top to bottom, panels plot TWFs for 2 -, 5-, and 10-ms ICI.
FIG. 3.
FIG. 3.
TWFs for ITD-based lateralization (individual data). As in Fig. 2, symbols plot TWFs in the form of normalized weight wi (vertical axis) versus click number (horizontal axis). Separate panels plot TWFs for each value of ICI (rows) and carrier frequency (columns), arranged identically to Fig. 2. Different symbols plot data for individual subjects. Asterisks (*) mark clicks where a statistically significant proportion of subjects (p < 0.05) demonstrated significantly non-zero weights (also p < 0.05).
FIG. 4.
FIG. 4.
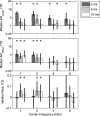
AR and rise computed for ITD conditions. Upper panel plots median AR computed for the onset click for each combination of carrier frequency (horizontal axis) and ICI (shaded bars). Bar heights plot the mean AR value across subjects in each condition and error bars indicate two-level bootstrapped 95% confidence interval on that statistic. Asterisks (*) indicate conditions with median AR > 1 based on Wilcoxon signed-rank test (one-tailed p < 0.05) of non-bootstrapped AR data (i.e., ignoring intertrial variability). Across carrier frequency, ARonset values were larger for 2-ms ICI (dark bars) than for ICI values of 5 ms (light gray bars) or 10 ms (white bars), consistent with the onset dominance apparent in the TWFs themselves (Fig. 2). Middle panel plots the median AR values computed for the offset click, but is otherwise formatted identically to the upper panel. ARoffset values were largest for low rather than high carrier frequency, but did not depend systematically on ICI. Lower panel plots rise, the slope of linear weight trend from click 2 to click 15 in each TWF. Error bars plot two-level bootstrapped confidence intervals as for AR and asterisks indicate conditions with median rise > 0 (Wilcoxon signed-rank test, one-tailed p < 0.05).
FIG. 5.
FIG. 5.
TWFs for ILD-based lateralization (group data). As in Fig. 2, symbols plot TWFs in the form of mean normalized weight, wi (vertical axis), versus click number (horizontal axis) averaged across subjects. Error bars depict bootstrapped 95% confidence intervals on the mean weight across subjects. Separate panels plot TWFs for each value of ICI (rows) and carrier frequency (columns). Panel arrangement and other formatting is identical to Fig. 2.
FIG. 6.
FIG. 6.
TWFs for ILD-based lateralization (individual data). As in Fig. 2, symbols plot TWFs in the form of normalized weight, wi (vertical axis), versus click number (horizontal axis). Separate panels plot TWFs for each value of ICI (rows) and carrier frequency (columns), arranged identically to Fig. 2. Different symbols plot data for individual subjects.
FIG. 7.
FIG. 7.
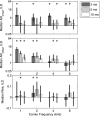
AR for ILD. As in Fig. 4, the upper panel plots mean AR computed for the onset click for each combination of carrier frequency (horizontal axis) and ICI (shaded bars). Bar heights plot the mean AR value across subjects in each condition and error bars indicate the bootstrapped 95% confidence interval on that statistic. As was the case for ITD, ARonset values were larger for 2-ms ICI (dark bars) than for ICI values of 5 ms (light gray bars) or 10 ms (white bars), but did not depend strongly on carrier frequency. The lower panel plots mean AR values computed for the offset click, but is otherwise formatted identically to the upper panel. Large ICI-dependent values of ARoffset were obtained at 1 kHz carrier frequency (leftmost bars); smaller, but significant ARoffset values were also obtained at 2 and 4 kHz, but did not vary systematically with ICI.
FIG. 8.
FIG. 8.
Experimental stimuli after transformation by auditory peripheral models. Each panel plots normalized waveforms of the input stimulus (“raw,” bottom trace) and the monaural outputs of each model; the power-law model (“pow,” second from bottom) includes effects of peripheral transduction following filtering by a single gammatone filter centered on the stimulus carrier frequency; the envelope model (“env,” second from top) features envelope extraction after peripheral filtering, and the low-pass model (“LP,” upper trace) features additional low-pass filtering of the envelope following extraction. Each waveform is normalized to its maximum value. Panels are organized as in previous figures, with carrier frequency arranged in columns from 1 kHz (left) to 8 kHz (right) and ICI arranged in rows from 2 ms (top) to 10 ms (bottom). Note that only the initial ten clicks are depicted in the plots for 10-ms ICI.
FIG. 9.
FIG. 9.
TWFs computed from binaural modeling of ITD-based lateralization. Symbols plot normalized TWFs computed based on binaural cross-correlation of auditory-filtered waveforms (“power-law,” gray circles), their envelopes (“envelope,” black circles), or low-pass-filtered versions of the envelopes (“low-pass,” white diamonds). TWFs were estimated from 500 simulated psychophysical trials in each condition, selecting the peak of the binaural cross-correlation function (after averaging across frequency bands) as the “lateralization response” on each trial. Symbols plot weights computed as for behavioral data, normalized to the maximum weight in each TWF for plotting. Thick gray line in each panel plots the overall mean TWF from behavioral data for ITD (i.e., the data from Fig. 2), here normalized to the maximum weight in each TWF. Panels are organized as in Fig. 2, with carrier frequencies left to right and ICI top to bottom. Note that auditory peripheral effects, as incorporated in the model, account for some degree of onset and offset weight elevation at short ICI. Low-pass filtering of envelope representations further enhances these effects and extends them to 5-ms ICI at low frequencies. Model TWFs do not suggest gradually increasing weights over the sound duration (i.e., upweighting) for any combination of frequency and ICI.
FIG. 10.
FIG. 10.
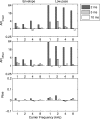
AR and rise values for model TWFs plotted in Fig. 9. Formatted similarly to Fig. 4, values of ARonset (top panel), ARoffset (middle panel), and rise (bottom panel) are plotted for simulations using the envelope (left side of each plot) and low-pass (right side) versions of the TWF model. Data for the “power-law” model have been omitted for clarity, as very little weight variation (and, thus, negligible values on all three statistics) was observed in TWFs for that condition. Envelope model TWFs capture the ICI-dependent elevations of onset and offset weights (AR > 1) present in the human data at low frequencies, but fail to capture any gradual trends in weight over time (i.e., rise = 0). Low-pass model TWFs exaggerate these effects, but overestimate the degree of AR present in the human data, and incorrectly predict large offset weights (ARoffset > 1) even at 4–8 kHz.

Similar articles

Cited by

References

    1. Abel, S. M., and Kunov, H. (1983). “ Lateralization based on interaural phase differences: Effects of frequency, amplitude, duration, and shape of rise/decay,” J. Acoust. Soc. Am. 73, 955–960.10.1121/1.389020 - DOI - PubMed
    1. Akeroyd, M. A. (2001). “ A binaural cross-correlogram toolbox for MATLAB,” Technical Report, University of Connecticut Health Center/University of Sussex, software downloadable from http://www.ihr.mrc.ac.uk/projects/matlab/binaural_toolbox (Last viewed 10 Oct. 2014).
    1. Akeroyd, M. A., and Bernstein, L. R. (2001). “ The variation across time of sensitivity to interaural disparities: Behavioral measurements and quantitative analyses,” J. Acoust. Soc. Am. 110, 2516–2526.10.1121/1.1412442 - DOI - PubMed
    1. Bernstein, L. R., and Trahiotis, C. (1994). “ Detection of interaural delay in high-frequency sinusoidally amplitude-modulated tones, two-tone complexes, and bands of noise,” J. Acoust. Soc. Am. 95, 3561–3567.10.1121/1.409973 - DOI - PubMed
    1. Bernstein, L. R., and Trahiotis, C. (1996). “ The normalized correlation: Accounting for binaural detection across center frequency,” J. Acoust. Soc. Am. 100, 3774–3784.10.1121/1.417237 - DOI - PubMed

Publication types