. 2014 Dec;136(6):3262.
doi: 10.1121/1.4901714.

Modeling the effects of a posterior glottal opening on vocal fold dynamics with implications for vocal hyperfunction

Affiliations

Modeling the effects of a posterior glottal opening on vocal fold dynamics with implications for vocal hyperfunction

Matías Zañartu et al. J Acoust Soc Am. 2014 Dec.

Abstract

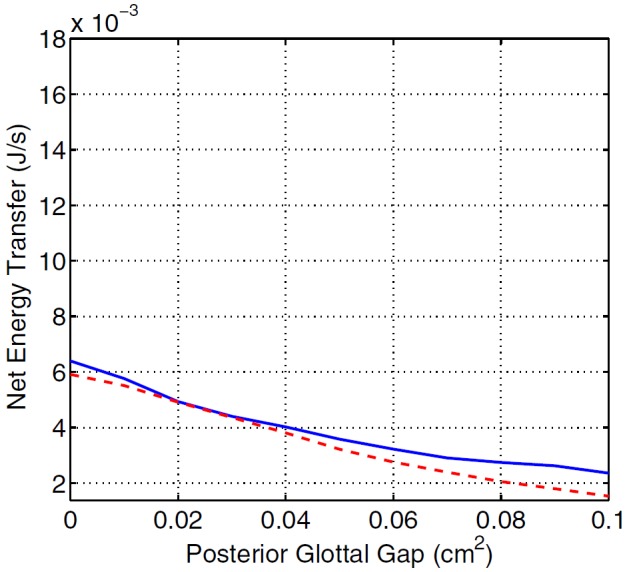
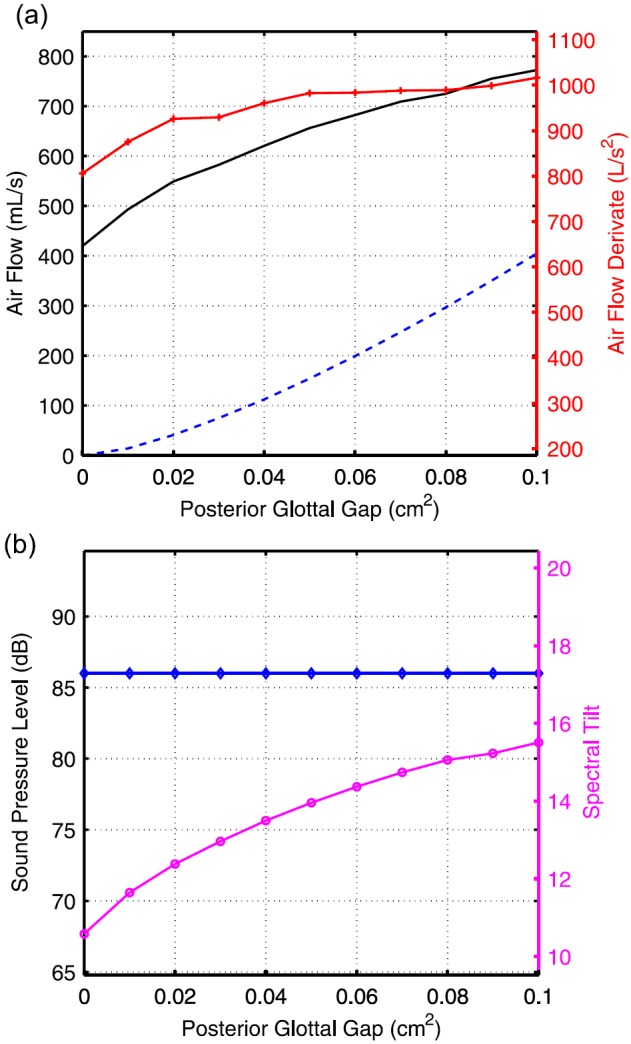
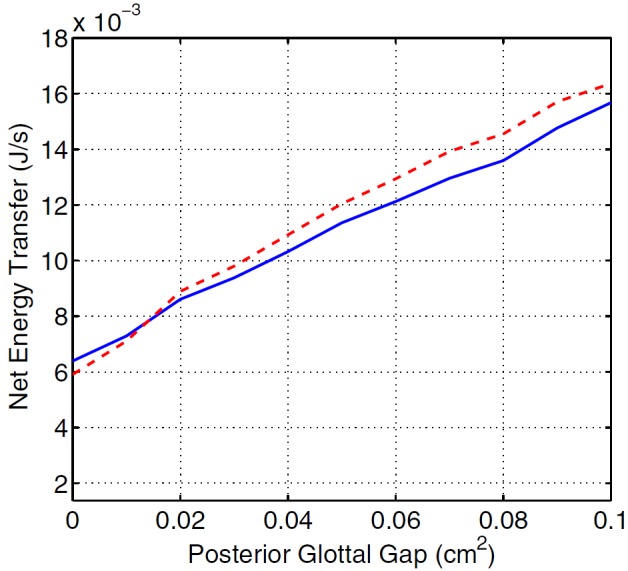
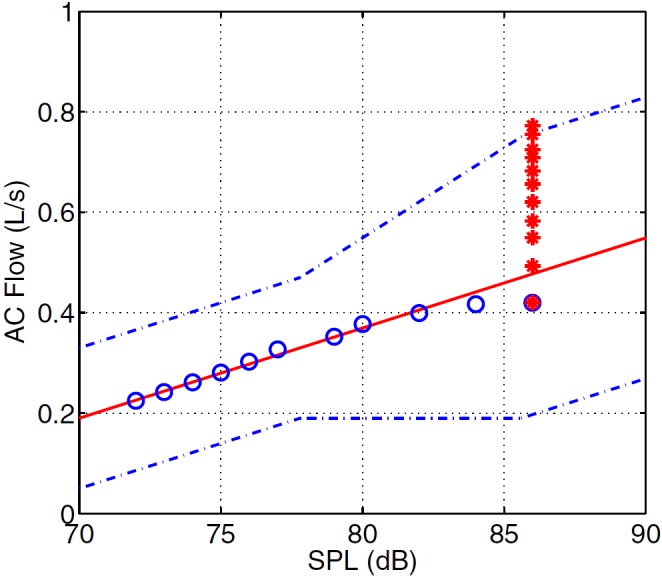
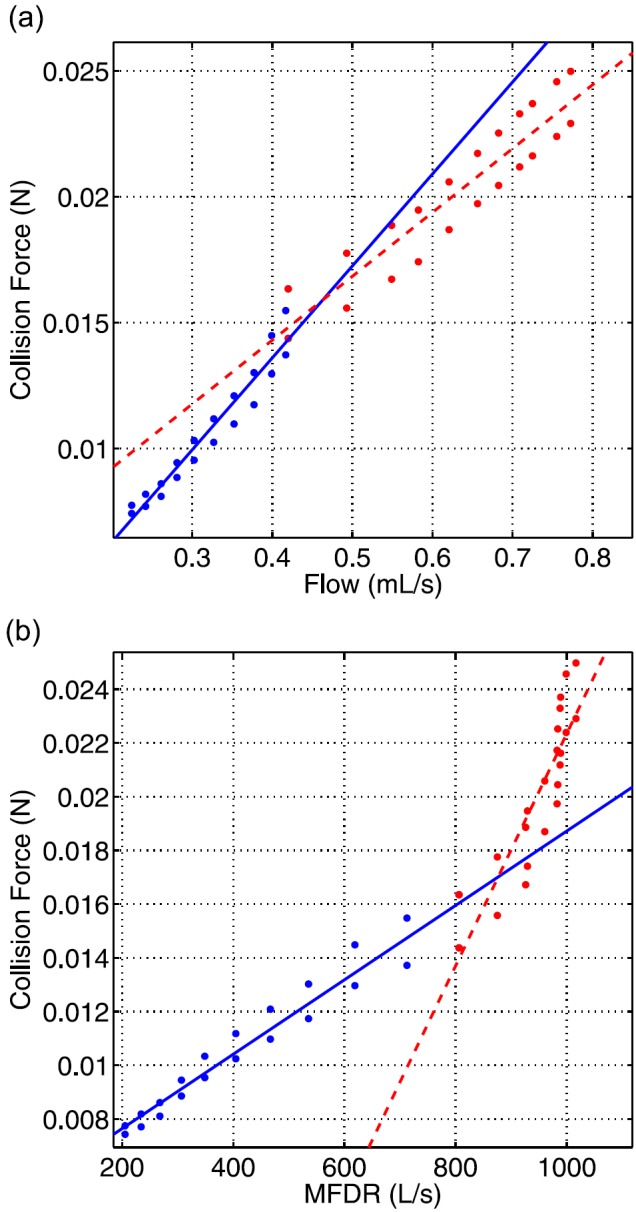
Despite the frequent observation of a persistent opening in the posterior cartilaginous glottis in normal and pathological phonation, its influence on the self-sustained oscillations of the vocal folds is not well understood. The effects of a posterior gap on the vocal fold tissue dynamics and resulting acoustics were numerically investigated using a specially designed flow solver and a reduced-order model of human phonation. The inclusion of posterior gap areas of 0.03-0.1 cm(2) reduced the energy transfer from the fluid to the vocal folds by more than 42%-80% and the radiated sound pressure level by 6-14 dB, respectively. The model was used to simulate vocal hyperfucntion, i.e., patterns of vocal misuse/abuse associated with many of the most common voice disorders. In this first approximation, vocal hyperfunction was modeled by introducing a compensatory increase in lung air pressure to regain the vocal loudness level that was produced prior to introducing a large glottal gap. This resulted in a significant increase in maximum flow declination rate and amplitude of unsteady flow, thereby mimicking clinical studies. The amplitude of unsteady flow was found to be linearly correlated with collision forces, thus being an indicative measure of vocal hyperfunction.


Figures

FIG. 1.
FIG. 1.
Three-dimensional representation of the body cover model showing the posterior glottal opening, the vocal fold masses (body and cover), and the membranous area.
FIG. 2.
FIG. 2.
Diagram representing the vocal fold area, the trachea area, and the posterior glottal opening used for calculation of the flow.
FIG. 3.
FIG. 3.
(Color online) Resulting glottal airflow with proposed PGO method (–), uncoupled Bernoulli flow solution (- -), and highly coupled airflow solution (-.-).
FIG. 4.
FIG. 4.
(Color online) Effect of the posterior glottal gap on selected glottal measures: (a) AC flow (–, left axis), DC flow (- -, left axis), MFDR (-+-, right axis) (b) SPL (--, left axis) and Spectral tilt (-∘-, right axis).
FIG. 5.
FIG. 5.
(Color online) Net energy transfer vs PGO. Upper cover mass (–), lower cover mass (- -).
FIG. 6.
FIG. 6.
(Color online) Effect of the posterior glottal opening on selected glottal measures with sub glottal pressure compensation: (a) AC flow (–, left axis), DC flow (- -, left axis), MFDR (-+-, right axis), (b) SPL (-⋄-, left axis) and Spectral tilt (-∘-, right axis).
FIG. 7.
FIG. 7.
(Color online) Net energy transfer vs PGO. Upper cover mass (–), lower cover mass (- -).
FIG. 8.
FIG. 8.
(Color online) Illustration of the computation of regressed Z-scores for AC Flow. Mean values of AC Flow are linearly related to SPL (–), and ±2 standard deviations across SPL (- -). Simulations for various gap areas for the non-compensated scenario are shown in circles, and those for the compensated scenario in asterisks.
FIG. 9.
FIG. 9.
(Color online) Relation between measures and collision forces: (a) Collision force vs ac-flow, not compensated (–, R2 = 0.93570), SPL compensated (- -, R2 = 0.83806). (b) Collision force vs MFDR, not compensated (–, R2 = 0.94006), SPL compensated (- -, R2 = 0.73927).

References

    1. Linville S., “ Glottal gap configurations in two age groups of women,” J. Speech Hear. Res. 35, 1209–1215 (1992).10.1044/jshr.3506.1209 - DOI - PubMed
    1. Holmberg E. B., Hillman R. E., and Perkell J. S., “ Comparisons among aerodynamic, electroglotto graphic, and acoustic spectral measures of female voice,” J. Speech Hear. Res. 38, 1212–1223 (1995).10.1044/jshr.3806.1212 - DOI - PubMed
    1. Hanson H. M., “ Glottal characteristics of female speakers: Acoustic correlates,” J. Acoust. Soc. Am. 101, 466–481 (1997).10.1121/1.417991 - DOI - PubMed
    1. Story B. H. and Bunton K., “ Production of child-like vowels with nonlinear interaction of glottal flow and vocal tract resonances,” Proc. Meet. Acoust. 19, 060303 (2013).10.1121/1.4798416 - DOI
    1. Holmberg E. B., Hillman R. E., and Perkell J. S., “ Glottal air-flow and transglottal air-pressure measurements for male and female speakers in soft, normal, and loud voice,” J. Acoust. Soc. Am. 84, 511–529 (1988).10.1121/1.396829 - DOI - PubMed

Publication types