. 2014 Dec:9:40-51.
doi: 10.1016/j.epidem.2014.09.011. Epub 2014 Oct 7.

Synthesizing data and models for the spread of MERS-CoV, 2013: key role of index cases and hospital transmission

Affiliations

Synthesizing data and models for the spread of MERS-CoV, 2013: key role of index cases and hospital transmission

Gerardo Chowell et al. Epidemics. 2014 Dec.

Abstract

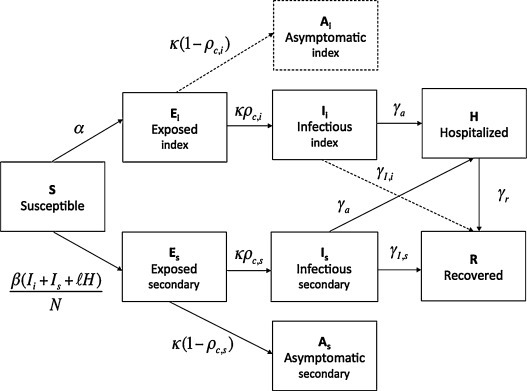
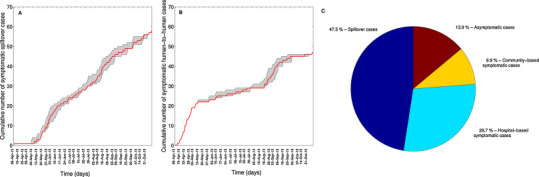
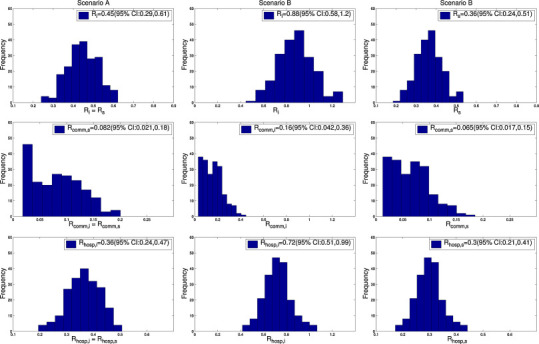
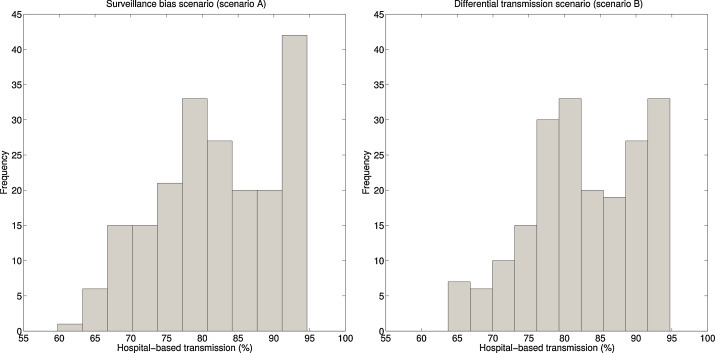
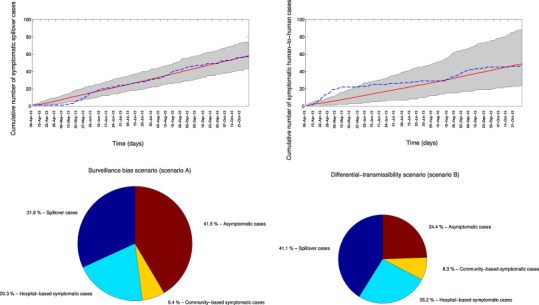
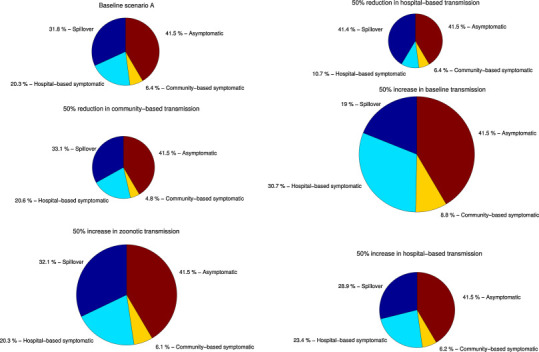
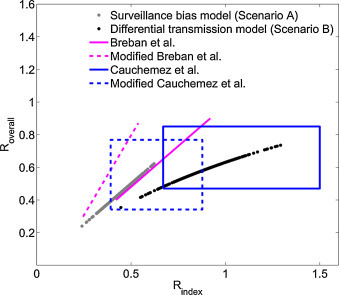
The outbreak of Middle East respiratory syndrome coronavirus (MERS-CoV) has caused 209 deaths and 699 laboratory-confirmed cases in the Arabian Peninsula as of June 11, 2014. Preparedness efforts are hampered by considerable uncertainty about the nature and intensity of human-to-human transmission, with previous reproduction number estimates ranging from 0.4 to 1.5. Here we synthesize epidemiological data and transmission models for the MERS-CoV outbreak during April-October 2013 to resolve uncertainties in epidemic risk, while considering the impact of observation bias. We match the progression of MERS-CoV cases in 2013 to a dynamic transmission model that incorporates community and hospital compartments, and distinguishes transmission by zoonotic (index) cases and secondary cases. When observation bias is assumed to account for the fact that all reported zoonotic cases are severe, but only ∼ 57% of secondary cases are symptomatic, the average reproduction number of MERS-CoV is estimated to be 0.45 (95% CI:0.29-0.61). Alternatively, if these epidemiological observations are taken at face value, index cases are estimated to transmit substantially more effectively than secondary cases, (Ri = 0.84 (0.58-1.20) vs R(s) = 0.36 (0.24-0.51)). In both scenarios the relative contribution of hospital-based transmission is over four times higher than that of community transmission, indicating that disease control should be focused on hospitalized patients. Adjusting previously published estimates for observation bias confirms a strong support for the average R < 1 in the first stage of the outbreak in 2013 and thus, transmissibility of secondary cases of MERS-CoV remained well below the epidemic threshold. More information on the observation process is needed to clarify whether MERS-CoV is intrinsically weakly transmissible between people or whether existing control measures have contributed meaningfully to reducing the transmissibility of secondary cases. Our results could help evaluate the progression of MERS-CoV in recent months in response to changes in disease surveillance, control interventions, or viral adaptation.

Keywords: Community; Epidemic modeling; Hospital; Index cases; Middle East respiratory syndrome; Reproduction number.


Figures

Fig. 1
Fig. 1
Schematic representation of the transition of cases (indicated by arrows) among the different epidemiological states in our model (Text S1). Under ‘surveillance bias’ scenario A, index (zoonotic) and secondary cases follow a similar epidemiological progression (full model). Under ‘transmission bias’ scenario B, index and secondary cases follow a different epidemiological progression: all index cases are symptomatic, develop severe disease, and require hospitalization (i.e., compartmental model in which the dashed arrows and compartment are removed). We assume that only the symptomatic cases are observed. The description and corresponding estimates of the epidemiological parameters are given in Table 1.
Fig. 2
Fig. 2
Temporal progression of MERS-CoV symptomatic cases according to exposure history by date of symptom onset, 08-April 2013 to 27-October 2013, Saudi Arabia (A and B). The gray shading shows the range of 500 cumulative curves obtained from the imputation strategy because the date of symptom onset was not available for all cases. The red solid line is the mean of the ensemble of curves. The overall percentage contribution of index cases, hospital-based symptomatic cases, community-based symptomatic cases, and asymptomatic cases to the total number of reported cases are also shown (C).
Fig. 3
Fig. 3
Distributions of the reproduction numbers for index and secondary cases and the relative contributions of community and hospitalized cases according to each epidemiological scenario. Scenario A: ‘Surveillance bias”. Scenario B: ‘Transmission bias’ (see text).
Fig. 4
Fig. 4
The percentage contribution of hospital-based transmission to the reproduction number of secondary cases for the surveillance bias and the transmission bias scenarios. Similar hospital-based contributions were obtained for index cases for both epidemiological scenarios (not shown).
Fig. 5
Fig. 5
Temporal variation in MERS symptomatic cases associated with index (zoonotic) events and secondary (human-to-human) transmission as predicted from the model fit to the data according to epidemiological scenario A (‘Surveillance bias’, top). The mean (red solid line) and 95% uncertainty bounds (gray shading) generated from stochastic simulation as described in the text are shown. The blue dashed line is the approximate observed progression of symptomatic MERS-CoV cases by date of symptom onset (onset dates imputed as in Fig. 2). The overall percentage contribution of index cases, hospital-based symptomatic cases, community-based symptomatic cases, and asymptomatic cases to the total number of cases according for each epidemiological scenario are also shown (bottom). The radius of the pie chart for scenario B (‘transmission bias’) was scaled proportionally according to the total number of cases predicted from scenario A. (For interpretation of the references to color in this figure legend, the reader is referred to the web version of this article.)
Fig. 6
Fig. 6
The effect of control interventions relatively to ‘surveillance bias’ scenario A (targeting hospital or community-based transmission) as well as the effect of potential pathogen adaptation to humans (increase in baseline transmission rate), and geographic spread with potential increases in reservoir spillover rate (via parameter alpha) or hospital-based transmission (via parameter l). The percentage contribution of index cases, hospital-based symptomatic cases, community-based symptomatic cases, and asymptomatic cases to the total number of cases according for each epidemiological scenario are shown. The radiuses of the pie charts were scaled proportionally according to the total number of cases predicted from the baseline scenario A.
Fig. 7
Fig. 7
Synthesizing available estimates for the reproduction number of MERS CoV. The 95% confidence intervals for the reproduction number averaged over all cases (Roverall) and averaged over index cases (Ri) are shown. Besides the two transmission scenarios considered in this study (black and gray dots), the plot includes results of Breban et al. (2013) and Cauchemez et al. (2014). The key distinction among the models are that Breban et al. (2013) modeled primary and secondary transmission as being similar; Cauchemez et al. (2014) used the timing of cases to estimate Ri; our differential transmission model accounts for the higher observed disease severity of index cases; and our surveillance bias model considers the possibility that all weakly transmitting and asymptomatic index cases are unobserved. A modified version of Breban et al. and Cauchemez et al. are also shown in the plot that compensate for the possibility of unobserved index cases and thus allow direct comparison to our surveillance bias model. Cauchemez et al.’s results are presented as a confidence region because their inference of Roverall was separate from their inference of Ri. All the other models contain an intrinsic dependence between Roverall and Ri and so these results are presented as a curve.

References

    1. Aburizaiza A.S., Mattes F.M., Azhar E.I., Hassan A.M., Memish Z.A. Investigation of anti-MERS-Coronavirus antibodies in blood donors and abbatoir workers in Jeddah and Makkah, Kingdom of Saudi Arabia, fall 2012. J. Infect. Dis. 2013;209(2):243–246. doi: 10.1093/infdis/jit589. - DOI - PMC - PubMed
    1. Alagaili A.N., Briese T., Mishra N., Kapoor V., Sameroff S.C. Middle East respiratory syndrome coronavirus infection in dromedary camels in Saudi Arabia. MBio. 2014;5(2) doi: 10.1128/mBio.00884-14. e00884-14. - DOI - PMC - PubMed
    1. Anderson R.M., May R.M. Oxford University Press; Oxford: 1991. Infectious Diseases of Humans.
    1. Assiri A., McGeer A., Perl T.M., Price C.S., Al Rabeeah A.A. Hospital outbreak of Middle East respiratory syndrome coronavirus. N. Engl. J. Med. 2013;369:407–416. - PMC - PubMed
    1. Assiri A., Al-Tawfiq J.A., Al-Rabeeah A.A., Al-Rabiah F.A., Al-Hajjar S. Epidemiological, demographic, and clinical characteristics of 47 cases of Middle East respiratory syndrome coronavirus disease from Saudi Arabia: a descriptive study. Lancet Infect. Dis. 2013;13:752–761. - PMC - PubMed

Publication types

MeSH terms