. 2014 Dec:9:70-8.
doi: 10.1016/j.epidem.2014.09.003. Epub 2014 Oct 6.

Potential for large outbreaks of Ebola virus disease

Affiliations

Potential for large outbreaks of Ebola virus disease

A Camacho et al. Epidemics. 2014 Dec.

Abstract

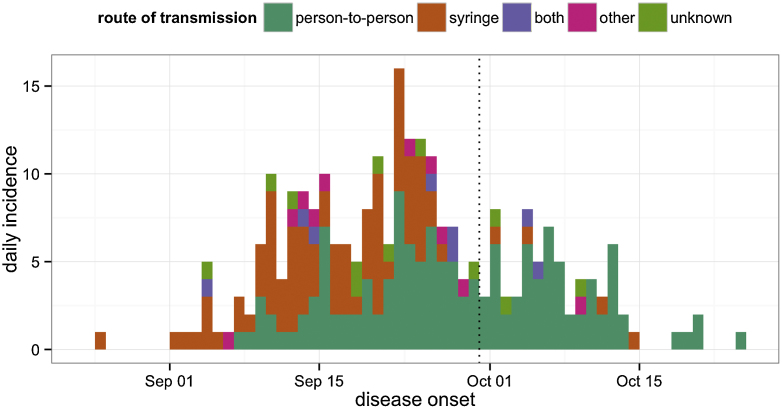
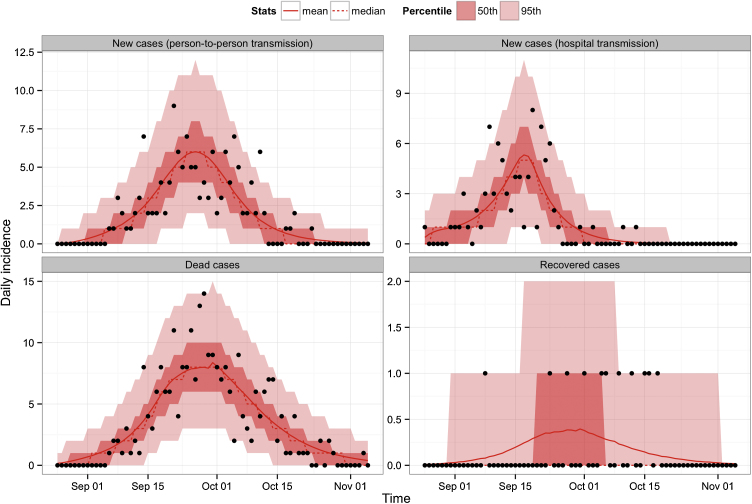
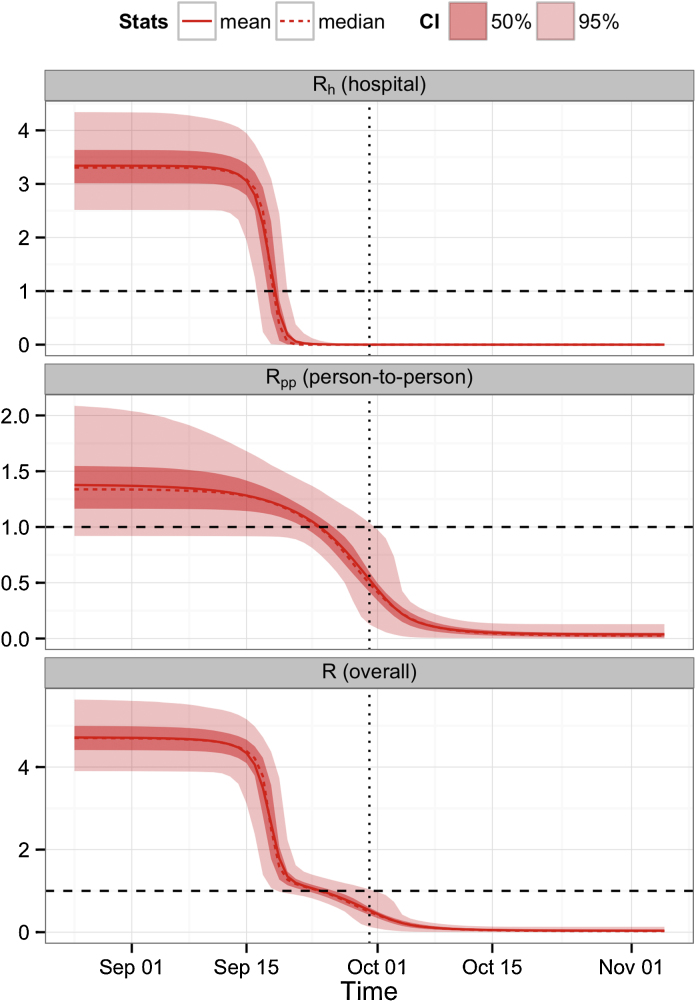
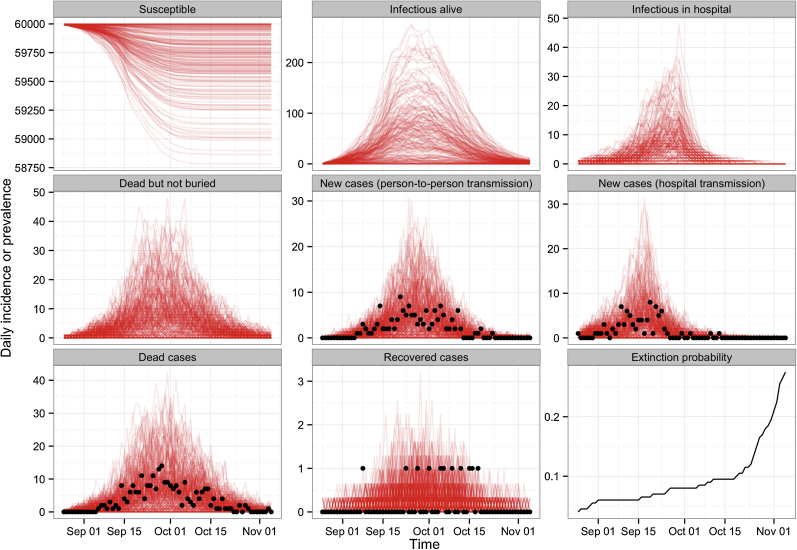
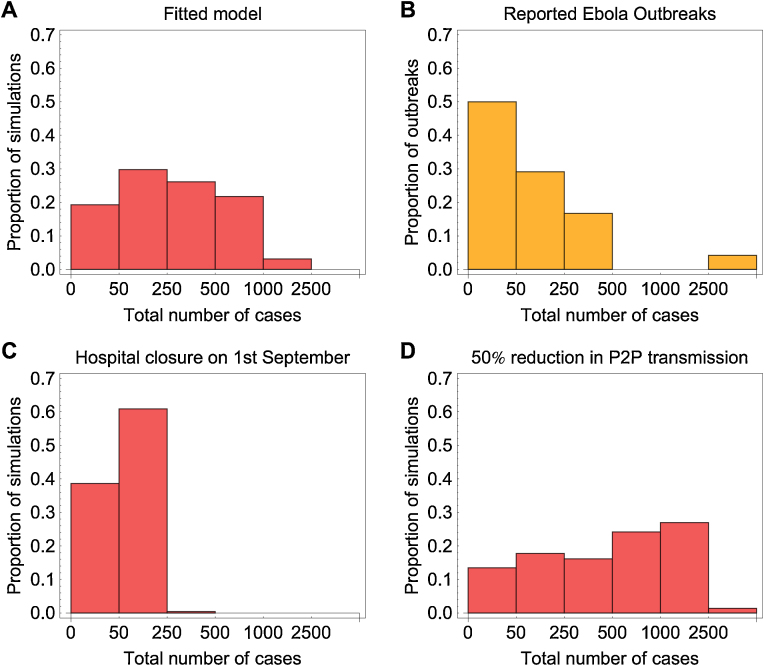
Outbreaks of Ebola virus can cause substantial morbidity and mortality in affected regions. The largest outbreak of Ebola to date is currently underway in West Africa, with 3944 cases reported as of 5th September 2014. To develop a better understanding of Ebola transmission dynamics, we revisited data from the first known Ebola outbreak, which occurred in 1976 in Zaire (now Democratic Republic of Congo). By fitting a mathematical model to time series stratified by disease onset, outcome and source of infection, we were able to estimate several epidemiological quantities that have previously proved challenging to measure, including the contribution of hospital and community infection to transmission. We found evidence that transmission decreased considerably before the closure of the hospital, suggesting that the decline of the outbreak was most likely the result of changes in host behaviour. Our analysis suggests that the person-to-person reproduction number was 1.34 (95% CI: 0.92-2.11) in the early part of the outbreak. Using stochastic simulations we demonstrate that the same epidemiological conditions that were present in 1976 could have generated a large outbreak purely by chance. At the same time, the relatively high person-to-person basic reproduction number suggests that Ebola would have been difficult to control through hospital-based infection control measures alone.

Keywords: 1976 Zaire outbreak; Basic reproduction number; Ebola; Mathematical model.


Figures

Fig. 1
Fig. 1
Daily incidence time series of Ebola virus disease onsets in 1976. Cases are coloured by route of transmission, as reported by the epidemiological investigation team (Breman et al., 1978). ‘Both’ indicates infections that could have come from syringe or person-to-person transmission; ‘other’ denotes alternative infection routes (mainly congenital). The dotted line corresponds to the hospital closure date (30th September). (For interpretation of the references to color in this figure legend, the reader is referred to the web version of this article.)
Fig. 2
Fig. 2
Schematic of model structure. Individuals start off susceptible to infection (S). Upon infection they enter an incubation period (E), then at symptom onset they become infectious in the community (I). After this point, they either: enter a recovered state (R); remain infectious and go into hospital (H); or die and remain infectious (D) until buried (B). Hospitalised infectives also move either into the recovered or dead compartment. Finally, the E compartment is split according to the route of transmission in order to keep track whether a case was infected via contaminated syringes at the hospital (Eh) or by person-to-person contact (Epp) with either an infective in the community or a dead but not buried case. The forces of infection for the two transmission processes are λh(t) = βh(t)H/N and λpp(t) = (βi(t)I + βd(t)D)/N, where βh(t), βi(t) and βd(t) are the time-varying transmission rates given by Eq. (1). Other parameters are as follows: ϵ, inverse of the mean incubation period; γh, γd and γr, inverse of the mean duration from symptom onset to hospitalization, death and recovery respectively; νd and νr, inverse of the mean duration from hospitalization to death and recovery respectively (see Eq. (7)); μb, inverse of the mean duration from death to burial; κi(t) is computed to ensure that the overall hospitalisation rate is equal to κ until hospital closure (see Eq. (5)); ϕi and ϕh are computed to ensure that the overall case–fatality ratio is equal to ϕ (see Eq. (4)). Parameter values and prior assumptions can be found in Table 2. The model was simulated by integrating the set (3) of ordinary differential equations using the SSM library (Dureau et al., 2013).
Fig. 3
Fig. 3
Comparison of our fitted model and observed daily incidence time series (black dots) reconstructed from the line list of Ebola cases in Zaire in 1976. The mean and median fits are represented by solid and dashed red lines respectively. The dark and light red shaded areas correspond to the 50% and 95% credible intervals. (For interpretation of the references to color in this figure legend, the reader is referred to the web version of this article.)
Fig. 4
Fig. 4
Drop in the reproduction number (R(t)) owing to change of behaviour in community contacts and visit of outpatients to the hospital. The overall R (lower panel) can be split into an hospital (upper panel) and person-to-person (middle panel) component. The dashed line indicates the epidemic threshold (R = 1) and the dotted line corresponds to the hospital closure (30th September). Solid, dashed and shaded red lines/area as in Fig. 3. (For interpretation of the references to color in this figure legend, the reader is referred to the web version of this article.)
Fig. 5
Fig. 5
Potential alternative trajectories of an Ebola outbreak in Yambuku. Ten thousand stochastic simulations were run with parameter values taken from the maximum a posteriori probability estimate (for readability only the first 200 are plotted). For comparison, data are plotted as black dotted points.
Fig. 6
Fig. 6
Distribution of Ebola outbreak sizes in different scenarios. (A) Outbreak size distribution from 10,000 stochastic simulations using the maximum a posteriori probability estimate. (B) Distribution of number of cases reported in Ebola outbreaks in Africa from 1976 to present. (C) Outbreak size distribution from 10,000 stochastic simulations when hospital is closed 7 days after the date of the first onset (i.e. 1st September). All other parameters remain the same. (D) Outbreak size distribution from 10,000 stochastic simulations when person-to-person transmission is reduced by 50% rather than 98%. The final category includes all outbreaks with more than 2500 cases.

References

    1. Baize S., Pannetier D., Oestereich L., Rieger T., Koivogui L., Magassouba N., Soropogui B., Sow M.S., Keï ta S., De Clerck H., Tiffany A., Dominguez G., Loua M., Traoré A., Kolié M., Malano E.R., Heleze E., Bocquin A., Mély S., Raoul H., Caro V., Cadar D., Gabriel M., Pahlmann M., Tappe D., Schmidt-Chanasit J., Impouma B., Diallo A.K., Formenty P., Van Herp M., Günther S. Emergence of Zaire Ebola Virus Disease in Guinea: Preliminary Report. N. Engl. J. Med. 2014 - PubMed
    1. Borchert M., Mutyaba I., Van Kerkhove M.D., Lutwama J., Luwaga H., Bisoborwa G., Turyagaruka J., Pirard P., Ndayimirije N., Roddy P. Ebola haemorrhagic fever outbreak in Masindi District, Uganda: outbreak description and lessons learned. BMC Infect. Dis. 2011;11:357. - PMC - PubMed
    1. Breman J., Piot P., Johnson K., White M., Mbuyi M., Sureau P., Heymann D., Van Nieuwenhove S., McCormick J., Ruppol J. The epidemiology of Ebola hemorrhagic fever in Zaire 1976. In: Pattyn S.R., editor. Ebola Virus Haemorrhagic Fever. Elsevier; Amsterdam, The Netherlands: 1978. pp. 85–97.
    1. Centers for Disease Control and Prevention . 2014. Outbreaks Chronology: Ebola Hemorrhagic Fever.http://www.cdc.gov/vhf/ebola/resources/outbreak-table.html
    1. Chowell G., Hengartner N.W., Castillo-Chavez C., Fenimore P.W., Hyman J.M. The basic reproductive number of Ebola and the effects of public health measures: the cases of Congo and Uganda. J. Theor. Biol. 2004;229:119–126. - PubMed

Publication types

MeSH terms