. 2014 Oct 29;45(1):112.
doi: 10.1186/s13567-014-0112-9.

Immunity, safety and protection of an Adenovirus 5 prime--Modified Vaccinia virus Ankara boost subunit vaccine against Mycobacterium avium subspecies paratuberculosis infection in calves

Affiliations

Immunity, safety and protection of an Adenovirus 5 prime--Modified Vaccinia virus Ankara boost subunit vaccine against Mycobacterium avium subspecies paratuberculosis infection in calves

Tim J Bull et al. Vet Res. .

Abstract

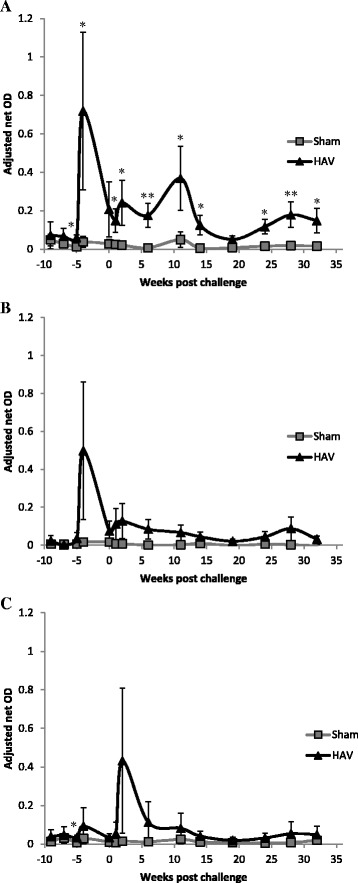
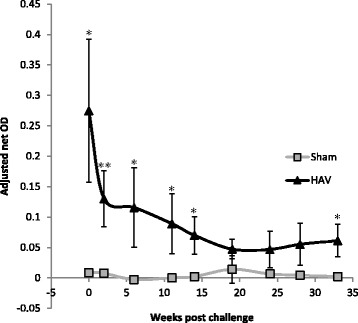
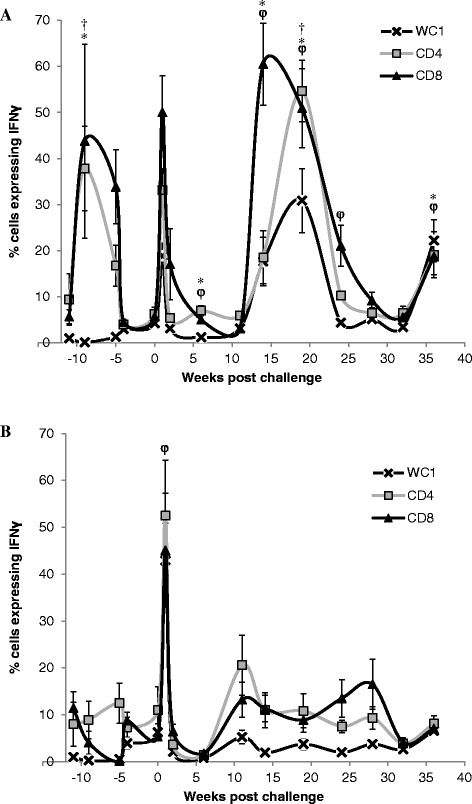
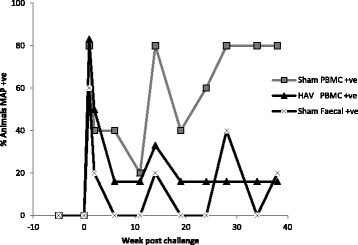
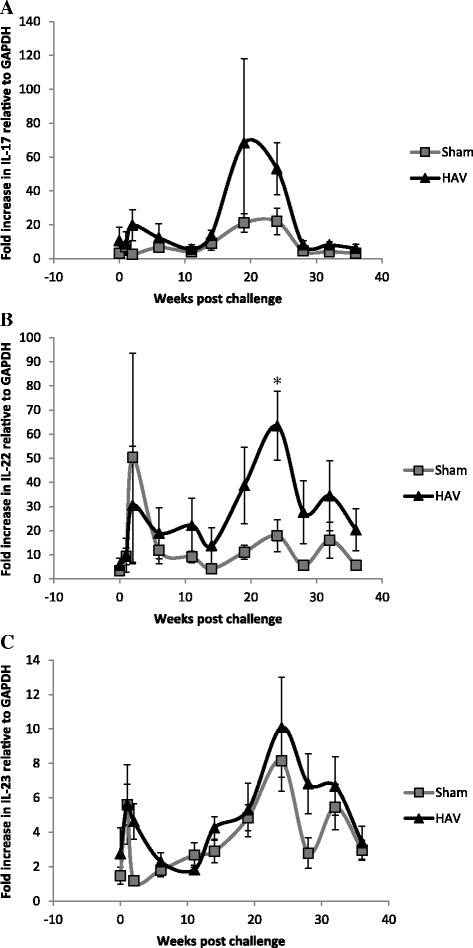
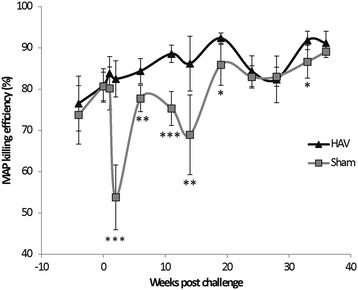
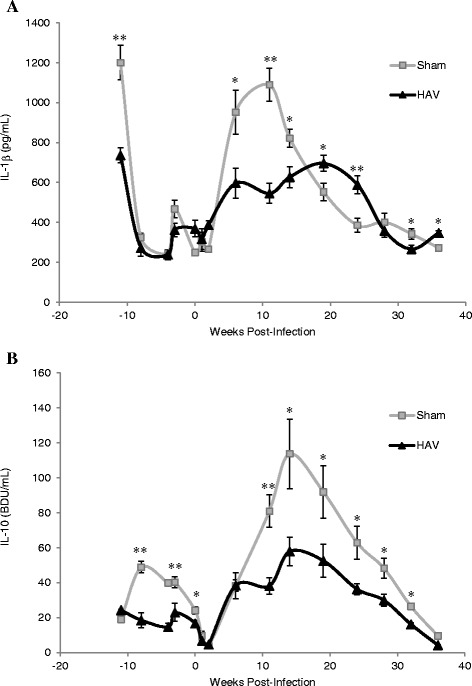
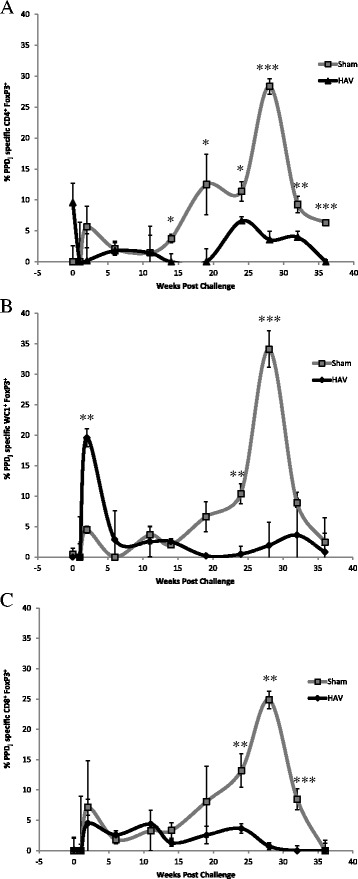
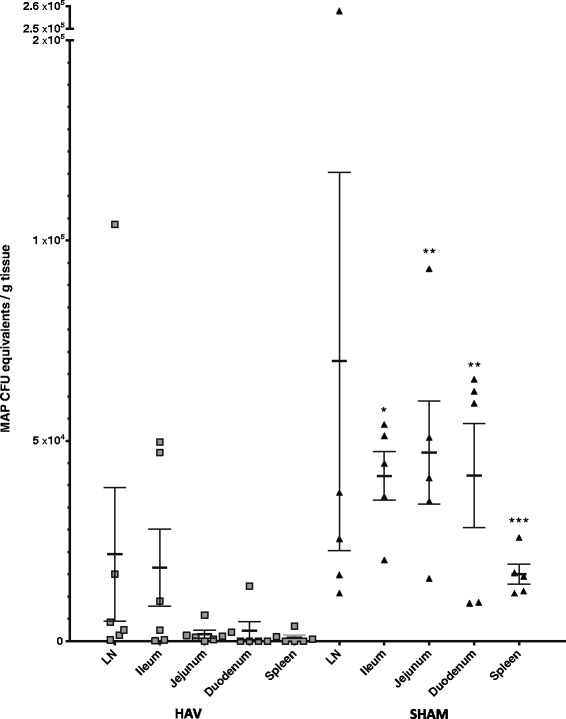
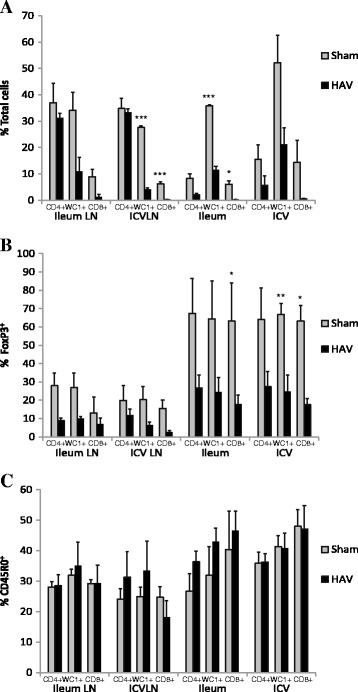
Vaccination is the most cost effective control measure for Johne's disease caused by Mycobacterium avium subspecies paratuberculosis (MAP) but currently available whole cell killed formulations have limited efficacy and are incompatible with the diagnosis of bovine tuberculosis by tuberculin skin test. We have evaluated the utility of a viral delivery regimen of non-replicative human Adenovirus 5 and Modified Vaccinia virus Ankara recombinant for early entry MAP specific antigens (HAV) to show protection against challenge in a calf model and extensively screened for differential immunological markers associated with protection. We have shown that HAV vaccination was well tolerated, could be detected using a differentiation of infected and vaccinated animals (DIVA) test, showed no cross-reactivity with tuberculin and provided a degree of protection against challenge evidenced by a lack of faecal shedding in vaccinated animals that persisted throughout the 7 month infection period. Calves given HAV vaccination had significant priming and boosting of MAP derived antigen (PPD-J) specific CD4+, CD8+ IFN-γ producing T-cell populations and, upon challenge, developed early specific Th17 related immune responses, enhanced IFN-γ responses and retained a high MAP killing capacity in blood. During later phases post MAP challenge, PPD-J antigen specific IFN-γ and Th17 responses in HAV vaccinated animals corresponded with improvements in peripheral bacteraemia. By contrast a lack of IFN-γ, induction of FoxP3+ T cells and increased IL-1β and IL-10 secretion were indicative of progressive infection in Sham vaccinated animals. We conclude that HAV vaccination shows excellent promise as a new tool for improving control of MAP infection in cattle.


Figures

Figure 1
Figure 1
Whole blood PPD-J stimulated IFN-γ release assay. IFN-γ release from A. PPD-J, B. PPD-A, C. PPD-B stimulated whole blood taken from HAV vaccinated (black triangles) and Sham vaccinated (grey squares) calves including samples taken week -11, immediately prior prime vaccination; week -5, immediately prior boost vaccination; week 0, immediately prior to MAP challenge and up to 33 weeks post challenge. OD values are adjusted to internal controls to remove assay variation between runs. Significance indicated as *P <0.05, **P <0.01.
Figure 2
Figure 2
DIVA testing. IFN-γ release from HAV specific peptide pool stimulated whole blood taken from HAV vaccinated (triangles) and Sham vaccinated (squares) calves between week 0, immediately prior to MAP challenge and 33 weeks post challenge. OD values are adjusted to internal controls to remove assay variation between runs. Significance indicated as * P < 0.05.
Figure 3
Figure 3
Intracytoplasmic expression of IFN-γ by sub-populations of peripheral T cells in HAV and Sham-vaccinated calves. Percentage of live CD4+ (squares), CD8 + (triangles) WC1 + (crosses) expressing IFN-γ after 24 h stimulation with PPD-J from A. HAV vaccinated calves B. Sham vaccinated calves including samples taken week -11, immediately prior prime vaccination; week -5, immediately prior boost vaccination; week 0, immediately prior to MAP challenge and up to 36 weeks post challenge. Significant differences between groups in A. and B. of P < 0.05 are indicated as † (CD4+), * (CD8 +), φ (WC1 +) for each time point.
Figure 4
Figure 4
MAP PCR positivity in blood and faeces of HAV and Sham vaccinated calves. Percentage of animal samples that were positive for MAP by PCR. MAP was assessed in PBMC from HAV vaccinated calves (triangles), PBMC from Sham vaccinated calves (squares) and faeces from Sham vaccinated calves (crosses). Faeces of HAV vaccinated calves were consistently negative (data not shown) from immediately prior to boost vaccination (week -5) up to 36 weeks post challenge.
Figure 5
Figure 5
Expression of antigen specific IL-17, IL-22 and IL-23 by PBMC from HAV- and Sham-vaccinated calves. Fold increases, relative to GAPDH. in expression of cytokines A. IL-17, B. IL-22 and C. IL-23 measured by qPCR from RNA extracted from 24 h PPD-J stimulated PBMC isolated from HAV vaccinated (triangles) or Sham vaccinated (squares) calves, taken immediately prior to MAP challenge (week 0) up to 36 weeks post challenge. Significance between groups is indicated as * P < 0.05.
Figure 6
Figure 6
MAP killing efficiency of macrophage fractions. Percentage of an initial MAP inoculum killed after infection for 5 days in macrophages isolated from HAV vaccinated (diamonds) or Sham vaccinated (squares) calves taken immediately prior to HAV boost (week -5) up to 36 weeks post challenge. Values given are averages of bovine IFN-γ stimulated and unstimulated preparations performed in duplicate. Significance between groups is indicated as * P < 0.05, ** P < 0.01, *** P < 0.001.
Figure 7
Figure 7
Secretion of IL-1β and IL-10 by PBMC from HAV- and Sham-vaccinated animals. At the indicated time points post-MAP challenge PBMC were isolated from HAV-vaccinated (triangle) or Sham-vaccinated (grey square) calves and stimulated for 24 h with PPD-J or left unstimulated (control). Supernatants were assessed for the presence of A. IL-1β and B. IL-10 in triplicate by ELISA and concentrations of secreted cytokine were assessed relative to standard curve. The mean +/- SD PPD-J specific (PPD-J induced cytokine concentration – unstimulated cytokine concentration) is shown for n = 6 (HAV-vaccinated) or n = 5 (Sham-vaccinated) animals including samples taken week -11, immediately prior prime vaccination; week -5, immediately prior boost vaccination; week 0, immediately prior to MAP challenge and up to 36 weeks post challenge. Significance between groups is indicated as * P < 0.05, ** P < 0.01.
Figure 8
Figure 8
FoxP3 expression by T cell sub-populations from HAV- and Sham-vaccinated animals. PBMC from HAV-vaccinated (diamond) or Sham-vaccinated (square) calves were stimulated for 24 h with PPD-J or left unstimulated (control), then washed, fixed, permeablised and assessed for expression of A. CD4, B. WC1 and C. CD8. Cells were gated as live PBMC and the percentage of each cell population (CD4, CD8, WC1) expressing FoxP3 was calculated. Samples taken include week 0, immediately prior to MAP challenge and then up to 36 weeks post challenge. Significance between groups is indicated as * P < 0.05, ** P < 0.01, *** P < 0.001.
Figure 9
Figure 9
MAP load in tissue 38 weeks post challenge. Mean and SEM of genome equivalents determined by MAP specific IS900 qPCR (assuming 17 copies per organism) in weighed samples of various tissue sites (4 lymph node, 3 ileum, 6 jejunum, 2 duodenum, 1 spleen, per animal) from HAV vaccinated (triangles) and Sham vaccinated (squares) calves taken 38 weeks post MAP challenge. Each point represents an average of all samples taken from each tissue site in a single animal with individual sample values being derived from averages of duplicate qPCR performed on DNA extracted from each sample. Mann-Whitney U tests show Sham vaccinated animals had significantly greater loads than HAV vaccinated animals in duodenum (P = 0.003), jejunum (P = 0.009) and spleen (P = 0.002).
Figure 10
Figure 10
FoxP3 and CD45RO cell populations in gut tissue 38 weeks post challenge. Percentage of CD4+, WC1 +, CD8 + cells in mucosal and lymph node tissue from ileal, ileocaecal valve sites A. total fraction; B. fraction expressing FoxP3; C. fraction expressing CD45RO from HAV vaccinated (black) or Sham vaccinated (grey) taken 38 weeks post challenge. Significance between groups is indicated as * P < 0.05, ** P < 0.01.

References

    1. Harris NB, Barletta RG. Mycobacterium avium subsp. paratuberculosis in Veterinary Medicine. Clin Microbiol Rev. 2001;14:489–512. doi: 10.1128/CMR.14.3.489-512.2001. - DOI - PMC - PubMed
    1. Olsen I, Lundin KE, Sollid LM. Increased frequency of intestinal CD4+ T cells reactive with mycobacteria in patients with Crohn’s disease. Scand J Gastroenterol. 2013;48:1278–1285. doi: 10.3109/00365521.2013.837952. - DOI - PMC - PubMed
    1. Hines ME, 2nd, Turnquist SE, Ilha MR, Rajeev S, Jones AL, Whittington L, Bannantine JP, Barletta RG, Grohn YT, Katani R, Talaat AM, Li L, Kapur V. Evaluation of novel oral vaccine candidates and validation of a caprine model of Johne’s disease. Front Cell Infect Microbiol. 2014;4:26. doi: 10.3389/fcimb.2014.00026. - DOI - PMC - PubMed
    1. Juste RA, Alonso-Hearn M, Molina E, Geijo M, Vazquez P, Sevilla IA, Garrido JM. Significant reduction in bacterial shedding and improvement in milk production in dairy farms after the use of a new inactivated paratuberculosis vaccine in a field trial. BMC Res Notes. 2009;2:233. doi: 10.1186/1756-0500-2-233. - DOI - PMC - PubMed
    1. Reddacliff L, Eppleston J, Windsor P, Whittington R, Jones S. Efficacy of a killed vaccine for the control of paratuberculosis in Australian sheep flocks. Vet Microbiol. 2006;115:77–90. doi: 10.1016/j.vetmic.2005.12.021. - DOI - PubMed

Publication types

MeSH terms