. 2014 Dec 4;159(6):1327-40.
doi: 10.1016/j.cell.2014.11.023.

Environment drives selection and function of enhancers controlling tissue-specific macrophage identities

Affiliations

Environment drives selection and function of enhancers controlling tissue-specific macrophage identities

David Gosselin et al. Cell. .

Abstract

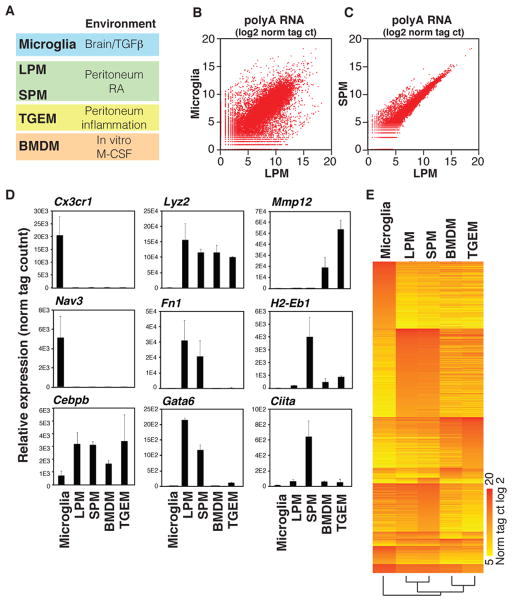
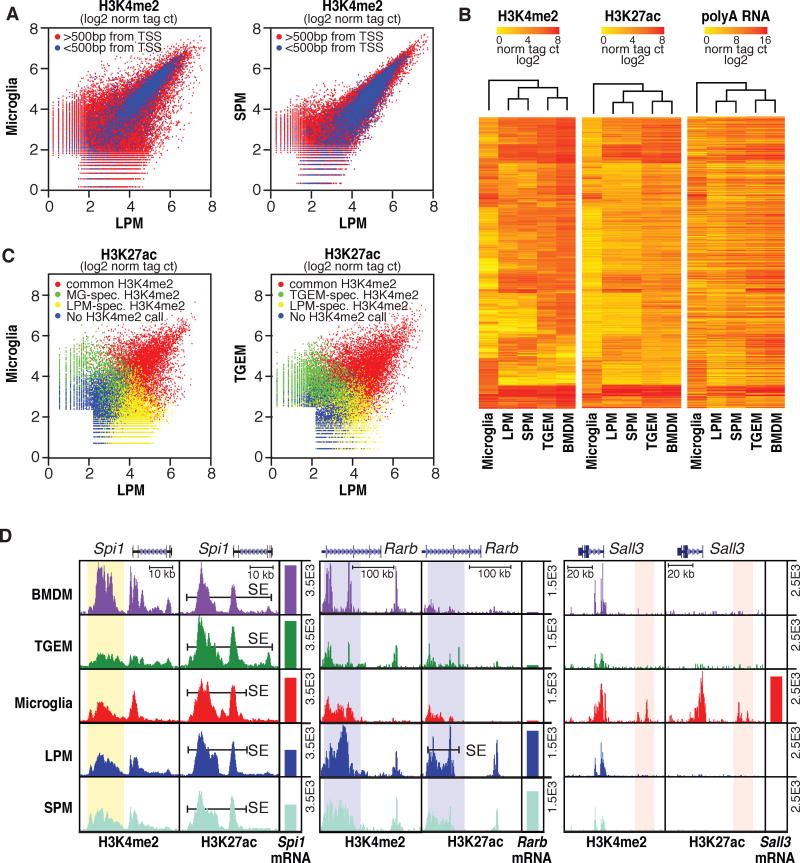
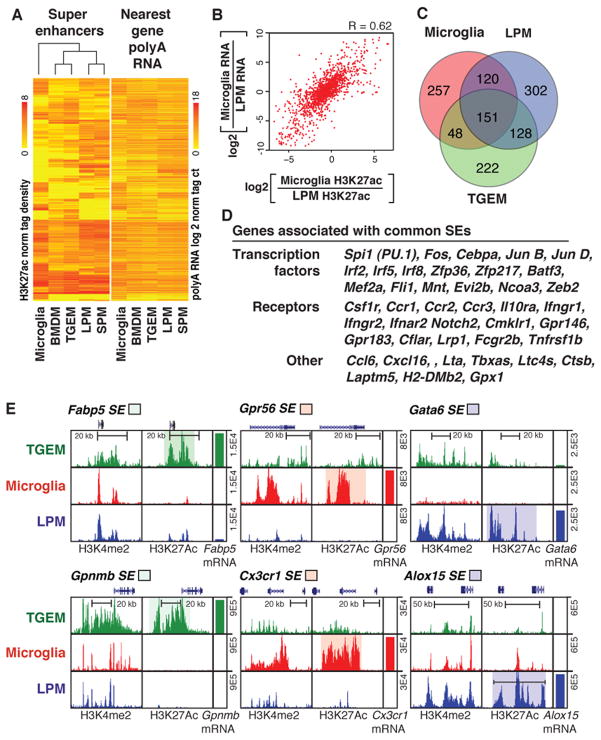
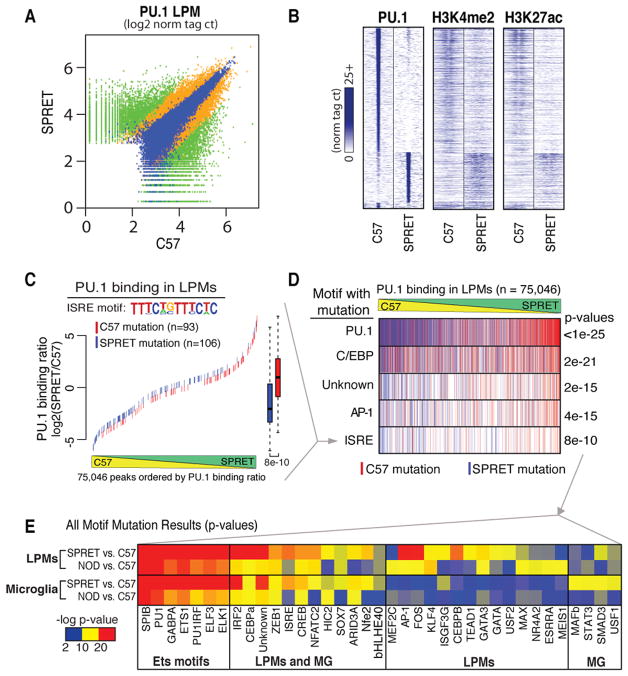
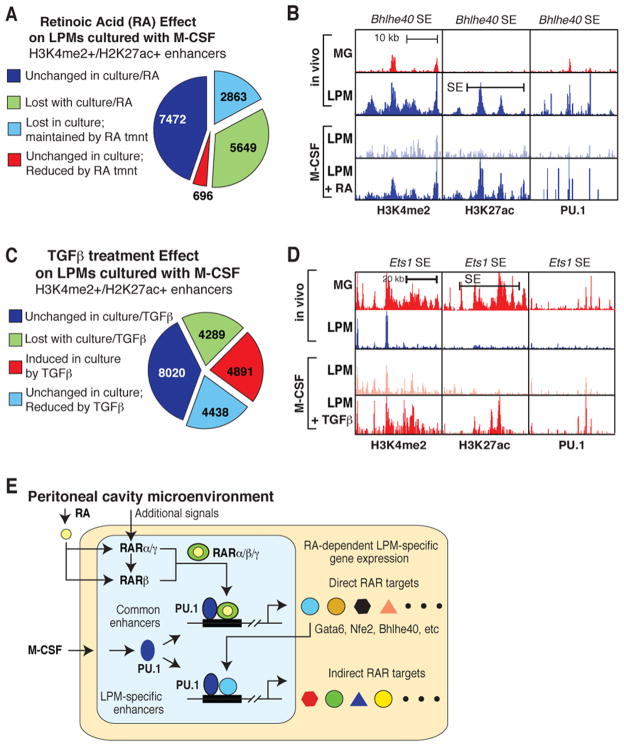
Macrophages reside in essentially all tissues of the body and play key roles in innate and adaptive immune responses. Distinct populations of tissue macrophages also acquire context-specific functions that are important for normal tissue homeostasis. To investigate mechanisms responsible for tissue-specific functions, we analyzed the transcriptomes and enhancer landscapes of brain microglia and resident macrophages of the peritoneal cavity. In addition, we exploited natural genetic variation as a genome-wide "mutagenesis" strategy to identify DNA recognition motifs for transcription factors that promote common or subset-specific binding of the macrophage lineage-determining factor PU.1. We find that distinct tissue environments drive divergent programs of gene expression by differentially activating a common enhancer repertoire and by inducing the expression of divergent secondary transcription factors that collaborate with PU.1 to establish tissue-specific enhancers. These findings provide insights into molecular mechanisms by which tissue environment influences macrophage phenotypes that are likely to be broadly applicable to other cell types.


Conflict of interest statement

The authors declare no conflict of interest.

Figures

Figure 1
Figure 1. Variation in gene expression in different macrophage subsets
A. Macrophage subsets used for analysis and corresponding environmental factors (See Figure S1A, B for sorting protocols). B, C. Scatterplots illustrating relative gene expression of polyA-selected RNA transcripts in MG compared to LPMs (B), and SPMs compared to LPMs (C) Values are log2 of tag counts normalized to 107 uniquely mapped tags. See Figure S1C for representative replicate. D. Relative gene expression values (mean ±S.D.) for the indicated genes are shown from replicate RNA-Seq experiments. E. Heat map of transcripts exhibiting an expression value of at least 64 normalized tags in at least one subset, and differing in expression by at least 16-fold in at least one other of the indicated subsets. See also Table S1.
Figure 2
Figure 2. Variation in enhancer landscapes in different macrophage subsets
A. Scatterplots of normalized H3K4me2 tag counts at genomic regions marked by significant H3K4me2 tags (>32 tags, 0.1% FDR) in LPMs and/or MG (left) or LPMs and/or SPMs (right). Points colored in blue are within 500 bp of a TSS. See Figure S2 for representative replicates. B. Heatmaps of normalized H3K4me2, H3K27ac and nearest expressed gene RNA-Seq tag counts at genomic locations showing >4-fold pairwise differences in H3K4me2 tag counts between at least two of the five macrophage subtypes. Row order is the same for all three data types. C. Scatterplots of normalized H3K27ac tag counts at genomic regions marked by significant H3K27ac tags (>32 tags, 0.1% FDR) in LPMs and/or MG (left) or LPMs and/or SPMs (right). Points are colored red if genomic locations are also marked by H3K4me2 (>16tags) in both subsets, green if marked by H3K4me2 selectively in MG (left) or SPMs (right), yellow if marked by H3K4me2 selectively in LPMs, or blue if not associated with H3K4me2 in either subset. D. UCSC browser images of selected genomic regions with corresponding RNA-Seq data plotted as bar graphs. Bars labeled SE indicate super enhancers and vertical highlights designate regions of interest for subset-common (Spi1) or subset-specific (Rarb and Sall3) loci. All data are normalized to input and library dimension. See also Tables S2–4.
Figure 3
Figure 3. Variation in super enhancer landscapes in different macrophage subsets
A. Heat maps of H3K27ac tag densities at super enhancers and RNA-Seq tag densities at nearest expressed genes. Rows are ordered the same for both plots. B. Scatter plot of the relationship between ratio of MG to LPMs H3K27ac tag density at super enhancers (x-axis) and the ratio of nearest gene expression (y-axis). C. Venn diagram indicating overlap and specificity of super enhancers in MG, LPMs and TGEMs. D. Examples of genes associated with common super enhancers. E. UCSC genome browser images of selected subset-specific super enhancers and associated genes with subsets-specific regions of interest highlighted.
Figure 4
Figure 4. PU.1 binds to subset-specific enhancers
A. Scatterplot of normalized tag counts for PU.1 peaks in MG versus LPMs. Points colored blue are within 500 bp of the TSS. B. UCSC genome browser images of PU.1 binding in the vicinity of the Msr1 and Nav2 genes in MG and LPMs cells and association with H3K27ac highlighting specific regions. C. Motifs enriched in the vicinity of PU.1 binding sites that are specific for LPMs versus MG using a random GC-corrected genomic background (top) or a background corresponding to MG-specific PU.1 peaks (bottom). D. Motifs enriched in the vicinity of PU.1 binding sites that are specific for MG using a random GC-corrected genomic background. E. Distribution plots of motif frequencies (y-axis) for the indicated motifs within 400bp centered on the PU.1 motif at genomic loci bound specifically by PU.1 in LPMs (blue) or MG (red).
Figure 5
Figure 5. Motif mutations in potential PU.1 collaborating transcription factors confirm cooperative binding for subset-common and subset-specific factor combinations
A. PU.1 binding between SPRET and C57 is shown at for 200 bp regions where green signifies differential binding (>4 fold, p<1E-4, n = 13,199), blue similar binding (<4 fold, p<1E-4, n = 11,022) and orange in between (n = 12,367). B. Heatmap of 2 kb differentially-bound PU.1 genomic regions (rows) centered on PU.1 binding for ChIP-Seq tags of PU.1, H3K4me2 and H3K27ac between C57 and SPRET (columns). C. An example of motif mutation analysis is shown for the ISRE motif. 200 bp genomic sequence at all PU.1 bound loci (in A) were queried for genetic variants that mutated the ISRE motif matrix in either C57 or SPRET. Mutations were colored according to the genome mutated; red = C57, blue = SPRET. ISRE mutations were plotted according to the PU.1 binding strain ratio (y-axis) as measured in LPMs at that locus and rank-ordered on the x-axis. Boxplots of corresponding color indicate the effect of ISRE motif mutations on PU.1 binding where whiskers extend to data extremes and p-value are from two-sided t-test. D. Results from analyses described in C are vertically compressed and shown in rows for PU.1, C/EBP, Unknown, AP-1, and ISRE motif mutation events. E. Heatmap showing p-values resulting from analysis described in C and D for motif mutations best matching transcription factors indicated on x axis. Each motif was tested for affecting PU.1 binding between C57 and NOD and between C57 and SPRET both in MG and LPMs (y-axis). See also Figure S3 and Tables S5 and S6.
Figure 6
Figure 6. Environmental influence on gene expression in LPMs and microglia
A, B. Scatter plots illustrating relative gene expression of RNA transcripts in freshly isolated LPMs compared to LPMs maintained in culture for 7 days (A), and freshly isolated MG compared to MG in culture for 7 days (B). Genes specific to LPMs are colored blue in A and specific to MG are red in B. C. Normalized gene expression values for members of the RAR and TGF-β receptor family members. D. Heatmap showing the fold-change of RNAs for the indicated transcription factors upon removal from the peritoneal cavity and culture with IL-34 or M-CSF. E, F. Effects of chronic stimulation with 2μM ATRA (E) on LPM-Specific or common mRNAs or TGF-β1 (F) on MG-specific or common mRNAs. G. qPCR validation of induced expression by ATRA of key transcription factors in cultured LPMs (error bars = S.D.). See also Figure S4.
Figure 7
Figure 7. Environmental influence on enhancer landscapes in LPMs and microglia
A. Effects of culture environment and 2μM ATRA chronic stimulation on the enhancer landscape of LPMs. B. UCSC browser images displaying effects of culture environment and 2μM ATRA chronic stimulation on H3K4me2, H3K27ac, and PU.1 binding at the Bhlhe40 locus in LPMs. C. Effects of culture environment and chronic stimulation with TGF-β1 on the enhancer landscape of LPMs. D. UCSC browser images displaying effects of culture environment and chronic stimulation with TGF-β1 on H3K4me2, H3K27ac, and PU.1 binding at the Ets1 locus in LPMs. E. Hierarchical model for mechanisms by which the peritoneal environment induces the enhancer landscape and gene expression signature of LPMs. See text for details. See also Table S7.

Comment in

References

    1. Andersson R, Gebhard C, Miguel-Escalada I, Hoof I, Bornholdt J, Boyd M, Chen Y, Zhao X, Schmidl C, Suzuki T, et al. An atlas of active enhancers across human cell types and tissues. Nature. 2014;507:455–461. - PMC - PubMed
    1. Andrews NC. The NF-E2 transcription factor. The international journal of biochemistry & cell biology. 1998;30:429–432. - PubMed
    1. Barozzi I, Simonatto M, Bonifacio S, Yang L, Rohs R, Ghisletti S, Natoli G. Coregulation of transcription factor binding and nucleosome occupancy through DNA features of mammalian enhancers. Mol Cell. 2014;54:844–857. - PMC - PubMed
    1. Boudjelal M, Taneja R, Matsubara S, Bouillet P, Dolle P, Chambon P. Overexpression of Stra13, a novel retinoic acid-inducible gene of the basic helix-loop-helix family, inhibits mesodermal and promotes neuronal differentiation of P19 cells. Genes & development. 1997;11:2052–2065. - PMC - PubMed
    1. Brown JD, Lin CY, Duan Q, Griffin G, Federation AJ, Paranal RM, Bair S, Newton G, Lichtman AH, Kung AL, et al. NF-kappaB Directs Dynamic Super Enhancer Formation in Inflammation and Atherogenesis. Mol Cell 2014 - PMC - PubMed

Publication types

Substances

Associated data