

doi: 10.3324/haematol.2014.118786.
Epub 2014 Dec 5.
The 7p15.3 (rs4487645) association for multiple myeloma shows strong allele-specific regulation of the MYC-interacting gene CDCA7L in malignant plasma cells
Affiliations
- PMID: 25480495
- PMCID: PMC4349291
- DOI: 10.3324/haematol.2014.118786
Item in Clipboard
The 7p15.3 (rs4487645) association for multiple myeloma shows strong allele-specific regulation of the MYC-interacting gene CDCA7L in malignant plasma cells
Haematologica.
2015 Mar.
No abstract available
Keywords: eQTL; multiple myeloma; risk; single nucleotide polymorphism.
Figures
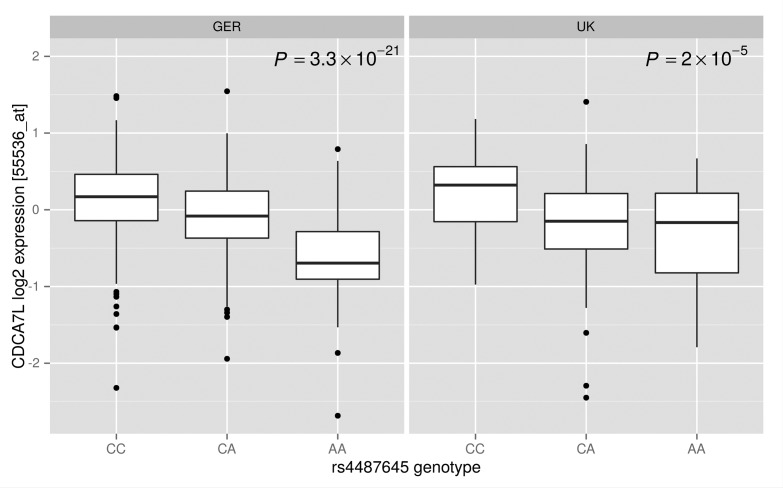
Relationship between rs4487645 (7p15.3) genotype and CDCA7L expression in CD138+ selected plasma cells from 665 German and 183 UK myeloma patients. Expressions sets were analyzed using PEER, to infer broad variance components in the data and computed residuals of expression were used for eQTL analyses.
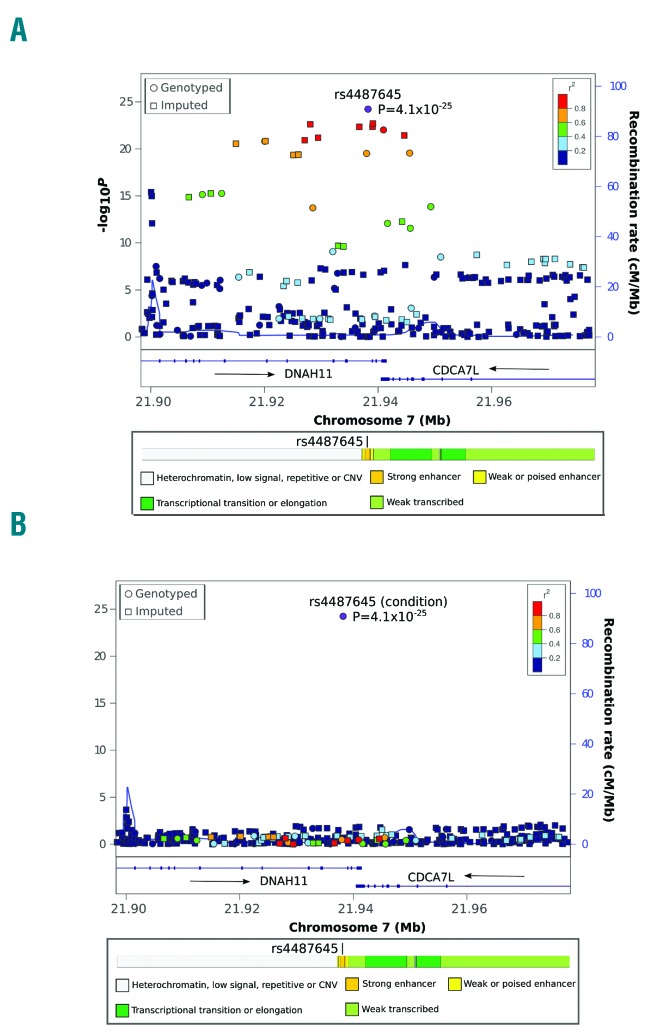
eQTL meta-analysis of the association between SNP genotype and CDCA7L expression at 7p15.3 (A) and the same data conditioned on rs4487645 (B). Directly genotyped SNPs are denoted by circles and imputed SNPs by squares. Associations −log10 P values (y-axis) of the SNPs are shown according to their chromosomal position (x-axis). The MM risk SNP rs4487645 is represented by a purple circle in (A) and (B). The color code of each symbol reflects the extent of LD with the risk SNP. Genetic recombination rates (cM/Mb), estimated using HapMap CEU samples, are shown in light blue lines. Physical positions are based on NCBI build 36 of the human genome. Also shown are the relative positions of genes and transcripts mapping to the region of association. On the bottom are shown all transcripts and the chromatin-state segmentation track (ChromHMM) for lymphoblastoid cells based on HapMap ENCODE Project data.
References
-
- Fletcher O, Houlston RS. Architecture of inherited susceptibility to common cancer. Nat Rev Cancer. 2010;10(5):353–361. - PubMed
-
- Walker BA, Leone PE, Jenner MW, et al. Integration of global SNP-based mapping and expression arrays reveals key regions, mechanisms, and genes important in the pathogenesis of multiple myeloma. Blood. 2006;108(5):1733–1743. - PubMed
Publication types
MeSH terms
Substances
LinkOut - more resources
Full Text Sources
Other Literature Sources
Medical
